


Farmer Sentiment Declines in April Amid Input Costs and Availability Concerns
Farmer sentiment dropped in April as the Purdue University-CME Group Ag Economy Barometer (AEB) Index declined from 127 in March to 121 (see Figure 1). The Current Conditions Index fell by 11 points, while the Future Expectations Index decreased by 4 points (see Figure 2). This month’s Future Expectations Index was 16 points below last year’s December index and 28 points below last year’s April index. The percentage of respondents who listed high input costs as their biggest concern remained at 46% this month, while the percentage who listed input availability as their biggest concern increased from 11% to 14%. The percentage of respondents who think the U.S. is headed in the “right direction” and who expect land prices to be higher five years from now also decreased. The April barometer survey was conducted among 400 farmers across the nation from April 13–17, 2026.
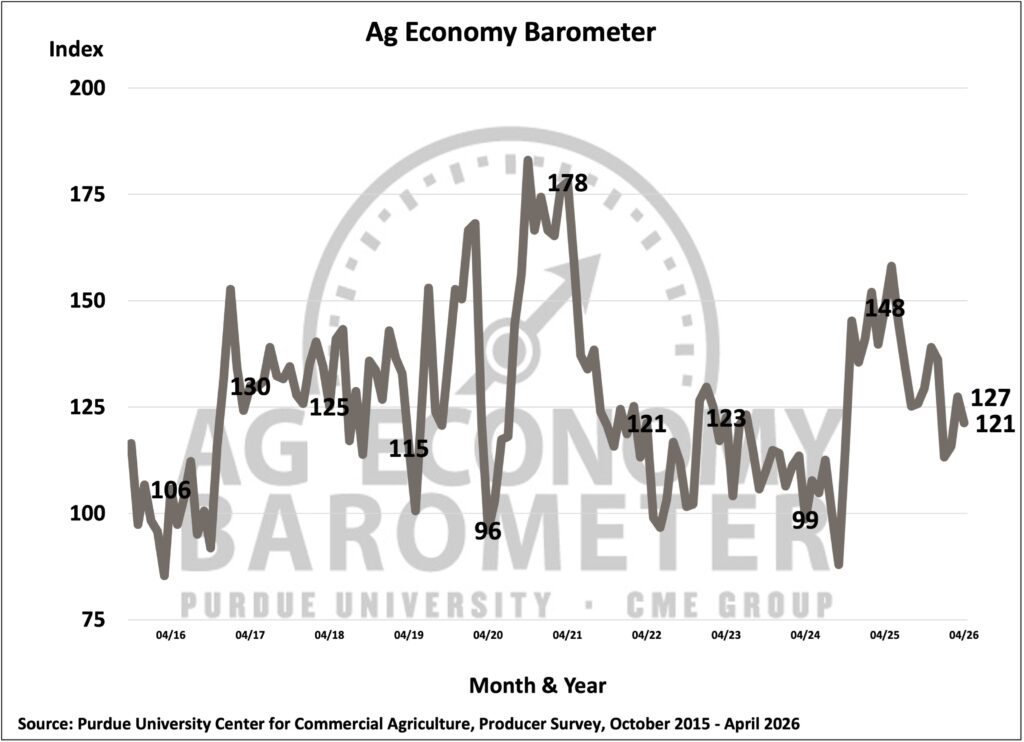
Figure 1. Purdue/CME Group Ag Economy Barometer, October 2015-April 2026.

Figure 2. Indices of Current Conditions and Future Expectations, October 2015-April 2026.
Only 15% of respondents indicated that their farm operations were better off in April than they had been a year ago. Looking ahead to the next 12 months, 28% expected worse financial performance, compared with 25% who expected better financial performance. The Farm Capital Investment Index fell 9 points to 44, its lowest level since October 2024, indicating a decline in willingness to make large investments (see Figure 3).
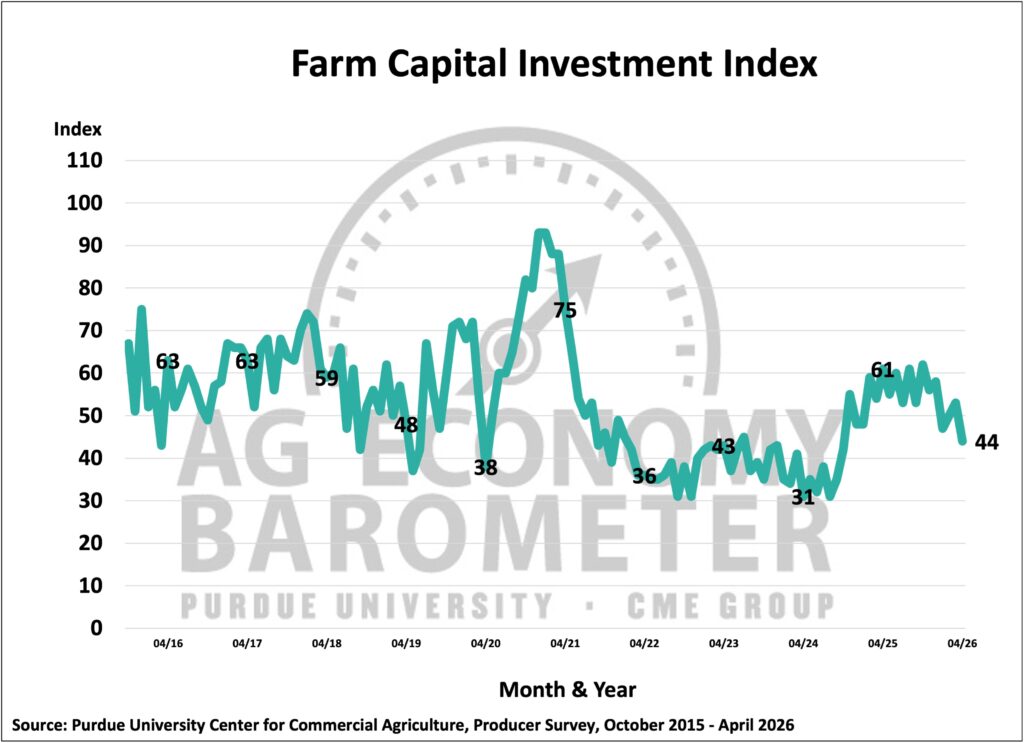
Figure 3. Farm Capital Investment Index, October 2015-April 2026.
This month’s survey included questions related to the impact of the Iran conflict on net farm income and corn breakeven prices in 2026. Approximately two-thirds of the respondents expected their net farm income to decline in 2026 due to the Iran conflict, which began in late February and affected fertilizer and natural gas prices worldwide (see Figure 4).
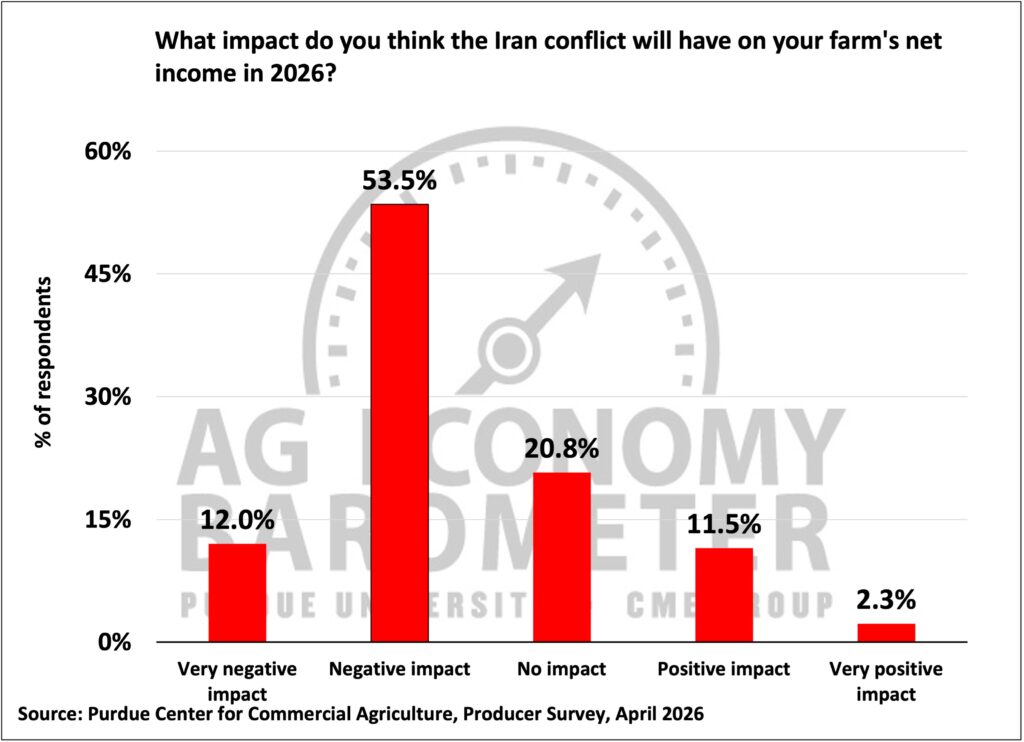
Figure 4. Expected Impact of Iran Conflict on Farm’s Net Income in 2026, April 2026.
Among respondents who planted corn in 2025, approximately one-half expected corn breakeven prices to increase by up to 6%, 14% expected breakeven prices to increase 6% to 9%, and 37% expected breakeven prices to increase 10% or more (see Figure 5).
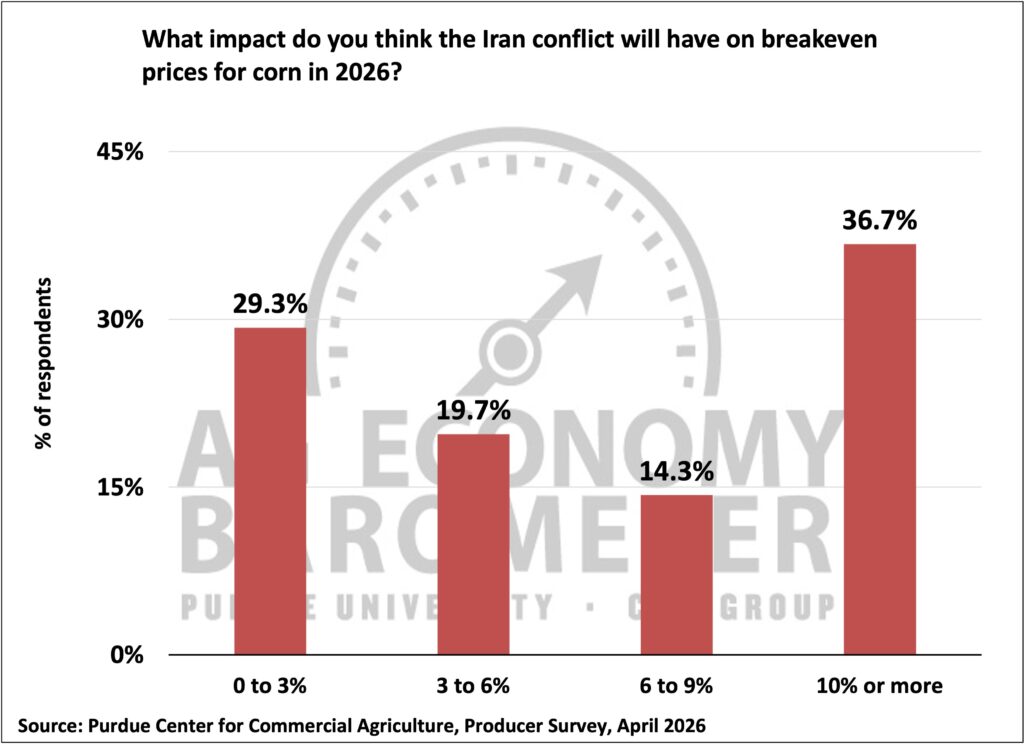
Figure 5. Expected Impact of Iran Conflict on Corn Breakeven Prices in 2026, April 2026.
Periodically, the monthly survey includes questions pertaining to a farm’s competitive position and its ability to manage strategic risk. This month’s survey asked respondents how strongly they agreed or disagreed with the following statement: We have low per-unit fixed costs relative to our most efficient peers. Approximately 58% of respondents agreed with this statement, with 9% indicating that they strongly agreed.
The Short-Term Farmland Value Expectations Index decreased from 125 to 121 (see Figure 6), and the long-term index decreased from 159 in March to 155 in April. Alternative investments, interest rates, and inflation were cited as the three factors having the greatest influence on farmland values.
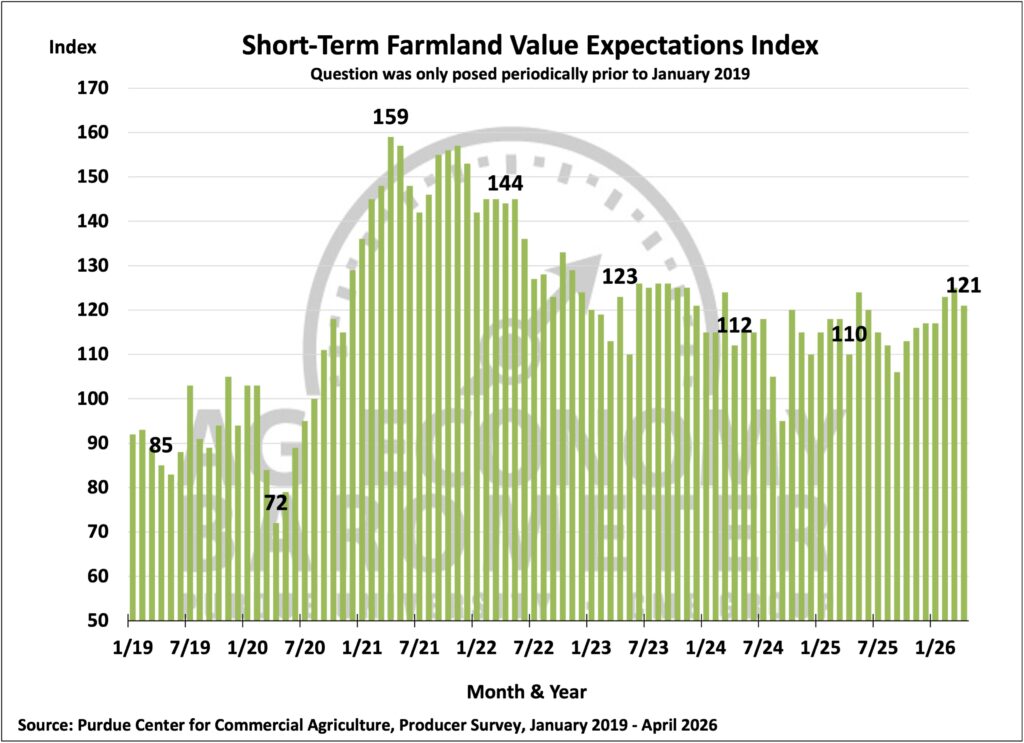
Figure 6. Short-Term Farmland Value Expectations Index, January 2019–March 2026.
As in the last few months, producers were asked whether the U.S. is headed in the “right direction” or on the “wrong track.” The percentage of producers who reported that the U.S. is headed in the “right direction” fell from 65% in March to 57% in April (see Figure 7).
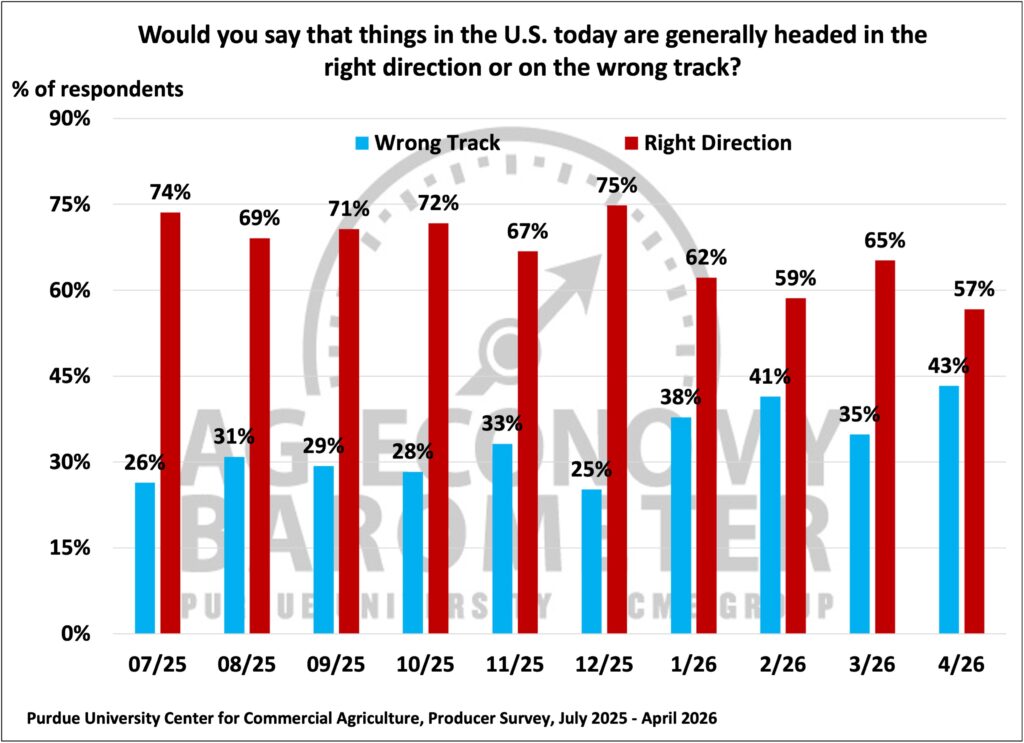
Figure 7. Are Things in the U.S. Today Headed in the Right Direction or on the Wrong Track?
Wrapping Up
Farmer sentiment decreased from 127 in March to 121 in April. The decline in sentiment regarding current conditions was larger than the corresponding decline in sentiment related to future expectations. The percentage of producers who expected good times in the next five years was 37% in April, which is 19% lower than the April 2025 survey report. There continues to be a large disparity in expectations between crop and livestock producers. Approximately 31% of respondents expected good times for crop producers, while 69% expected good times for livestock producers.
Concerns about input costs remained high, and a higher percentage of respondents indicated that input availability is a major concern, likely driven by the uncertainty the Iran conflict has caused in fertilizer markets. A lower percentage of respondents indicated that U.S. policy is headed in the “right direction”, along with a lower percentage expecting land values to increase in the next five years, pointing to less optimism regarding long-run sentiment.