


High Input-Cost Concerns Continue to Weigh on Farmer Sentiment
Farmer sentiment dropped again in June as the Purdue University-CME Group Ag Economy Barometer (AEB) Index declined from 119 points in May to 113 points in June (see Figure 1). The Index of Current Conditions fell by 5 points, while the Index of Future Expectations fell by 7 points (see Figure 2). June’s Current Conditions Index was 26 points below its December 2025 reading, reaching its lowest level since December 2024. The percentage of respondents who listed high input costs as their biggest concern was 47% in June, with the concern about low crop and livestock prices at 23% coming in as a distant second. In a related question, 42% of respondents indicated that high input costs are limiting improvements in their financial position this year. The June barometer survey was conducted among 400 farmers across the country from June 15 to 19, 2026.
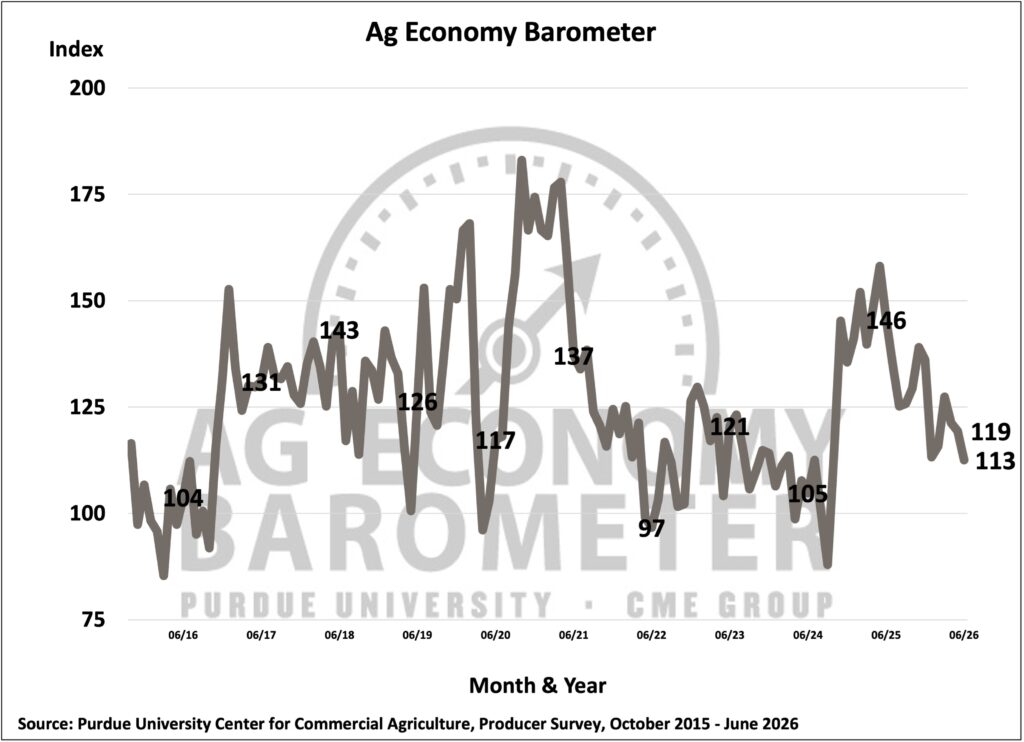
Figure 1. Purdue/CME Group Ag Economy Barometer, October 2015-June 2026.
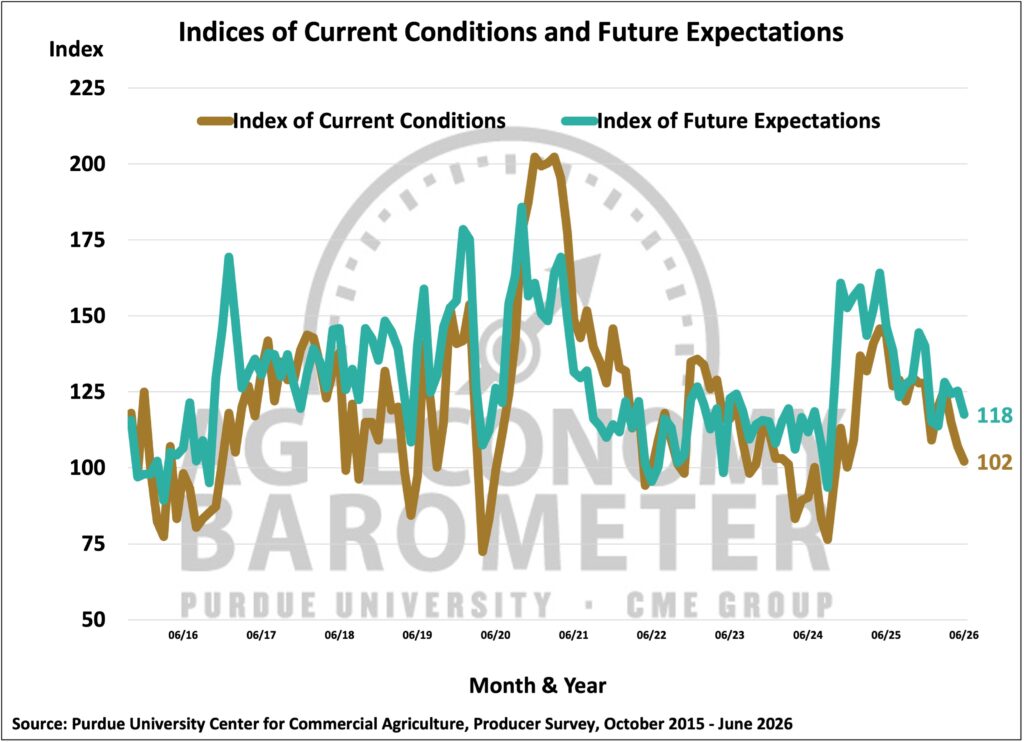
Figure 2. Indices of Current Conditions and Future Expectations, October 2015-June 2026.
Only 12% of respondents indicated that their farm operations were better off in June than they had been a year ago. Looking ahead to the next 12 months, 22% of respondents expect their farms to be better off financially a year from now. The Farm Capital Investment Index fell 1 point to 40, its lowest level since September 2024 (see Figure 3).
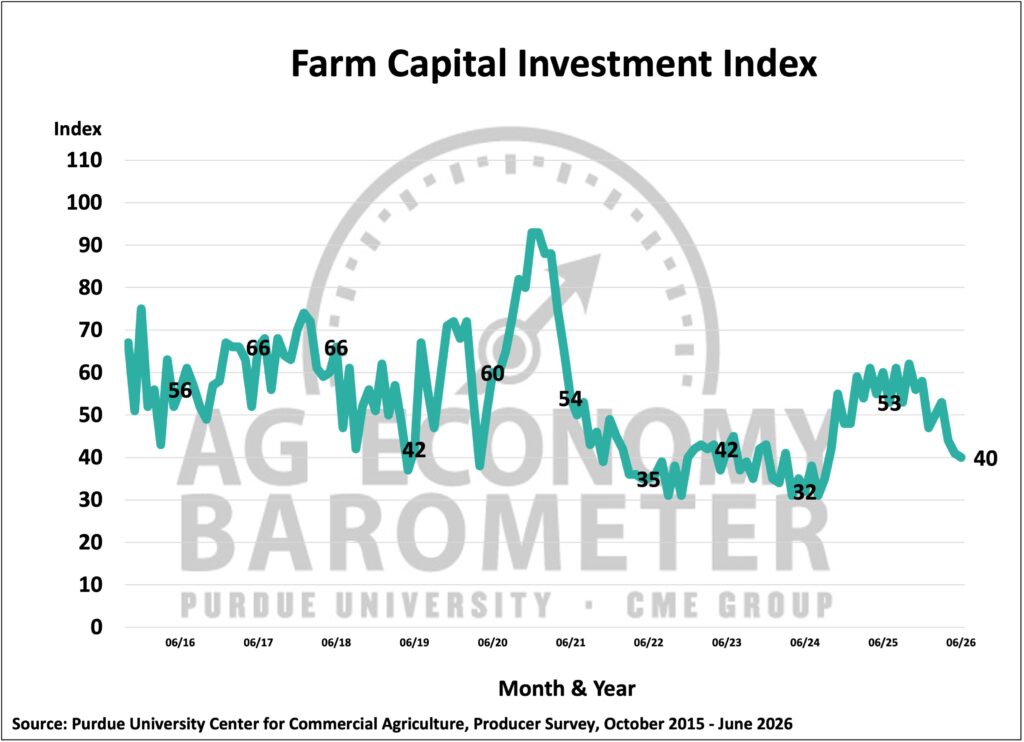
Figure 3. Farm Capital Investment Index, October 2015-June 2026.
As in last month’s survey, the June survey asked farmers to identify the main factor limiting improvement in their farm’s financial situation. High input costs were by far the most frequently cited constraint, selected by 42% of respondents. Low output prices ranked second at 17%, followed by weather risk at 14%, policy uncertainty at 11%, labor and equipment concerns at 9%, and debt or financial pressure at 8% (see Figure 4).
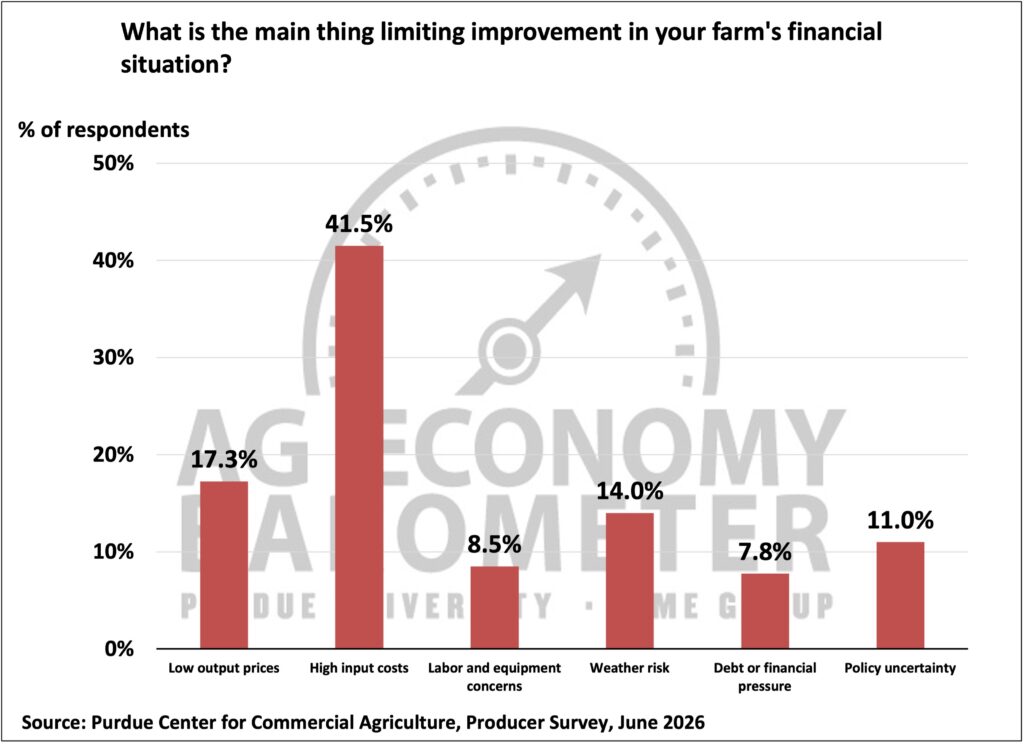
Figure 4. Primary Factors Limiting Improvement in Farms’ Financial Situation, June 2026.
This month’s survey included two questions related to the use of artificial intelligence (AI) or data-driven tools in agriculture. The first question asked survey respondents what they viewed as the main benefit of using these tools. Approximately 23% of respondents indicated that an increase in production would be the main benefit (see Figure 5). Reducing labor and reducing risk or uncertainty were chosen by 14% and 11% of respondents, respectively. Meanwhile, 52% of respondents said they did not see a meaningful benefit. A second question asked whether recommendations arising from data-driven tools would be difficult to follow. Approximately 63% of respondents indicated that recommendations would be sometimes difficult to follow, while 22% indicated that recommendations would often be difficult to follow.
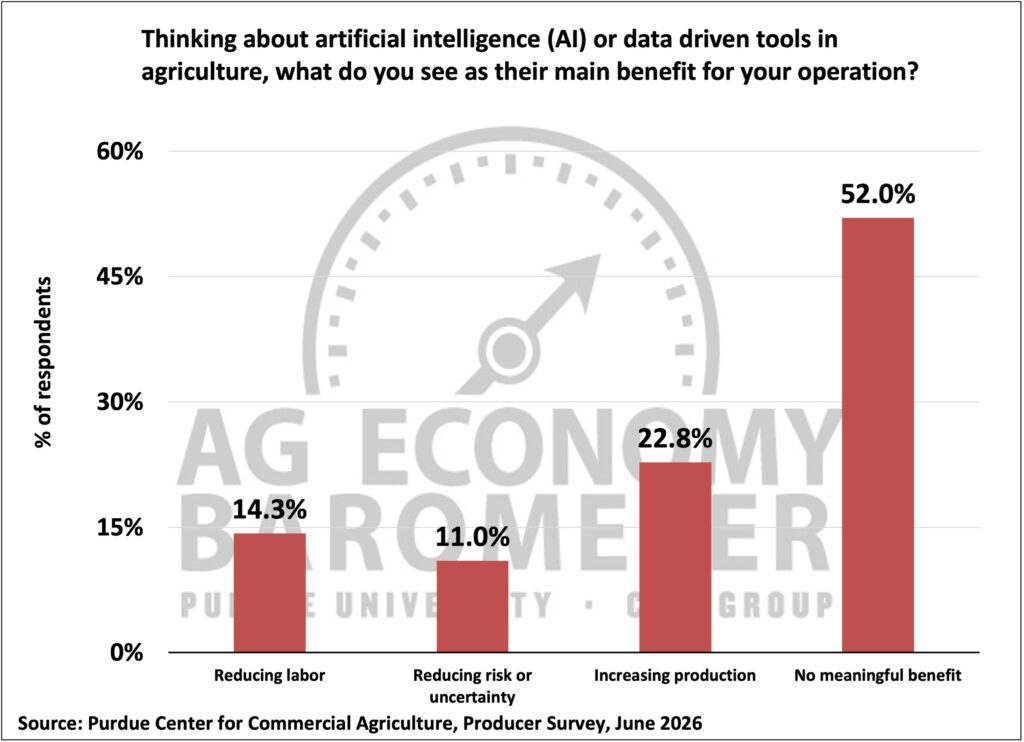
Figure 5. Benefits Associated with Data-Driven Tools, June 2026.
This month’s survey also examined agricultural exports and attitudes toward free trade. Approximately 43% of respondents expected agricultural exports to increase over the next five years, while only 9% expected agricultural exports to decline (see Figure 6). Respondents were also asked how strongly they agreed or disagreed with the following statement: “Free trade benefits agriculture and most other American industries.” Nearly 85% agreed or strongly agreed with this statement.
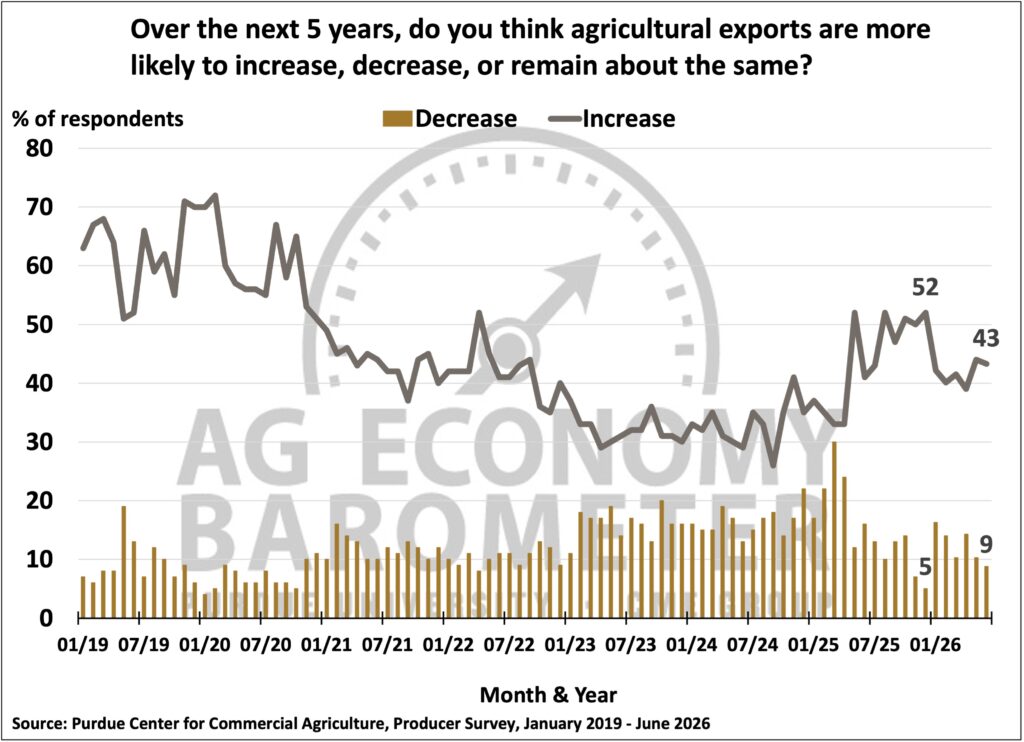
Figure 6. Expected Change in Exports During the Next Five Years, January 2019-June 2026.
The Short-Term Farmland Value Expectations Index declined from 130 in May to 124 in June (see Figure 7), while the long-term index increased to 166, tying its record high. Alternative investments, net farm income, and inflation were cited as the three factors with the greatest influence on farmland values.
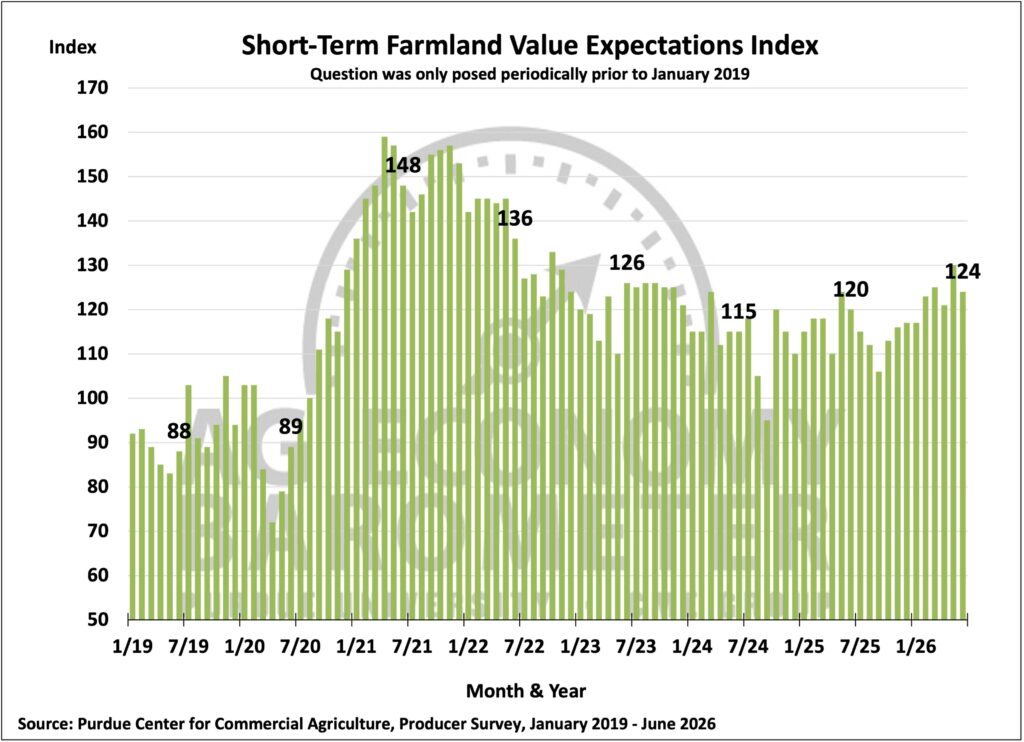
Figure 7. Short-Term Farmland Value Expectations Index, January 2019–June 2026.
Since July 2025, producers have been asked whether they think the U.S. is headed in the “right direction” or on the “wrong track.” After averaging 71% over the last six months of 2025, the percentage of producers who reported that the U.S. was headed in the “right direction” was 52% in May and 53% in June (see Figure 8).
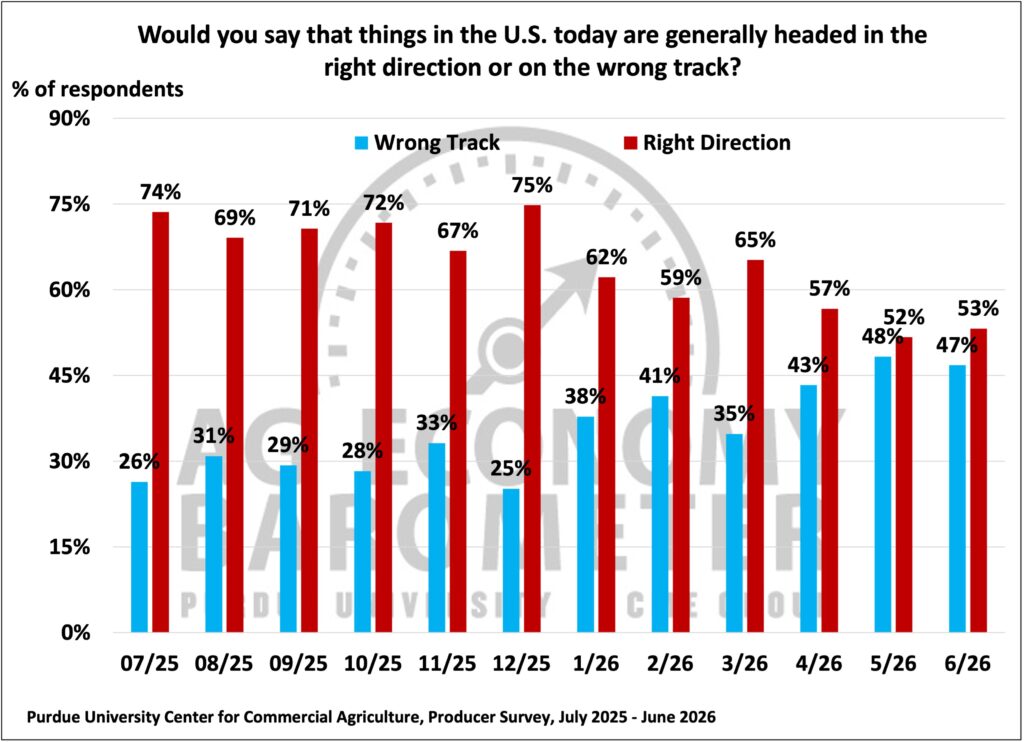
Figure 8. Are Things in the U.S. Today Headed in the Right Direction or on the Wrong Track?
Wrapping Up
Farmer sentiment decreased from 119 in May to 113 in June, with declines in sentiment regarding both current conditions and future expectations. The percentage of producers who expected good times over the next five years was 32% in June, which is 17 percentage points lower than in the June 2025 survey results. There continued to be a large disparity in expectations between crop and livestock producers. Approximately 25% of respondents expected good times for crop producers, while 68% expected good times for livestock producers.
Input costs remained a top concern, with high input costs identified as the most important factor limiting improvements in financial performance. Despite concerns about the future, respondents remained optimistic regarding both short-term and long-term land values.