


After 3 Months of Decline, Farmer Sentiment Rebounds in July
Farmer sentiment improved in July, ending three consecutive months of decline, as the Purdue University-CME Group Ag Economy Barometer (AEB) Index increased from 113 points in June to 126 points in July (see Figure 1). Both subindices also increased: the Index of Current Conditions rose by 20 points, while the Index of Future Expectations increased by 11 points (see Figure 2). This improvement came as corn and soybean prices increased from mid-June to mid-July. The percentage of respondents who listed high input costs as their biggest concern was 46% in July. When asked about their biggest challenge to success in the next five to ten years, 30% of respondents indicated that crop or livestock prices were their biggest challenge. The July barometer survey was conducted among 405 farmers across the country from July 13 to 17, 2026.
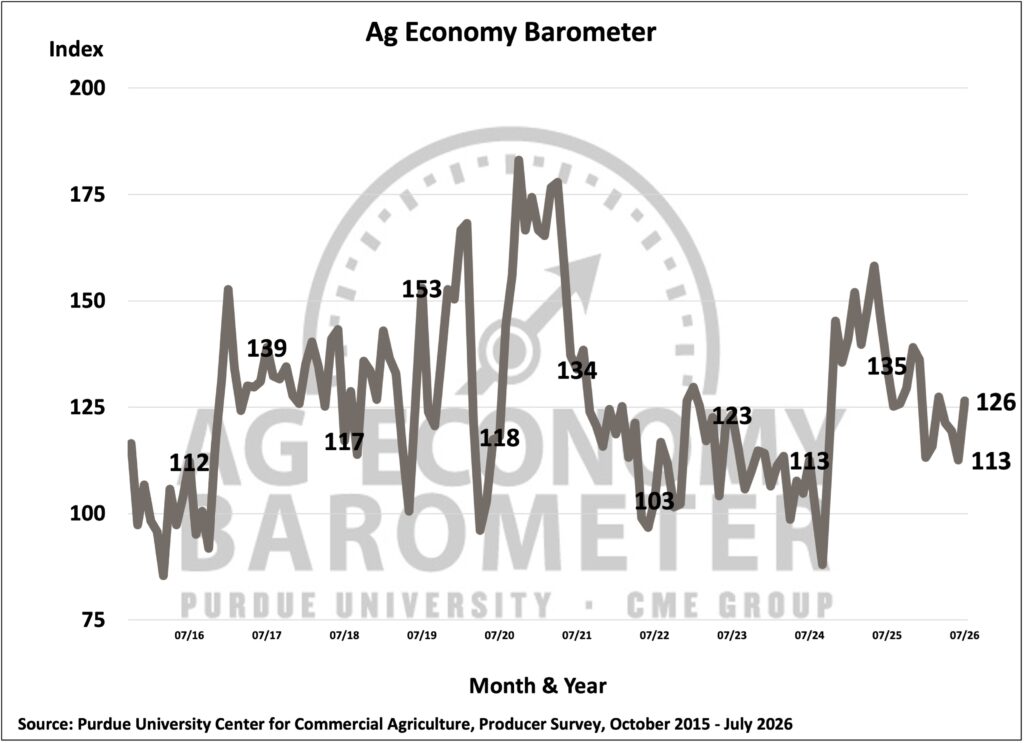
Figure 1. Purdue/CME Group Ag Economy Barometer, October 2015-July 2026.
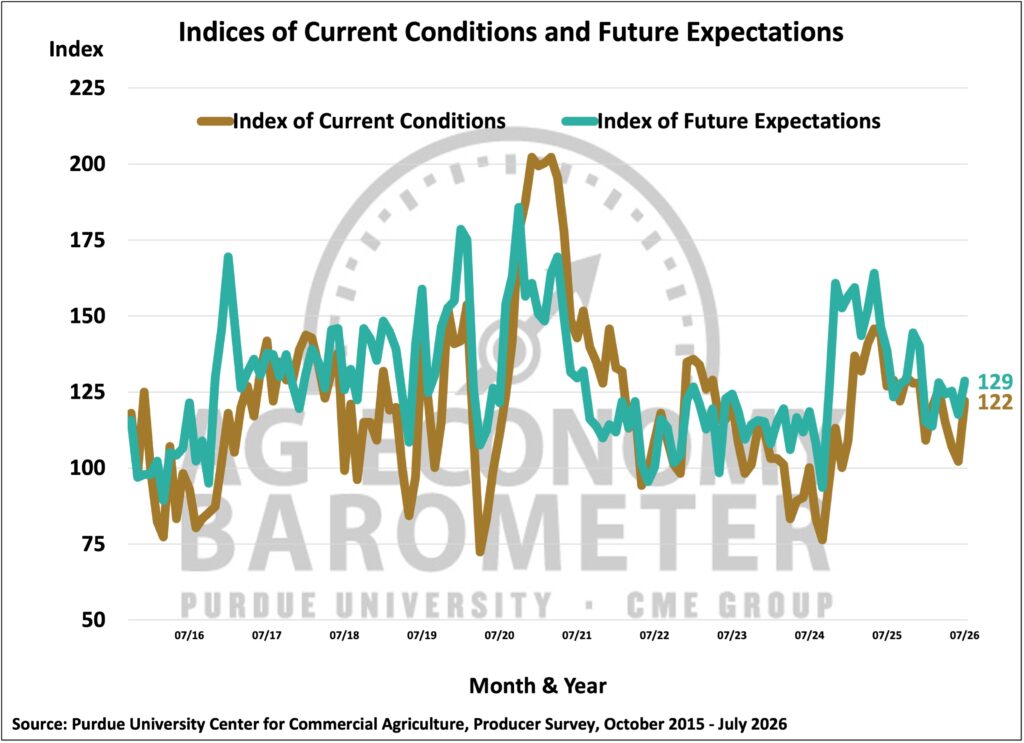
Figure 2. Indices of Current Conditions and Future Expectations, October 2015-July 2026.
Only 13% of respondents indicated that their farm operations were better off financially in July than they had been a year ago. However, looking ahead to the next 12 months, 23% of respondents expect their farms to be better off financially a year from now, compared with 24% who expect their farms to be worse off. The Farm Capital Investment Index increased by 10 points to 50, its highest level since March (see Figure 3).
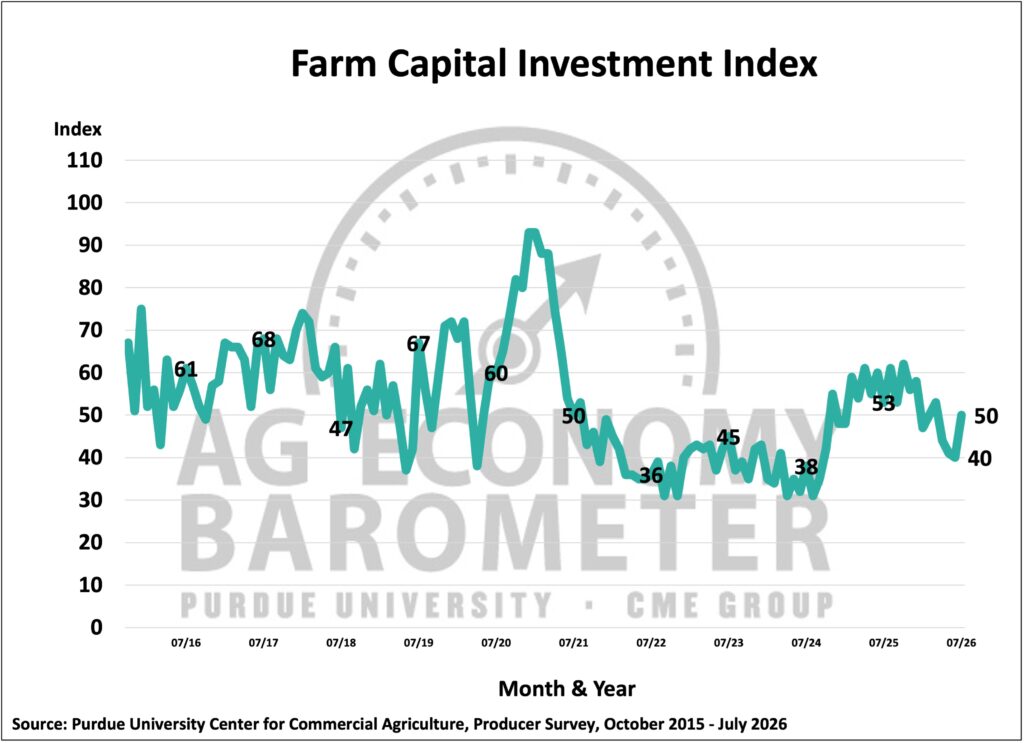
Figure 3. Farm Capital Investment Index, October 2015-July 2026.
This month’s survey asked farmers about their biggest challenge to the success of their operation over the next five to ten years. Crop or livestock prices were selected by 30%, followed by farm transition at 17%, cost control at 16%, financial considerations and weather at 13%, trade at 7%, and government policy at 3% (see Figure 4). Consistent with these results, when farmers were asked about their most crucial risk management education need, the most common response was marketing, selected by 44% of respondents. Financial risk at 17% and strategic risk at 14% were distant second and third choices.
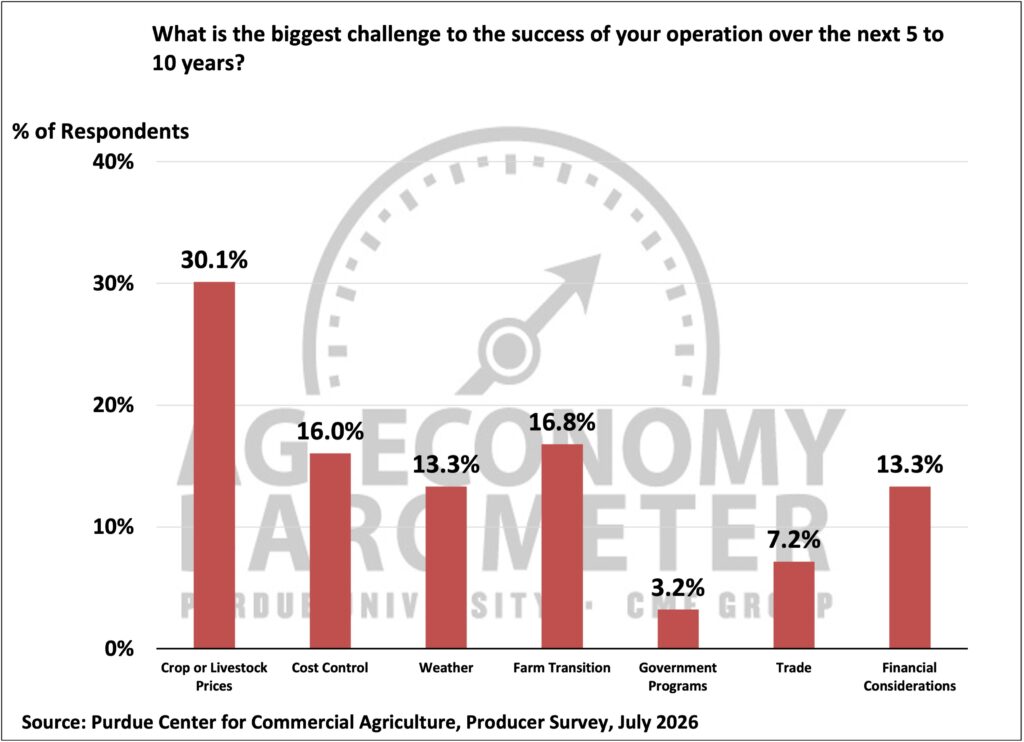
Figure 4. Biggest Long-Run Challenge to Your Operation, July 2026.
Many cash rent decisions will be made in the next few months. To gauge thoughts surrounding next year, this month’s survey asked corn, soybean, wheat, and cotton producers whether they expect cash rents to decline, remain about the same, or increase. Approximately 19% expected cash rents to increase, while only 7% expected them to decline (see Figure 5). The vast majority of respondents expected cash rents to remain about the same. Among those who expected cash rents to increase, respondents were asked whether they thought cash rents would increase by less than 5%, between 5% and 10%, or by more than 10%. The most common response among this group was an increase of 5% to 10%.
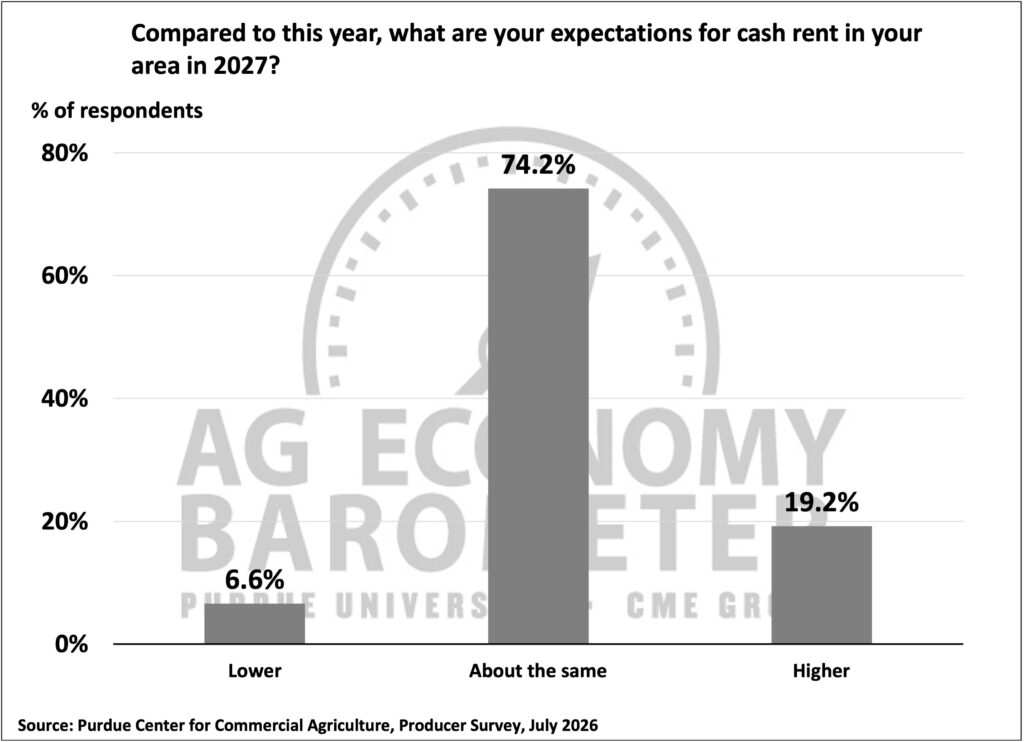
Figure 5. Cash Rent Expectations for 2027, July 2026.
This month’s survey also examined agricultural exports and attitudes toward new foreign export markets. Approximately 42% of respondents expected agricultural exports to increase over the next five years, while 13% expected exports to decline (see Figure 6). Respondents were also asked whether it was likely or unlikely that new foreign export markets would open to American agricultural goods in the next five years. Approximately 56% of respondents indicated that this development was likely. When this question was asked last July, 64% thought the prospect for new export markets was likely.
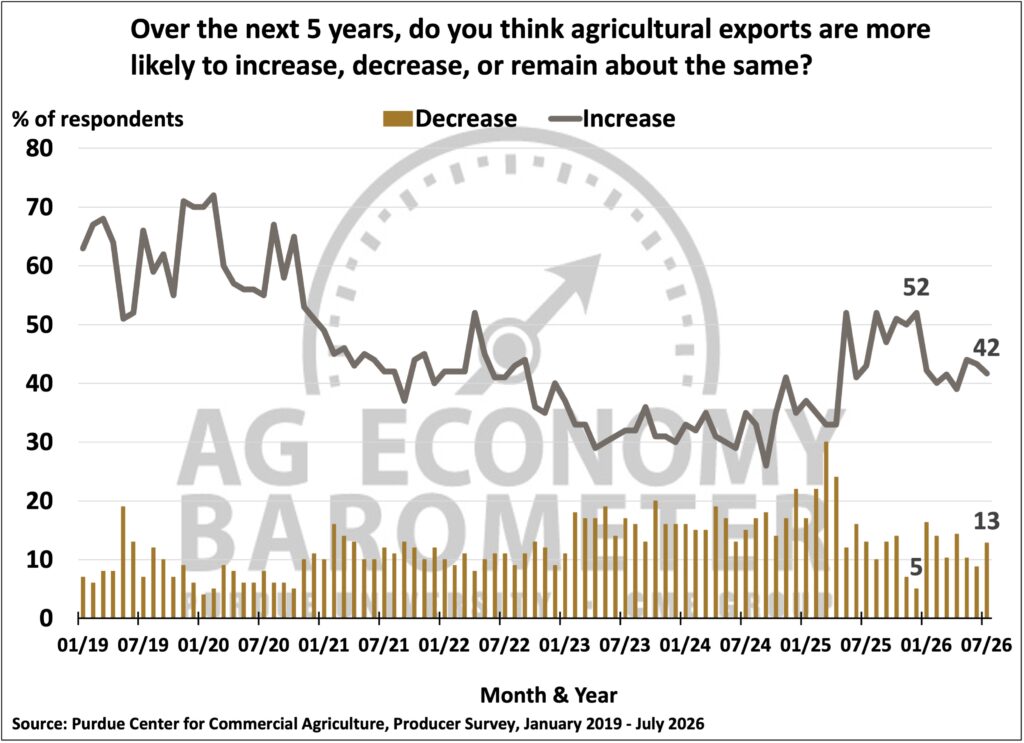
Figure 6. Expected Change in Exports During the Next Five Years, January 2019-July 2026.
Meanwhile, the Short-Term Farmland Value Expectations Index declined from 124 in June to 119 in July (see Figure 7), and the long-term index decreased from 166 to 152. Alternative investments, net farm income, and interest rates were cited as the three factors with the greatest influence on farmland values.
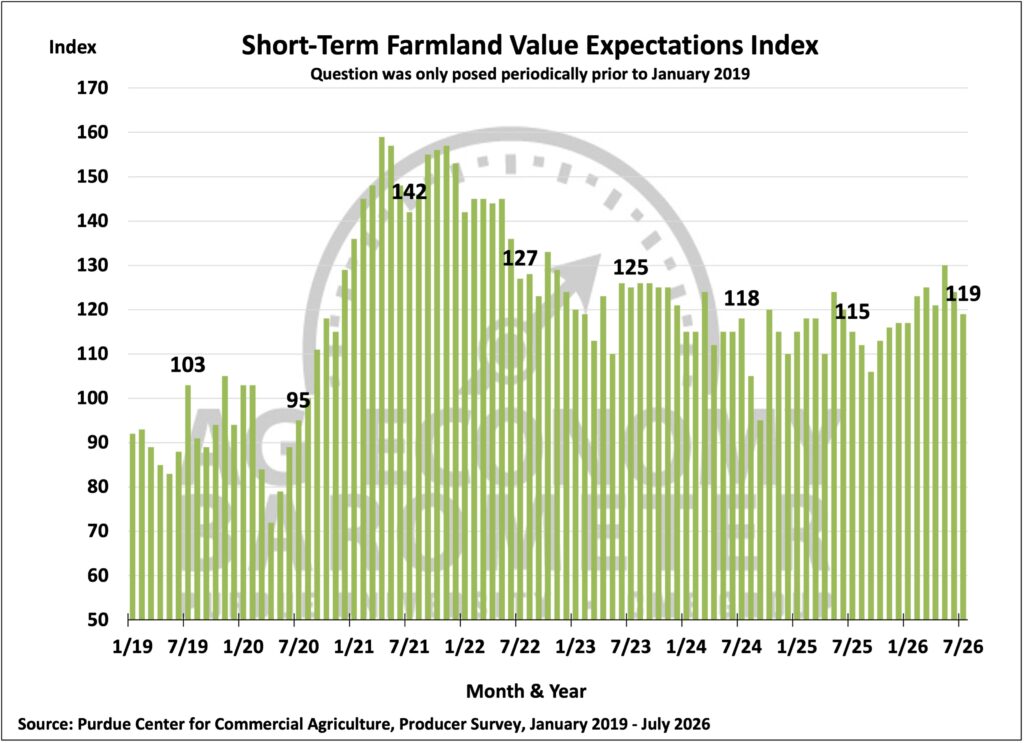
Figure 7. Short-Term Farmland Value Expectations Index, January 2019–July 2026.
Since July 2025, producers have been asked whether they think the U.S. is headed in the “right direction” or on the “wrong track.” After averaging 71% during the last six months of 2025, the percentage of producers who said the U.S. was headed in the “right direction” was 54% in July, compared with 53% in June and 52% in May (see Figure 8).
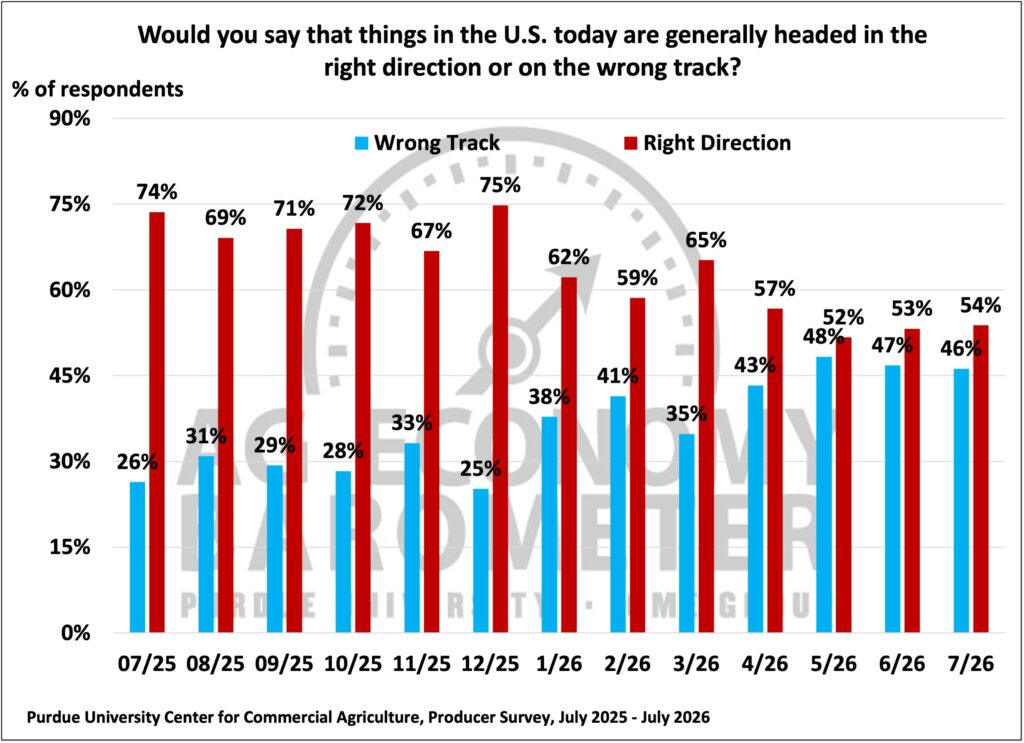
Figure 8. Are Things in the U.S. Today Headed in the Right Direction or on the Wrong Track?
Wrapping Up
Farmer sentiment rebounded in July after three consecutive months of decline, reflecting improved views of both current conditions and future expectations. The 20-point increase in the Index of Current Conditions coincided with a 10-point rise in the Farm Capital Investment Index, suggesting that producers felt somewhat more confident about current financial conditions and major investment decisions.
Despite this improvement, important concerns remain. High input costs continue to limit expectations for better farm financial performance, while crop and livestock prices were identified as the leading long-term challenge. Most producers expect cash rents to remain relatively stable in 2027, though more respondents anticipate increases than declines. Producers also remained moderately optimistic about agricultural trade.
Overall, the July results point to improved near-term sentiment, but producers remain concerned about costs, commodity prices, and longer-term profitability.