


Ag Economy Barometer Declines, Producers Concerned About Rising Costs and Supply Chain Disruptions
James Mintert and Michael Langemeier, Purdue Center for Commercial Agriculture
A breakdown on the Purdue/CME Group Ag Economy Barometer January results can be viewed at https://purdue.ag/barometervideo. Find the audio podcast discussion for insight on this month’s sentiment at https://purdue.ag/agcast.
Download report (pdf)
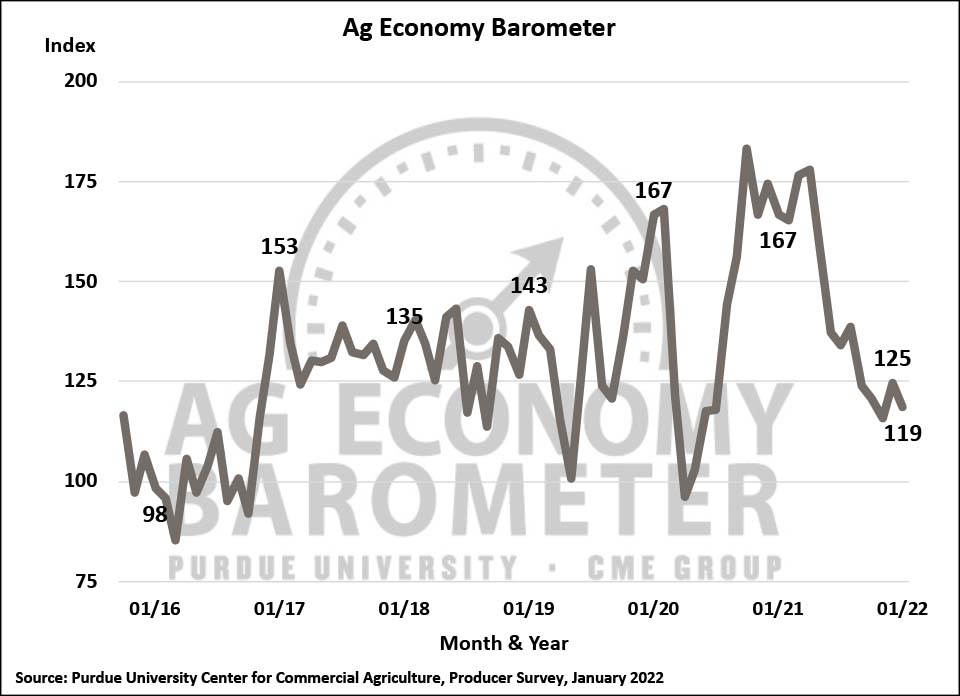
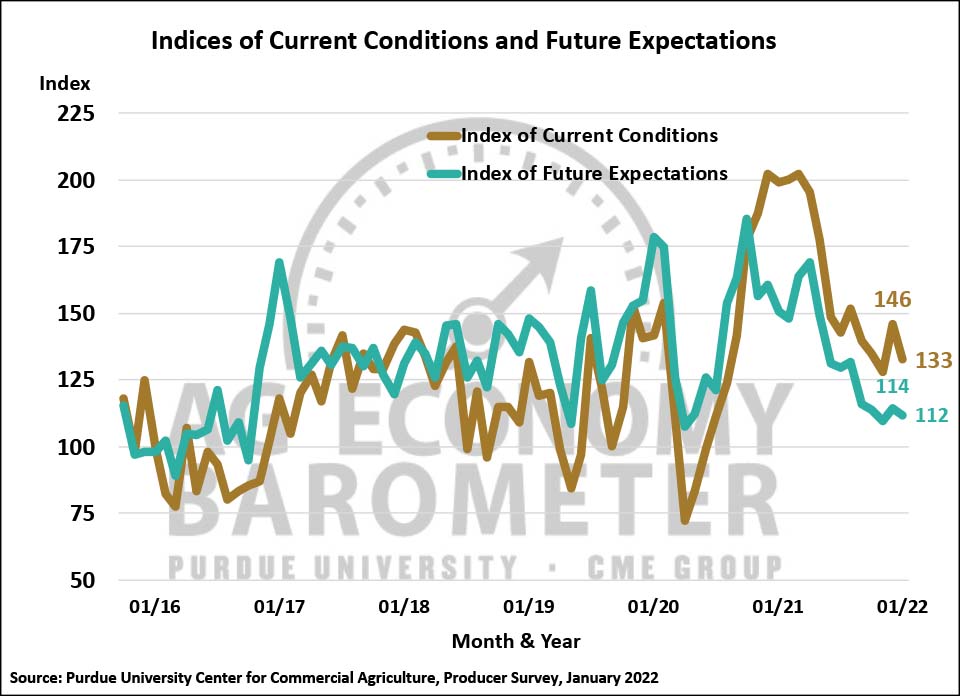
Farmer sentiment weakened in January as the Purdue University/CME Group Ag Economy Barometer declined 6 points to 119, down from 125 a month earlier. This month’s decline leaves the barometer just three points higher than in November and is the second-lowest sentiment reading since July 2020. This month’s sentiment decline was driven primarily by weaker perceptions regarding the current situation as the Index of Current Conditions fell 13 points from a month earlier to 133. Concerns about rising input costs and ongoing supply chain disruptions contributed to weakness in the current conditions index. The Index of Future Expectations changed little this month, falling just two points from a month earlier to 112. However, future expectations index values have been weak dating back to September as the index ranged from a low of 110 to a high of 116 from September 2021 through January 2022. This contrasts with future expectations readings from January through August 2021 that averaged 147. The Purdue University-CME Group Ag Economy Barometer sentiment index is calculated each month from 400 U.S. agricultural producers’ responses to a telephone survey. This month’s survey was conducted from January 17-21, 2022.
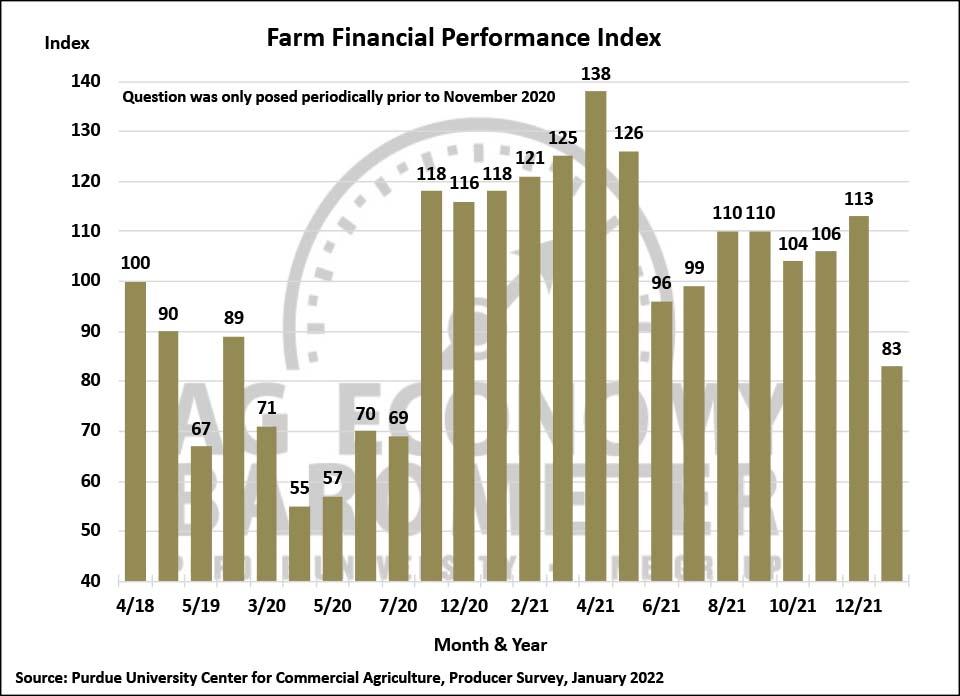
The Farm Financial Performance Index fell sharply this month to just 83, a 30% decline compared to a year earlier and 27% lower than in December 2021. The financial index is generated based upon responses to the following question, “As of today, do you expect your farm’s financial performance in 2022 to be better than, worse than, or about the same as 2021?”. To help make the comparison clear, the question asks about the current year (in this case 2022) vs. the prior year (in this case, 2021). In December this question asked respondents to compare 2021 to 2020. The shift in the comparison likely explains much of the sharp month-to-month drop in the index. In particular, the index’s decline makes clear that producers expect financial performance in 2022 to be much weaker than in 2021.
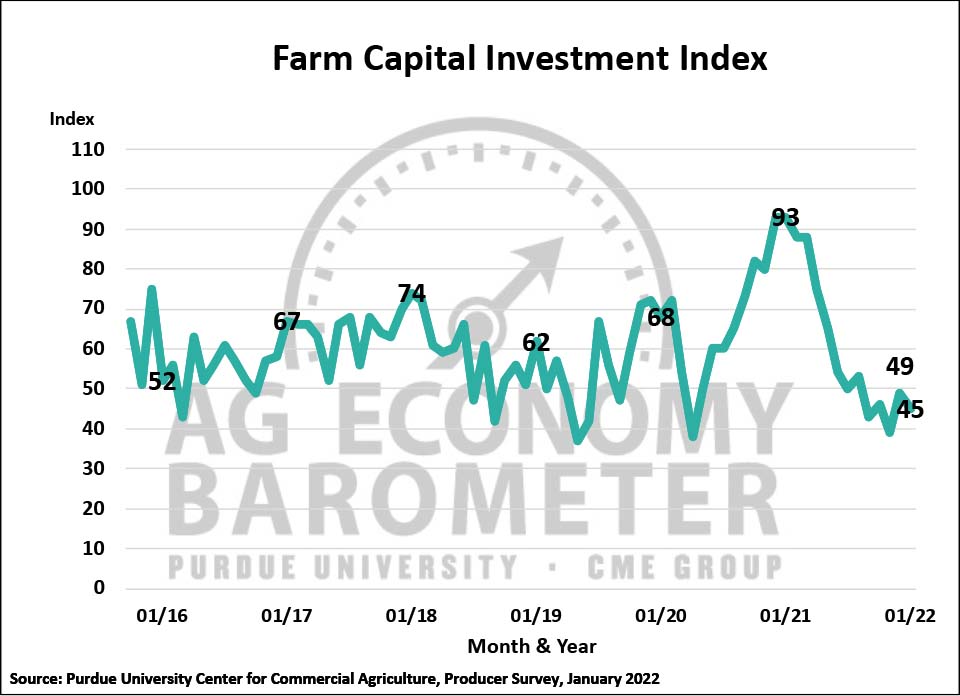
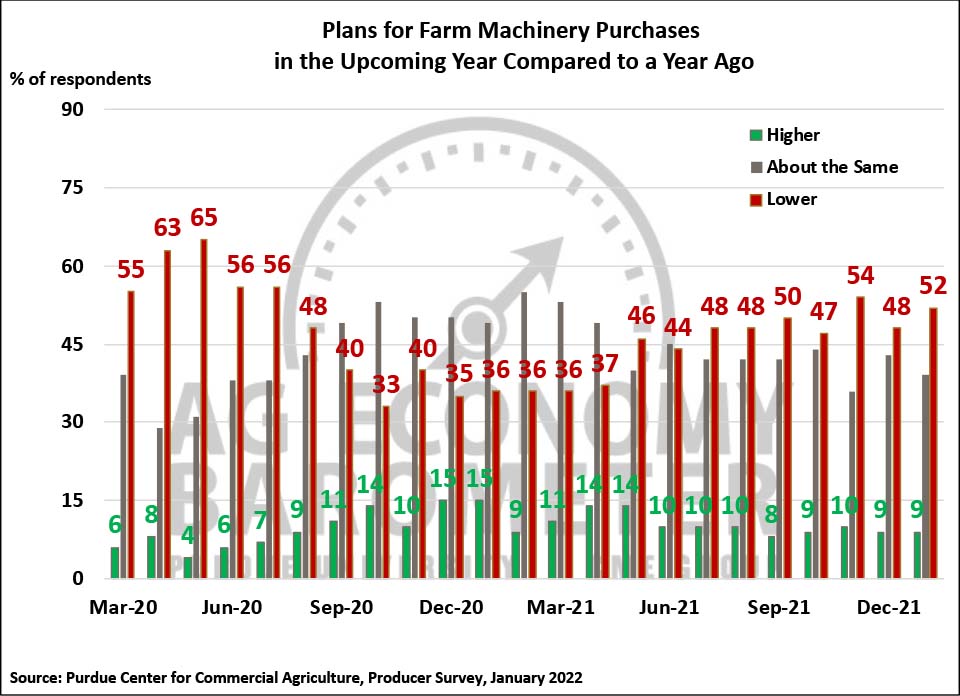
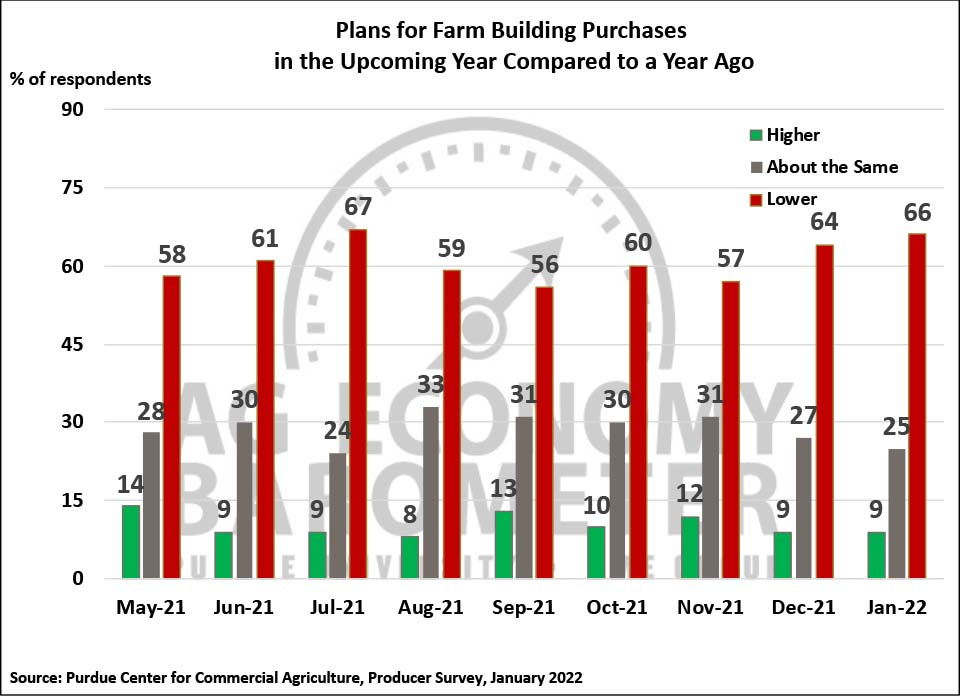
The Farm Capital Investment Index weakened slightly this month, falling 4 points to a reading of 45. The investment index has been range-bound, fluctuating between 39 and 49, since September 2021. Fifty-two percent of respondents in January said they plan to reduce their farm machinery purchases in the upcoming year, up from 48% last month. Supply chain issues continue to hamper farmers’ investment plans as, for the third month in a row, over 40% of producers reported that low farm machinery inventories were holding back their purchase plans. Farm construction plans were also weaker this month as 66% of respondents reported reducing their construction plans in the year ahead vs. last year, up from 64% who reported weaker construction plans a month ago.
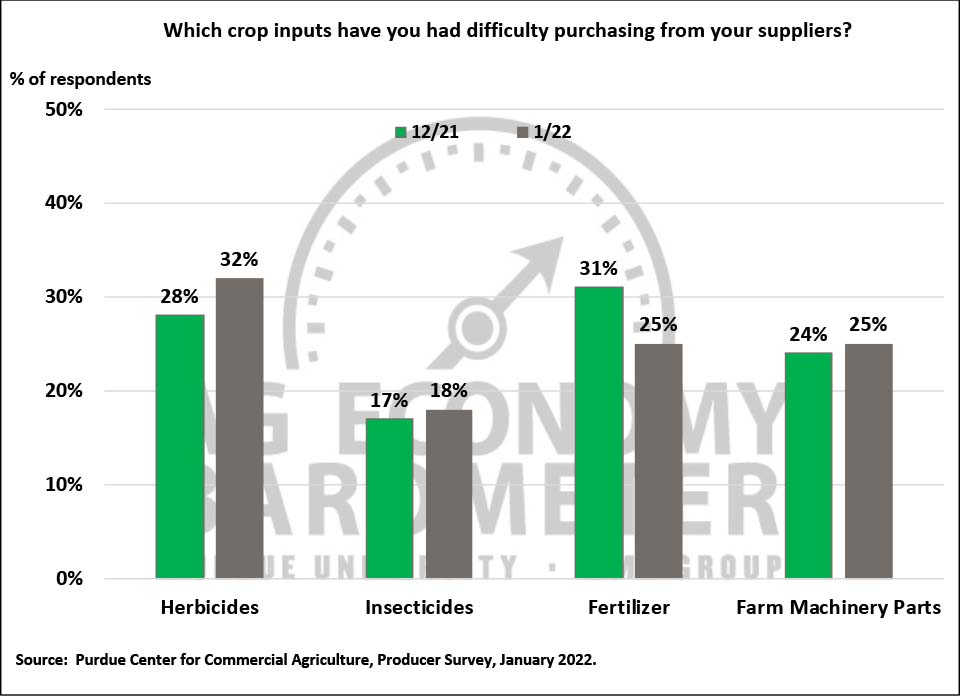
Supply chain concerns extend beyond farm machinery and farm building/grain bin construction plans. Disruptions in the supply chain for many farm inputs, coupled with strong demand, are pushing production costs higher. Fifty-seven percent of survey respondents in January said they expect farm input prices to rise by 20% or more in 2022 and 34% of producers in this month’s survey said they expect prices to rise by 30% or more. The disruptions extend not just to input pricing, but also input availability. In January 28% of producers responding to the survey said they have had difficulty purchasing crop inputs from suppliers for the 2022 crop season. In a follow-up question posed to producers experiencing difficulty in procuring crop inputs, respondents reported difficulty in purchasing a broad spectrum of crop inputs including herbicides, insecticides, fertilizer, and farm machinery parts.
Prices for nitrogen fertilizer have skyrocketed over the last year. According to USDA, anhydrous ammonia (NH3) prices in Illinois during January 2022 were nearly triple what they were in January 2021. To learn more about how producers are responding to the sharp rise in input prices, this month’s survey included a question posed to corn producers about their nitrogen application rates. Although a majority (57%) of corn producers said they intend to use the same nitrogen application rate in 2022 as in 2021, nearly four out of ten corn farmers (37%) said they intend to reduce their nitrogen application rate compared to last year.
Each January the barometer survey includes a question asking producers if they expect their farm’s operating loan to be smaller, about the same, or larger than last year. Twenty-seven percent of respondents said they expect to have a larger operating loan in 2022 than a year earlier which was 10 points higher than on last year’s survey and 12 points higher than two years ago. In a follow-up question, respondents expecting to have a larger operating loan were asked why they expected a larger operation loan. Nearly seven out of ten (69%) respondents said it was because of an increase in input costs, up from 65% last year and just 45% two years ago who said increases in input costs were the main reason.
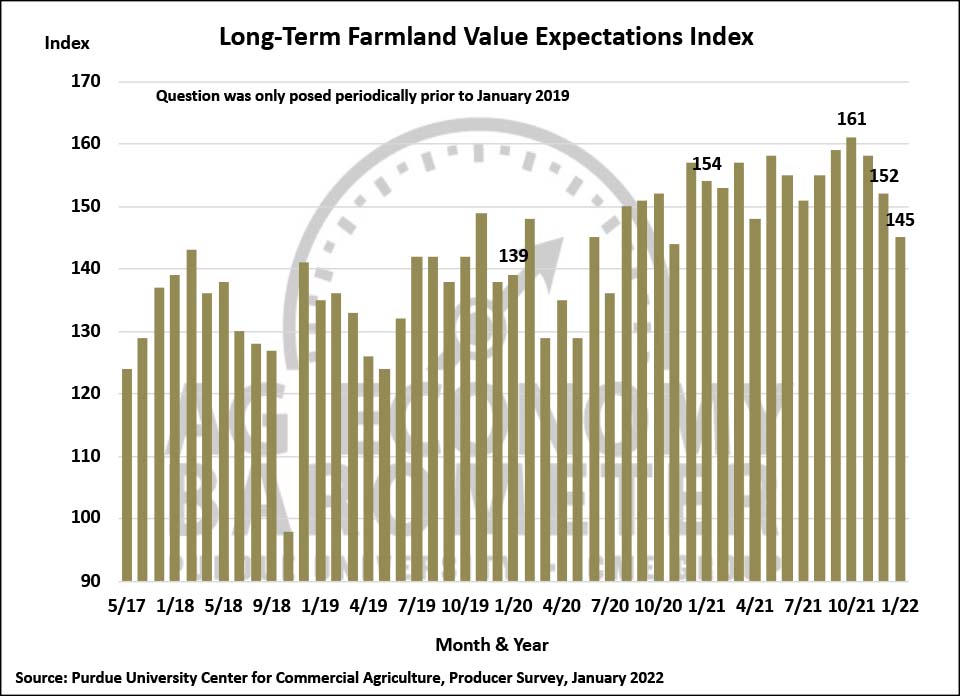
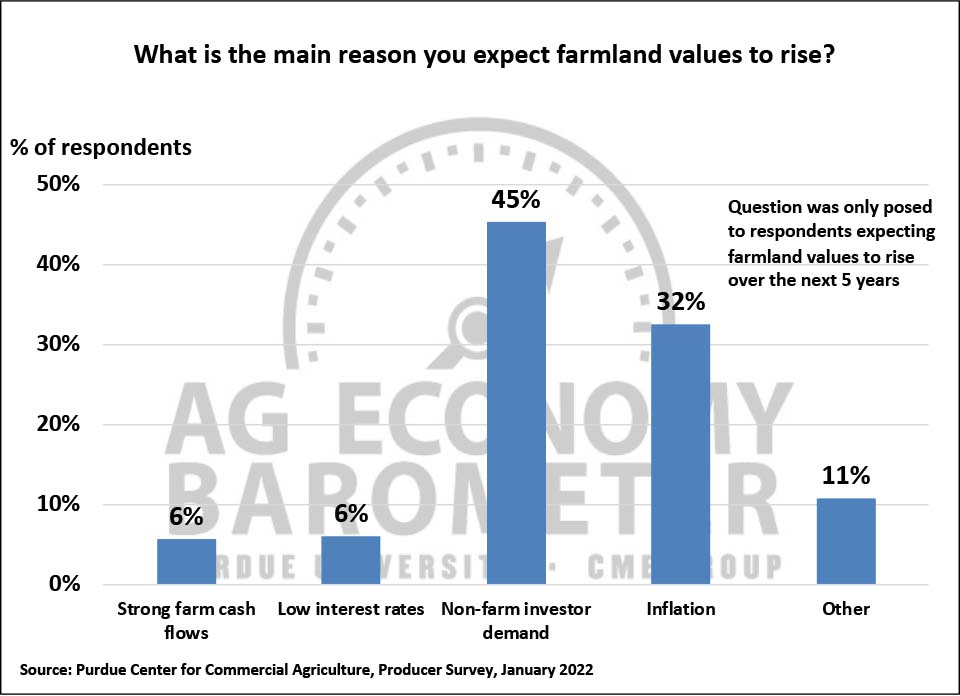
For the second month in a row, both the short-term and long-term farmland value indices declined. The Short-Term Farmland Value Index declined 11 points compared to December resulting in an index value of 142 while the Long-Term Farmland Value Index declined 7 points to a reading of 145 in January. Both indices have fallen about 10% compared to their fall 2021 peak values. Recent weakness in both indices could reflect recognition of how much farmland values have increased over the last year or more, tempering expectations for further price increases. A follow-up question regarding the main reason farmland values are likely to rise was posed to respondents who said they expect farmland values to rise over the next 5 years. The most common response, chosen by 45% of producers who expect values to rise, was “non-farm investor demand” followed by “inflation” (32%), “strong farm cash flows” (6%), and “low interest rates” (6%) while 11% of respondents chose “other” as their main reason for prices to rise.
Wrapping Up
The Ag Economy Barometer declined 6 points in January in large part because of weakening perceptions of current conditions by producers. Rising farm input costs and ongoing supply chain disruptions appear to be contributing to producers’ weaker perception of current conditions. More producers expect the size of their operating loan to increase this year than last year or two years ago with the rise in farm input costs being the most commonly chosen reason for a larger operating loan. Weakness in the Farm Financial Performance Index indicates producers expect lower farm incomes in 2022 compared to 2021 as producers look for higher production costs to offset commodity price strength. Farmers in January also expressed less confidence that farmland values will continue to rise over both the short-run and longer-run time frames as both farmland values indices have fallen about 10% from their respective fall 2021 peak levels.