


Ag Economy Barometer falls for second month; rising input costs causing concern for farmers
James Mintert and Michael Langemeier, Purdue Center for Commercial Agriculture
A breakdown on the Purdue/CME Group Ag Economy Barometer June results can be viewed at https://purdue.ag/barometervideo. Find the audio podcast discussion for insight on this month’s sentiment at https://purdue.ag/agcast.
Download report (pdf)
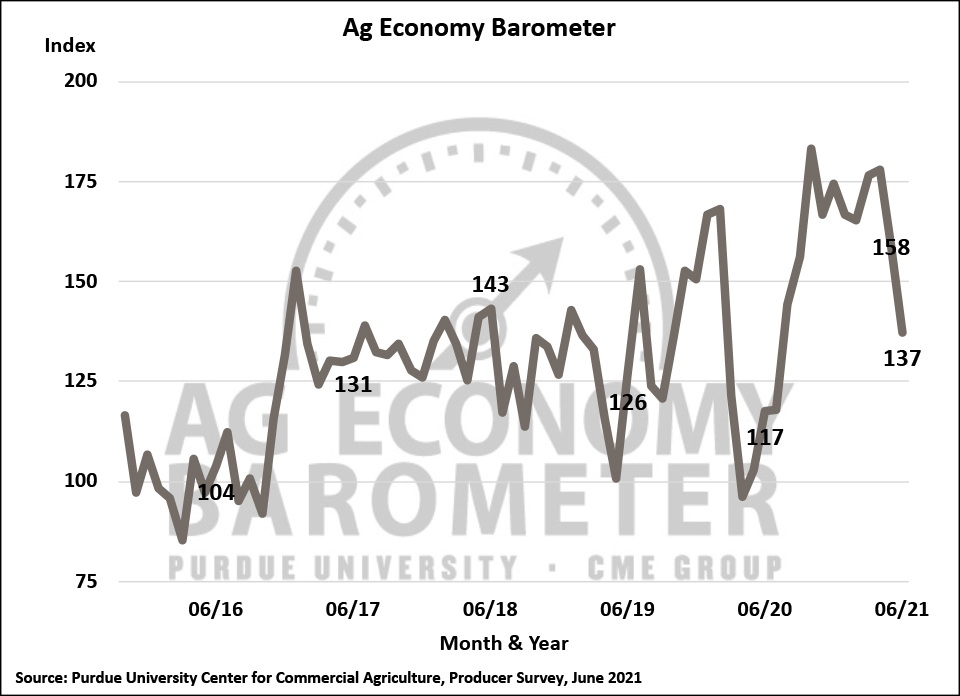
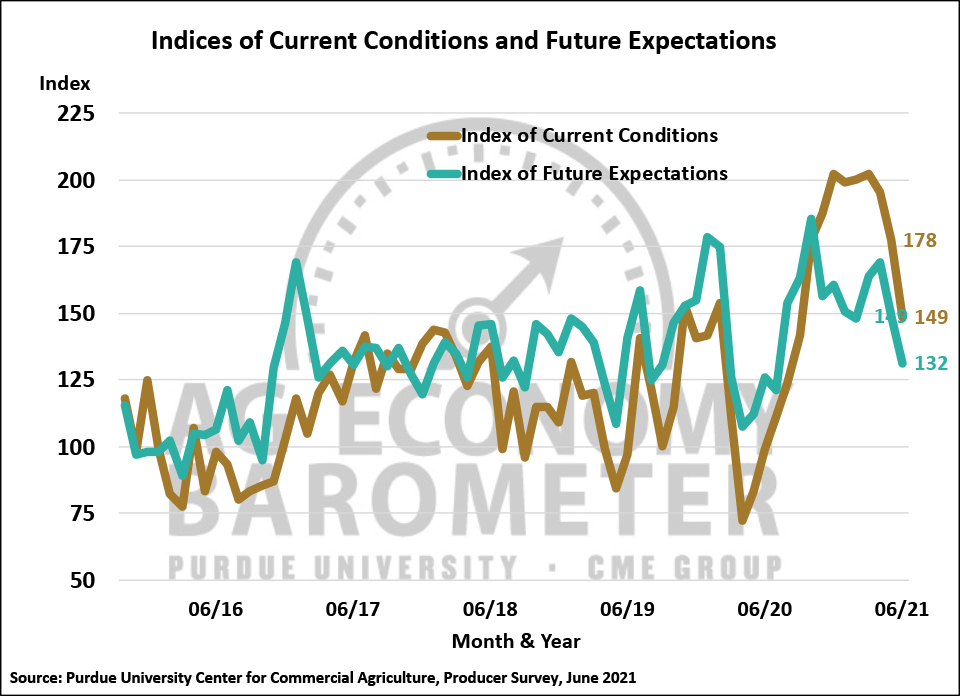
For the second month in a row, the Ag Economy Barometer declined sharply, falling to a reading of 137, which was 21 points below a month earlier, and the weakest ag producer sentiment reading since July 2020. Producers in June were less optimistic about both current conditions on their farming operations as well as their expectations for the future. Weakening perceptions of current conditions on their farms was the biggest driver of the barometer’s decline as the Index of Current Conditions declined 29 points to 149, the lowest Current Conditions Index reading since September 2020. Producers were also less optimistic about the future as the Index of Future Expectations declined 17 points to 132, the lowest Future Expectations Index reading since July 2020. The Purdue University-CME Group Ag Economy Barometer sentiment index is calculated each month from 400 U.S. agricultural producers’ responses to a telephone survey. This month’s survey was conducted from June 21-25, 2021.
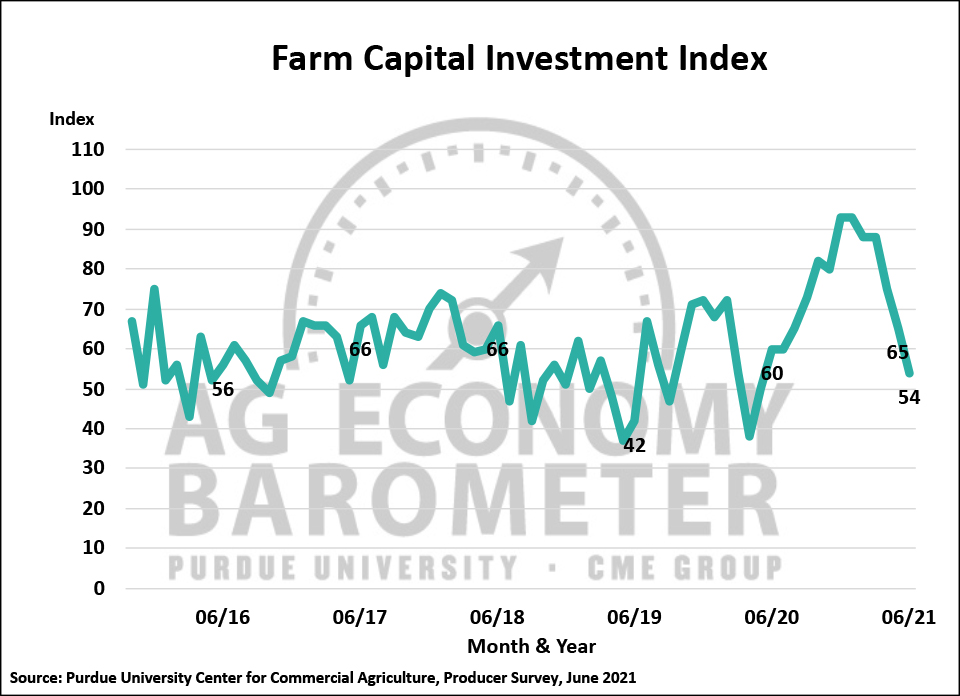
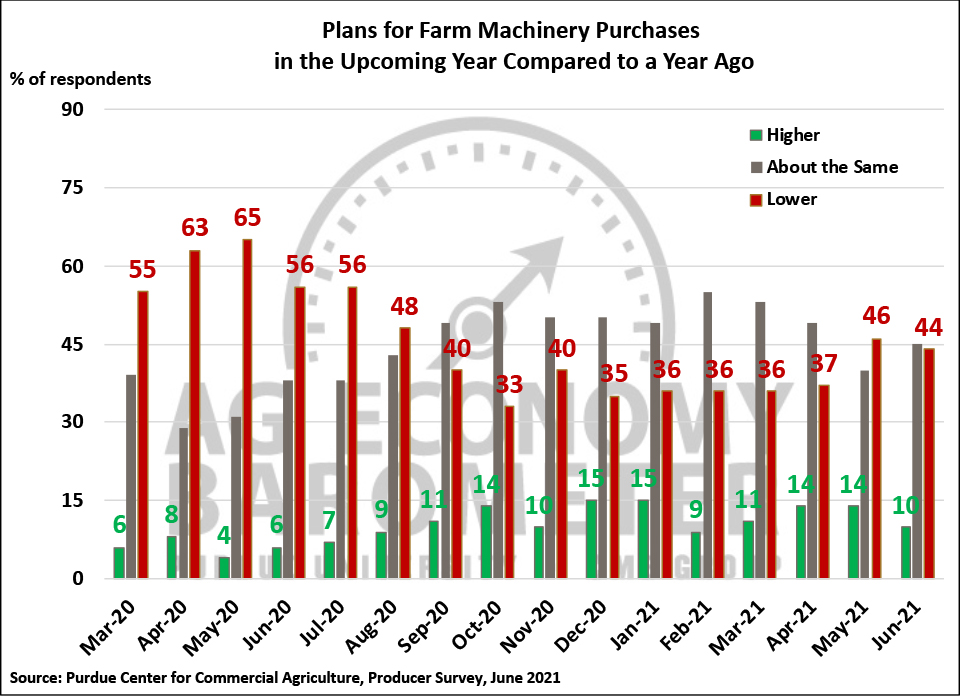
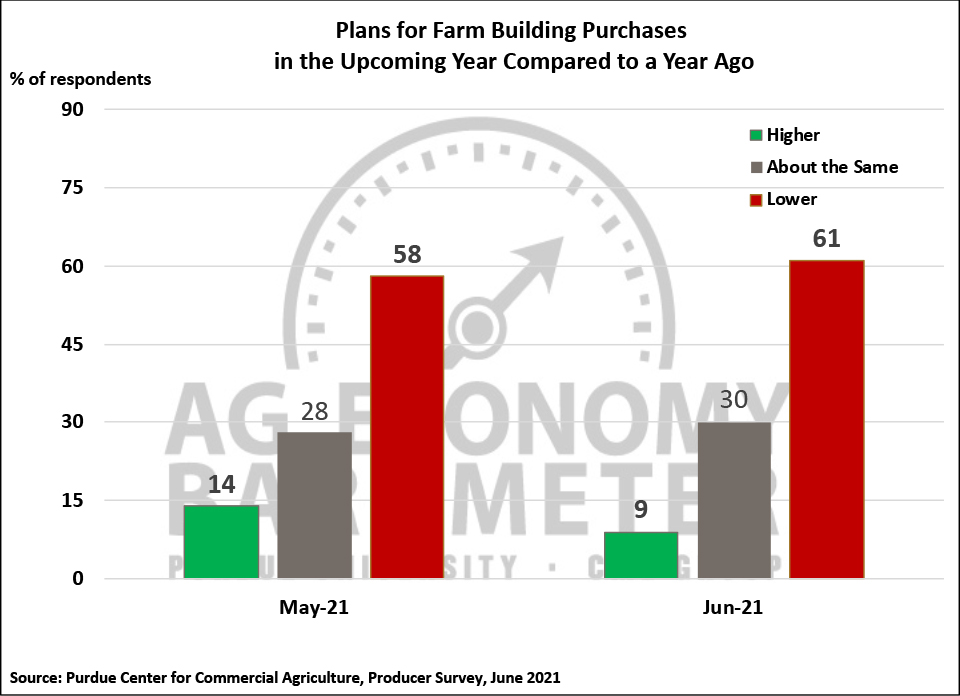
Since peaking in April, producers’ perception of their farms’ financial performance has fallen sharply. This month’s Farm Financial Performance Index, which is based on a question that asks producers about expectations for their farm’s financial performance this year compared to last year, declined 30 points (24%) from a month earlier to a reading of 96. This was the index’s weakest reading since last July. Weakening perceptions of farm financial performance spilled over into the Farm Capital Investment Index which declined 11 points to a reading of 54, the lowest investment index reading since May 2020. Weakness in the investment index appears to be driven more by plans to hold back on constructing new farm buildings and grain bins than farm machinery. The percentage of producers who said they’ve reduced plans for new construction rose to 61% from 58% in May and the percentage planning to increase new construction fell to just 9% vs. 14% a month earlier. This contrasts with results from a similar question regarding farm machinery purchases. The percentage of producers who plan to reduce their machinery purchases fell just 2 points to 44% while those planning to hold purchases constant rose to 45% from 40% with the percentage planning to increase purchases falling to 10% vs. 14% back in May.
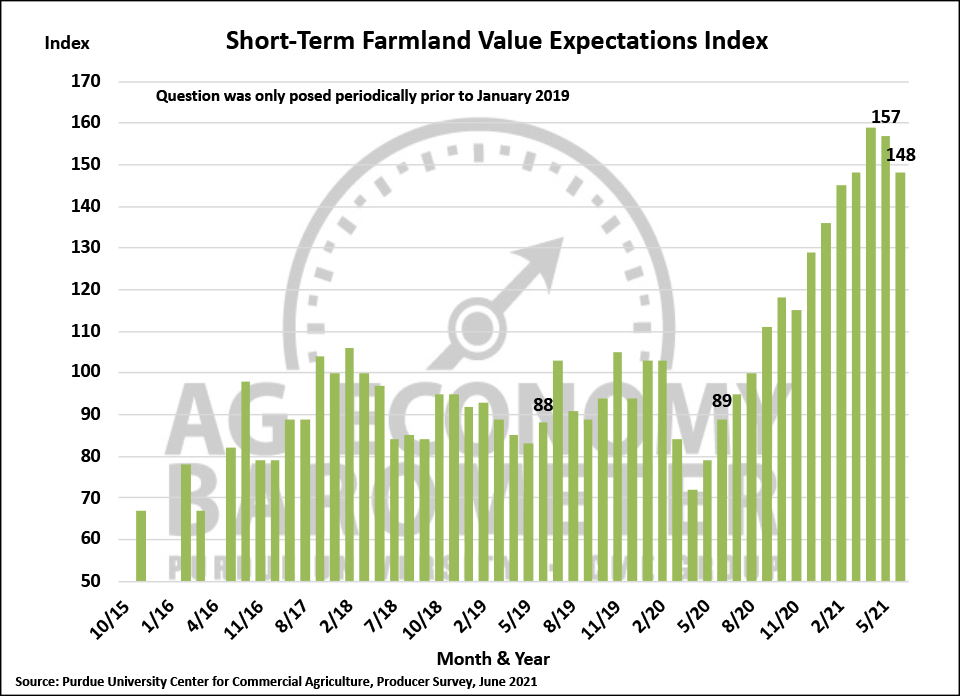
Despite weakening perceptions about their farms’ financial performance, producers remain relatively bullish on farmland values. The Short-Term Farmland Value Expectations Index, based upon producers’ 12-month expectation for farmland values, declined 9 points to a reading of 148, but that reading matches the third-highest reading for the index since data collection began in 2015. The Long-Term Farmland Value Expectations Index, based upon producers’ five-year outlook, declined just 3 points to a reading of 155, which was also the third-highest reading on record for that index.
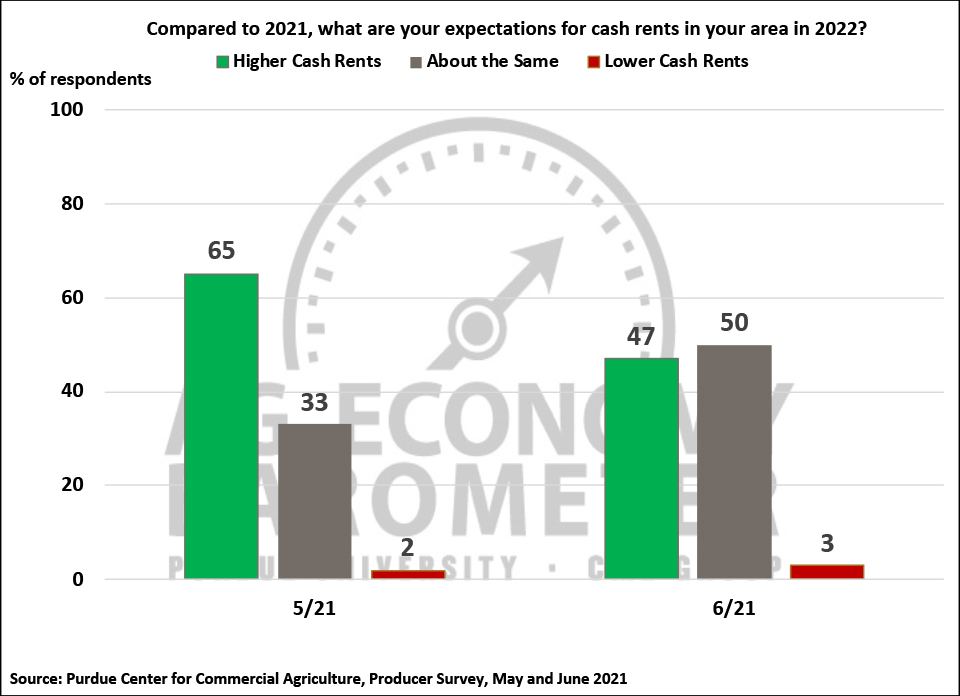
For the second month in a row, producers who grow corn or soybeans were asked about their expectations for cash rental rates in 2022. In contrast to May, when nearly two-thirds of producers said they expected rates to rise in 2022 compared to 2021, less than half (47%) of corn-soybean producers said they expect rental rates to rise. However, those producers who expect rates to increase think they will rise significantly. Nearly half of those expecting higher rates said they look for cash rental rates to rise from 5 to less than 10% with nearly one-third of them expecting rates to rise by 10% or more.
Rapidly rising production costs are a concern for ag producers. This month’s survey included questions regarding both consumer and farm input price inflation. Nearly one out of three (30%) producers said they expect farm input prices to rise by 8% or more in the upcoming year, which would be more than four times the average rise over the last 10 years of just 1.8%. On the other hand, just one fifth (21%) of producers expect prices paid for inputs to increase less than 2%. Interestingly, producers expect farm input costs to rise more rapidly than prices for consumer items. For example, less than one out of five (17%) respondents said they expect consumer prices to rise by 8% or more over the next year.
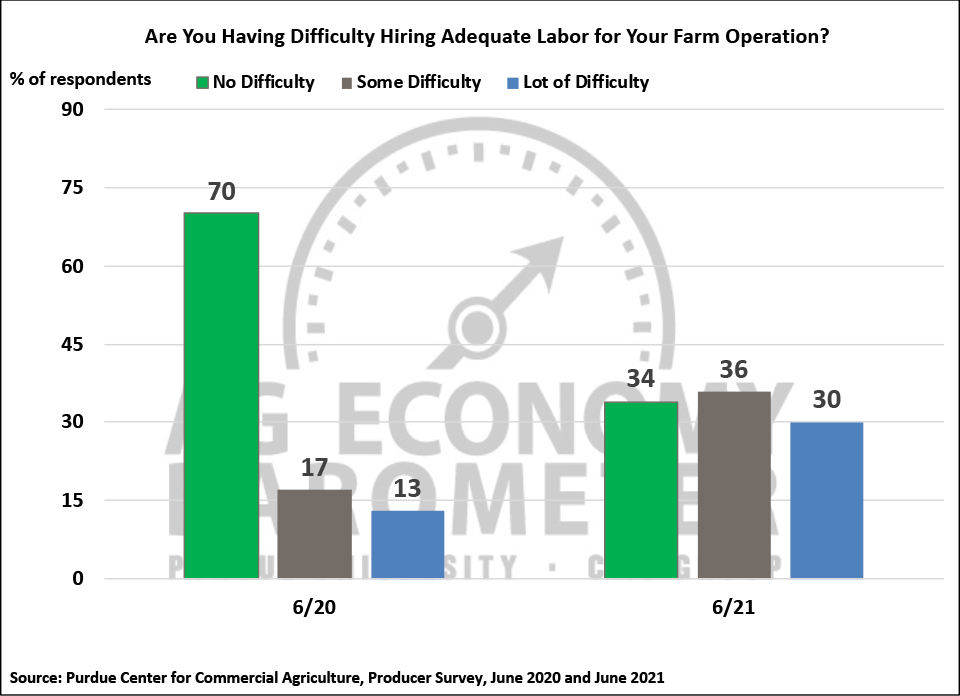
Labor shortages across the U.S. economy have been widely reported in 2021. This month’s survey asked producers who normally hire non-family members to work on their farm if they are having difficulty hiring adequate labor this year. This same question was also included in the June 2020 survey. Just over half (54% in 2020, 51% in 2021) of farms in our survey reported hiring non-family members. Respondents reported much more difficulty in hiring adequate labor this year than in 2020. For example, in 2021 nearly two-thirds (66%) of respondents said they either had “some” or “a lot of difficulty” in hiring adequate labor compared to just three out of ten respondents in 2020.
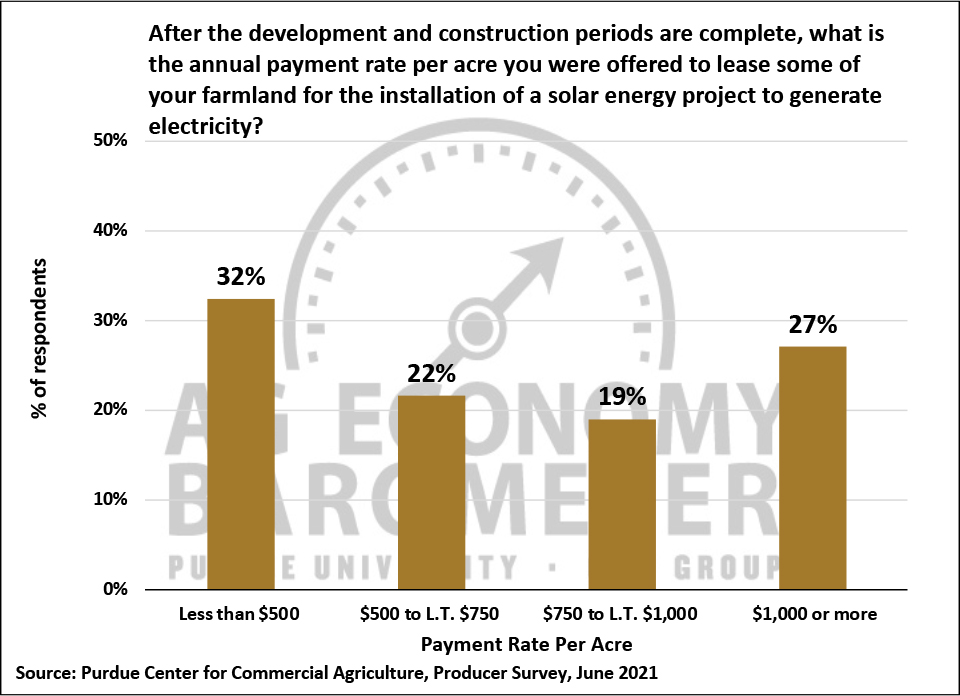
Interest in leasing farmland for solar energy projects has risen sharply over the last couple of years. This month’s survey included a series of questions designed to learn more about solar leasing. Nearly one-third (32%) of farms in the June survey said they are aware of solar leasing opportunities for their farmland. In a follow-up question posed to respondents indicating awareness of leasing opportunities, 29% of them said they had engaged in discussions with companies about leasing some of their farmland. Respondents who reported having discussions with leasing companies were asked what lease rates were offered following completion of the development and construction phases. Rates offered by leasing companies varied widely. Approximately one out of three (32%) respondents reported being offered rates of less than $500 per acre while, at the other extreme, over one out of four respondents (27%) reported being offered rates of $1,000 or more per acre. Finally, a bit less than 3% (2.6%) of all survey respondents reported having signed a solar lease on some of their farmland. For perspective, this is approximately double the percentage of producers who reported having signed a carbon sequestration contract on barometer surveys this past winter and spring.
Wrapping Up
The Ag Economy Barometer declined sharply for the second month in a row as producers’ perception of current conditions and future expectations for their farming operations declined. In June, farmers became noticeably more concerned that their farms’ financial performance will be weaker than a year earlier as the Farm Financial Performance Index fell 24% in just one month. Farmers expect their input costs to rise much more rapidly in the year ahead than they have over the last decade contributing to their concerns about their farm finances. Among corn and soybean producers nearly one-half expect to see farmland cash rental rates rise over the next year and among those who expect rates to rise, there is an expectation that rates will rise sharply. Farms that normally hire non-family labor reported more difficulty in hiring labor this year than in 2020 which also contributed to some producers’ anxiety. Finally, approximately 9% of all the farms in our survey reported that they have engaged in discussions with a company about leasing some of their farmland for a solar energy project while slightly less than 3% of all farms in the June survey said they have signed a solar lease for some of their farmland.