


Ag Economy Barometer Plummets in April
Jim Mintert gives his breakdown on the Purdue/CME Group Ag Economy Barometer April results at purdue.ag/barometervideo.
Download report (pdf)
James Mintert and Michael Langemeier
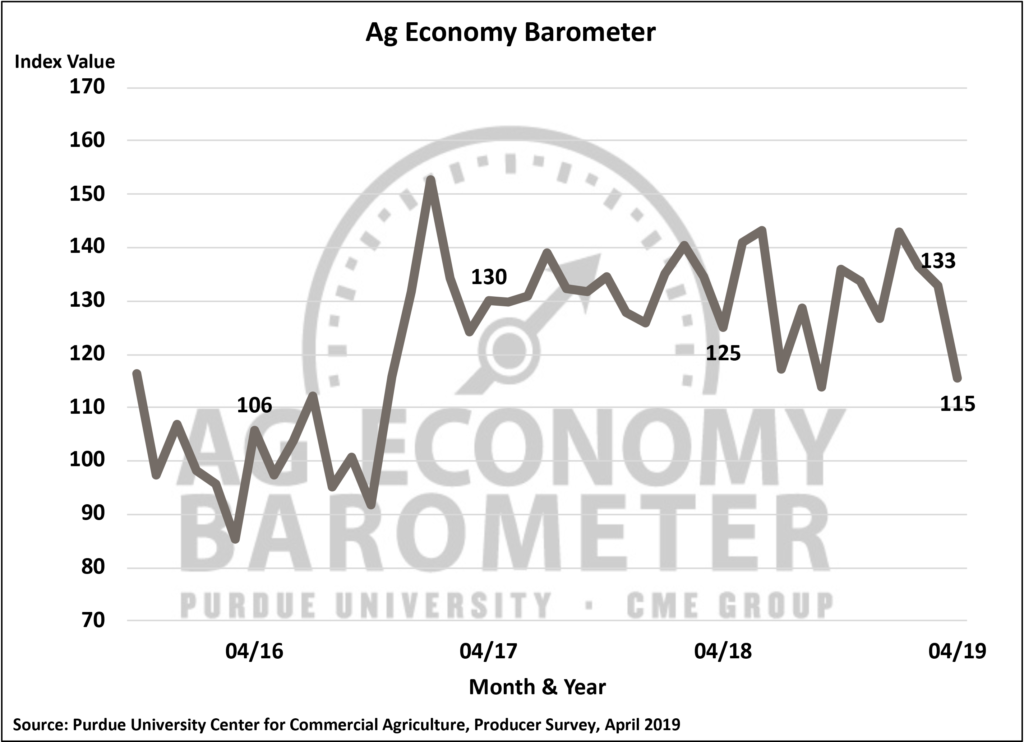
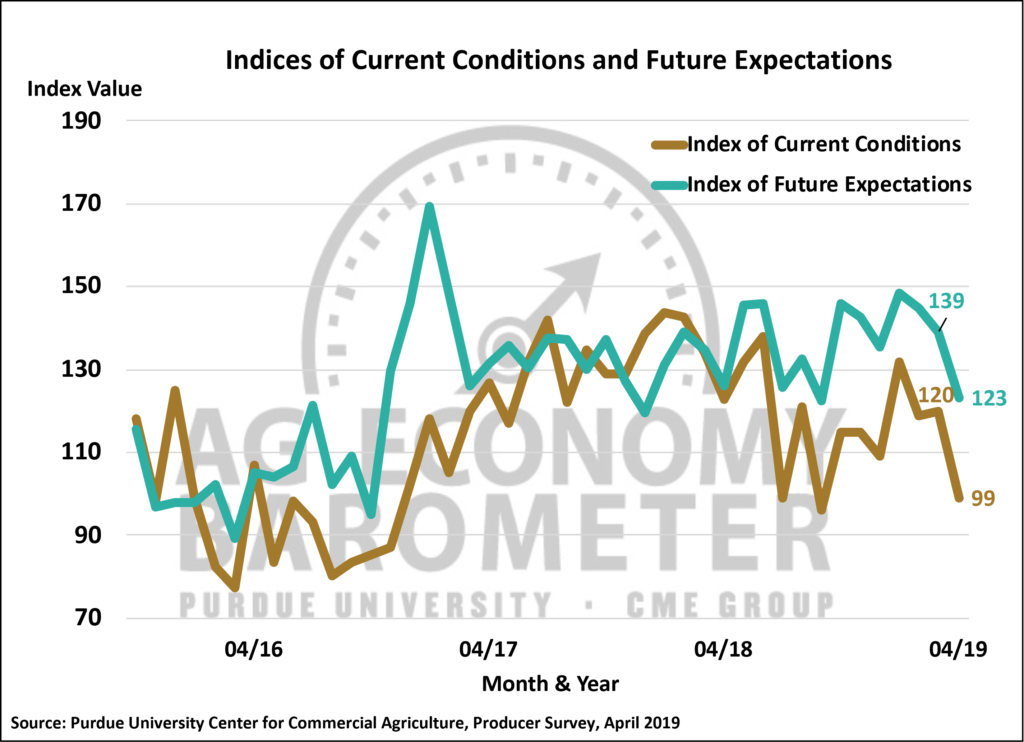
The Ag Economy Barometer plummeted in April, declining to a reading of 115, an 18-point decline compared to March when the sentiment index stood at 133. The 18-point decline in the index was the fourth largest one-month fall in the barometer since data collection began in October 2015. The barometer’s decline was driven by worsening perceptions of both current economic conditions and weaker expectations for the future as the Index of Current Conditions fell 21 points to a reading of 99 while the Index of Future Expectations declined 16 points to a reading of 123.
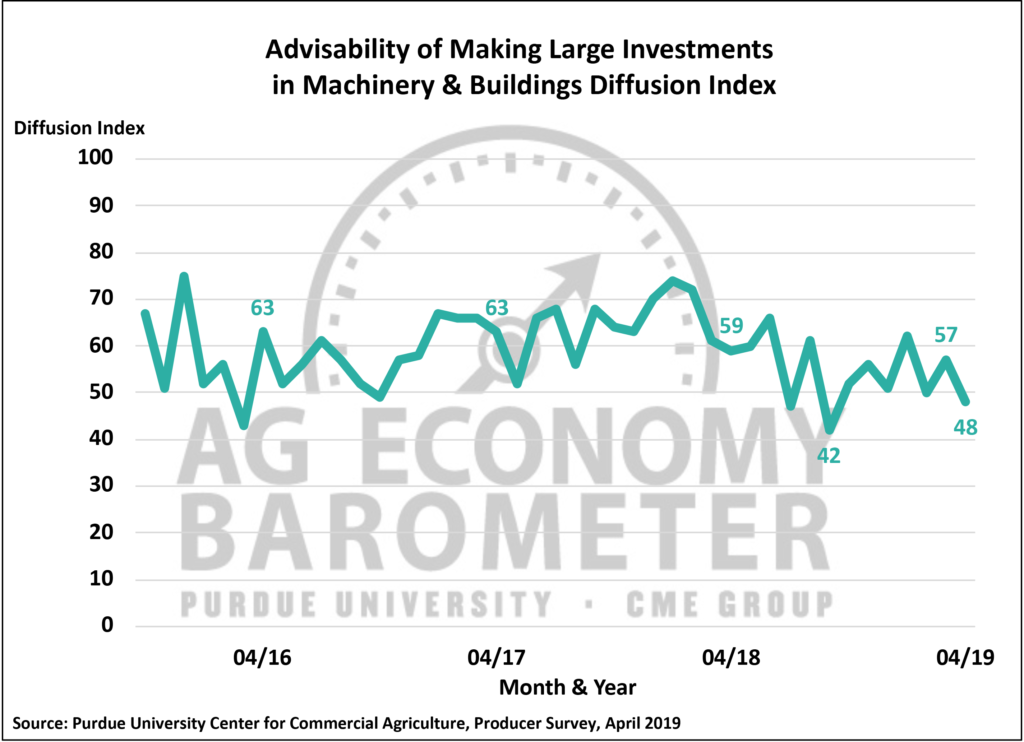
Producers’ negative sentiment was further borne out by their perspective on making large investments in their farming operations. The percentage of producers that viewed now as a good time to make large investments declined to 22 percent from 26 percent a month earlier, while the percentage that viewed now as a bad time to make large investments increased to 74 percent from 69 percent in March. When combined these responses pushed the Large Farm Investment Index to a reading of 48 in April, 9 points lower than in March and the fourth weakest reading of the investment index since fall 2015.
Farmers’ expectations for farmland prices in the upcoming 12-months also weakened in April as the percentage expecting higher values fell to 13 percent from 14 percent while the percentage expecting lower values increased to 28 percent from 25 percent. The largest response category, those expecting farmland values to remain about the same, fell to 59 percent from 61 percent. Although the one-month change in farmers’ perspective on farmland values was more modest than the decline in the investment index, it still stands in sharp contrast to the perception producers had of farmland values a year earlier. In April 2018, 18 percent of producers expected higher farmland values, while 64 percent expected values to remain about the same, and 18 percent expected values to decline, a notably more optimistic outlook than recorded in April 2019.
To gauge producers’ expectations for 2019, this month’s survey asked whether respondents expect their farms’ 2019 financial performance to be better than, worse than, or about the same as in 2018? Over half (56 percent) of farmers in the April survey said they expect their farms’ financial performance to be about the same as last year. However, 27 percent of farmers said they expect this year’s financial performance to be worse than last year. In comparison, when the same question was included in the April 2018 survey, just 19 percent of respondents expected worse financial performance for their farm than in the prior year.
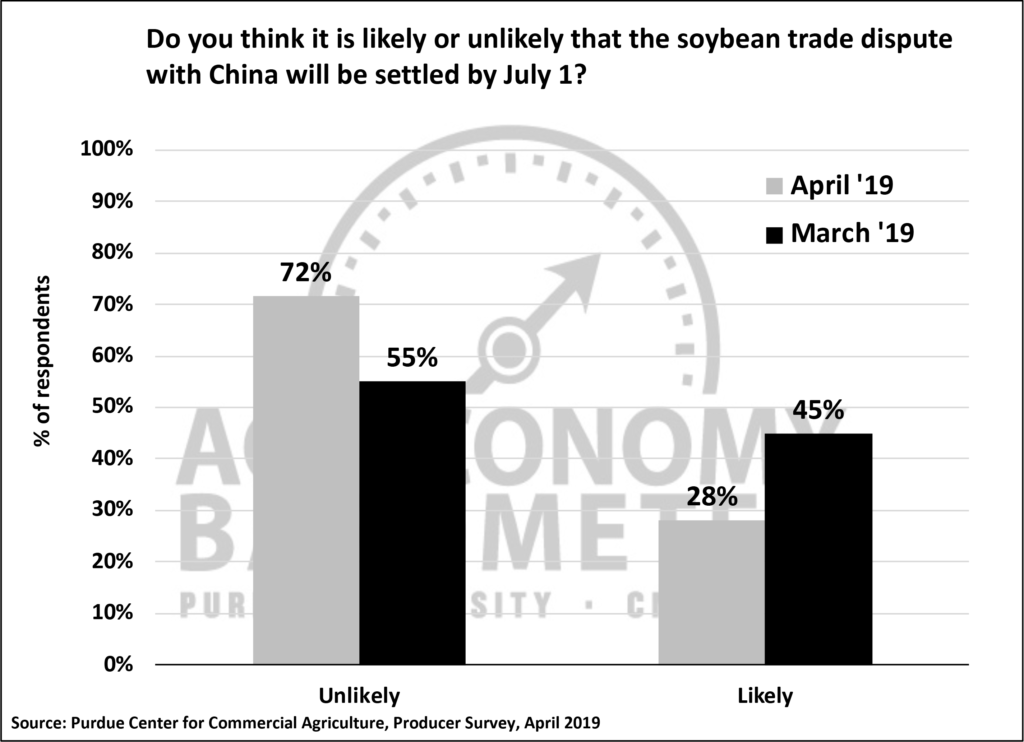
Producers’ confidence that the trade dispute with China will be resolved soon appeared to wane in April compared to March. In March, 45 percent of respondents said they thought it likely that the trade dispute with China will be settled by July 1, but on the April survey just 28 percent of respondents said they expect to see the trade dispute resolved that quickly. However, when asked whether or not they expect the trade dispute will ultimately be resolved in a way that benefits U.S. agriculture, producers retained most of the optimism they expressed previously as 71 percent still expect a favorable resolution versus 77 percent on the March survey.
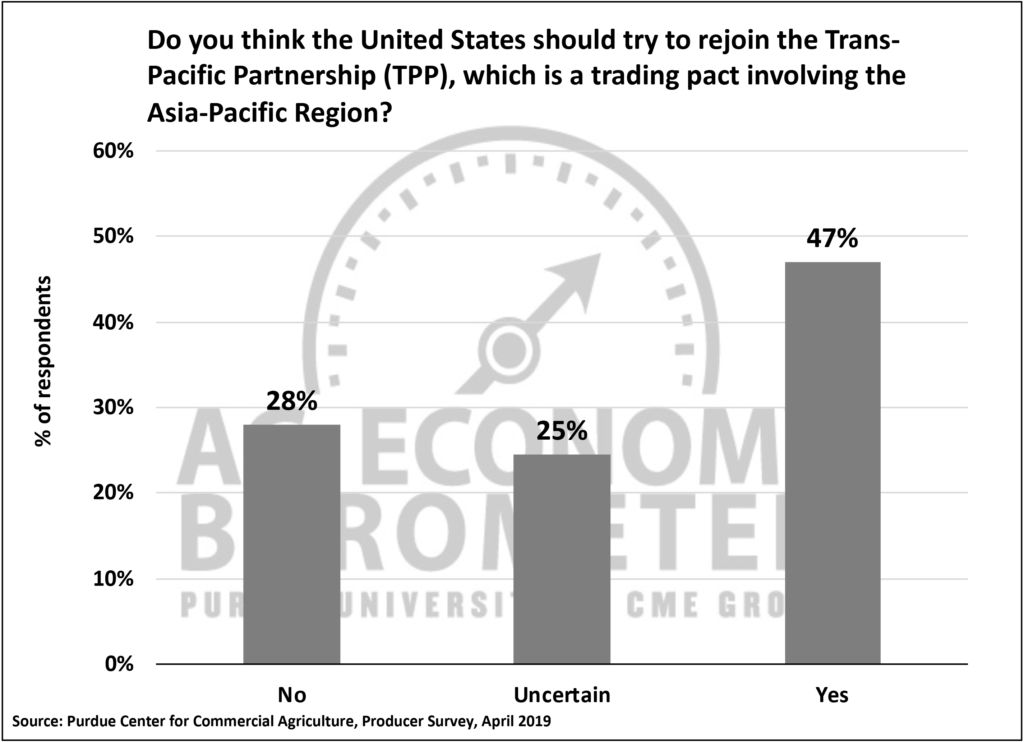
To learn more about producers’ perspective on trade, the April survey also asked respondents if they think the U.S. should try to rejoin the Trans-Pacific Partnership (TPP). Just less than half (47 percent) of respondents favored rejoining TPP, while 29 percent said they were not in favor of rejoining the TPP. Interestingly, one-fourth of respondents said they were uncertain whether or not the U.S. should rejoin TPP.
Responses to the open-ended comments question at the end of each month’s survey provide interesting insights into what’s on producers’ minds. Since January there has been a shift among survey respondents with more producers indicating they have concerns about commodity prices. To gain additional insight into producers’ expectations for corn and soybean prices, we have been using the University of Illinois’ 2019 iFarm Price Distribution Tool to learn how producers’ price expectations compare with the expected distribution of prices implied by current new crop futures prices and option premiums. Specifically, the tool provides market-based probability estimates of prices falling below specified price levels. In recent months, we have chosen two price points from the tool that match up with 1) a 75 percent probability that prices at contract expiration will fall below that level, and 2) a 25 percent probability that prices will fall below that level. We then ask producers if they think prices are likely to exceed the 75 percent level (e.g., exceed a relatively high price) or fall below the 25 percent probability level (e.g., fall below a relatively low price) to gauge how optimistic or pessimistic they are about corn and soybean prices.
Results over the first four months of 2019 suggest producers have consistently had a more negative commodity price outlook than participants in the commodity futures and options markets and their outlook appears to be getting more pessimistic. For example, in January 32 percent of respondents expected December corn futures prices to fall below the 25 percent probability level, but by April, 42 percent of respondents expected prices to fall below the 25 percent probability level. Producer expectations for soybean prices at the start of this year were already substantially more pessimistic than market derived expectations. In January, 43 percent of producers said they expected soybean prices to fall below the 25 percent probability level and this increased in April to 48 percent, substantially more negative than futures and options market participants perspective. Producers’ increasingly negative perception regarding the likelihood that corn and soybean prices will decline is one factor behind the decline in the barometer.
Wrapping Up
The Ag Economy Barometer declined sharply in April, falling 18 points below the March reading of the index. Weakening perceptions of both current economic conditions and expectations for the future drove the index lower. The waning sentiment regarding the ag economy also pushed the Large Farm Investment Index to its lowest reading since last September as producers were less inclined to think now is good time to invest in buildings and equipment. Producers’ expectations for farmland values in the upcoming year also softened, but this was more modest compared to their reservations regarding building and equipment purchases. Producers are less optimistic that the trade dispute with China will be resolved by July 1 than they were a month earlier, but remain optimistic that it will ultimately be resolved with terms favorable to U.S. agriculture. A large minority (47 percent) of U.S. producers favor the U.S. rejoining the Trans-Pacific Partnership to help boost U.S. agricultural trade. Finally, producers appear to have a more negative perspective on the future direction of corn and soybean futures than do futures market participants and they have become more pessimistic since the first of the year, helping to explain some of the decline in the barometer and its two key sub-indices, the Index of Current Conditions and the Index of Future Expectations.