


Ag Economy Barometer Stable, But Farmers Less Optimistic About Future
James Mintert and Michael Langemeier, Purdue Center for Commercial Agriculture
A breakdown on the Purdue/CME Group Ag Economy Barometer July results can be viewed at https://purdue.ag/barometervideo. Find the audio podcast discussion for insight on this month’s sentiment at https://purdue.ag/agcast.
Download report (pdf)
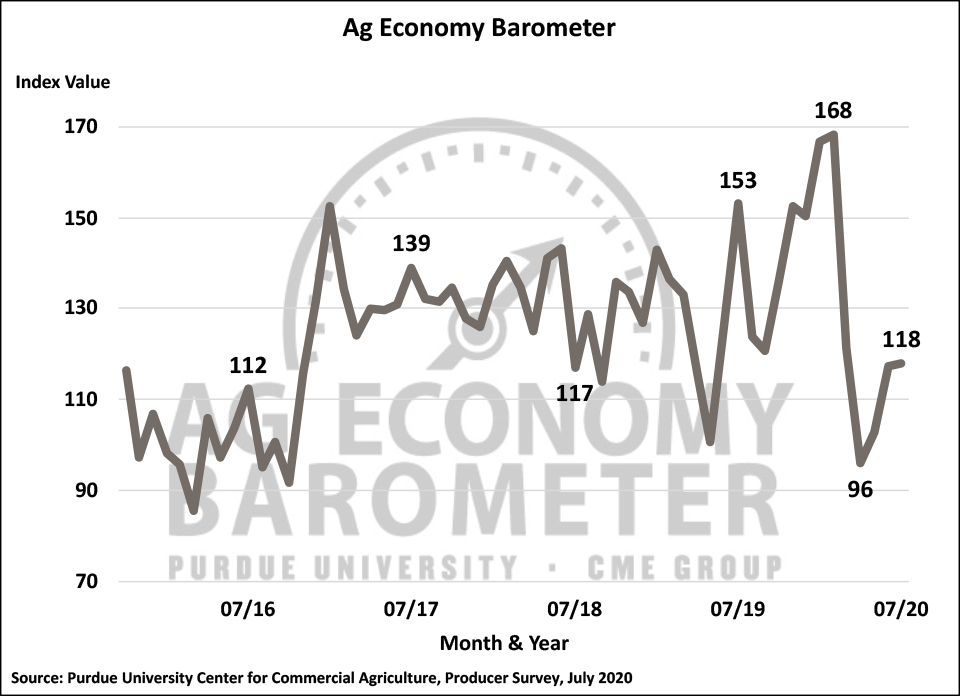
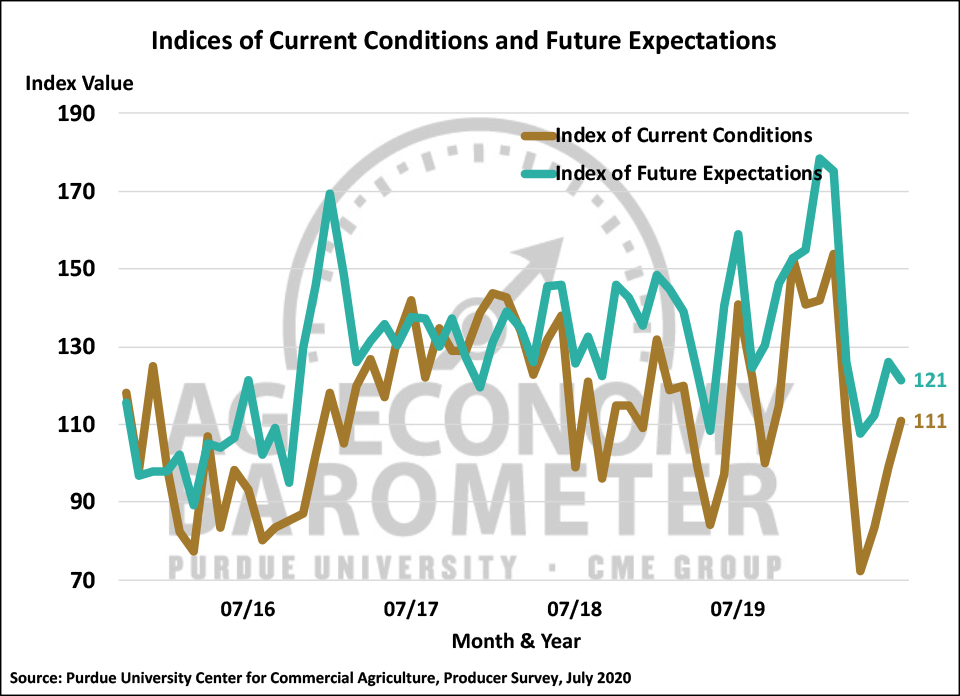
Farmer sentiment in July was virtually unchanged from a month earlier as the Purdue University-CME Group Ag Economy Barometer rose just one point to a reading of 118. The small change in the barometer left it 30 percent below its February 2020 peak and 23 percent below its level a year ago. Although there was little change in the barometer this month, there was a shift in producers’ perspective on current vs. future conditions as the Index of Current Conditions rose 12 points to 111 while the Index of Future Expectations fell to a reading of 121, five points lower than in June. The Ag Economy Barometer is calculated each month from 400 U.S. agricultural producers’ responses to a telephone survey. This month’s survey was conducted from July 20-24, 2020.
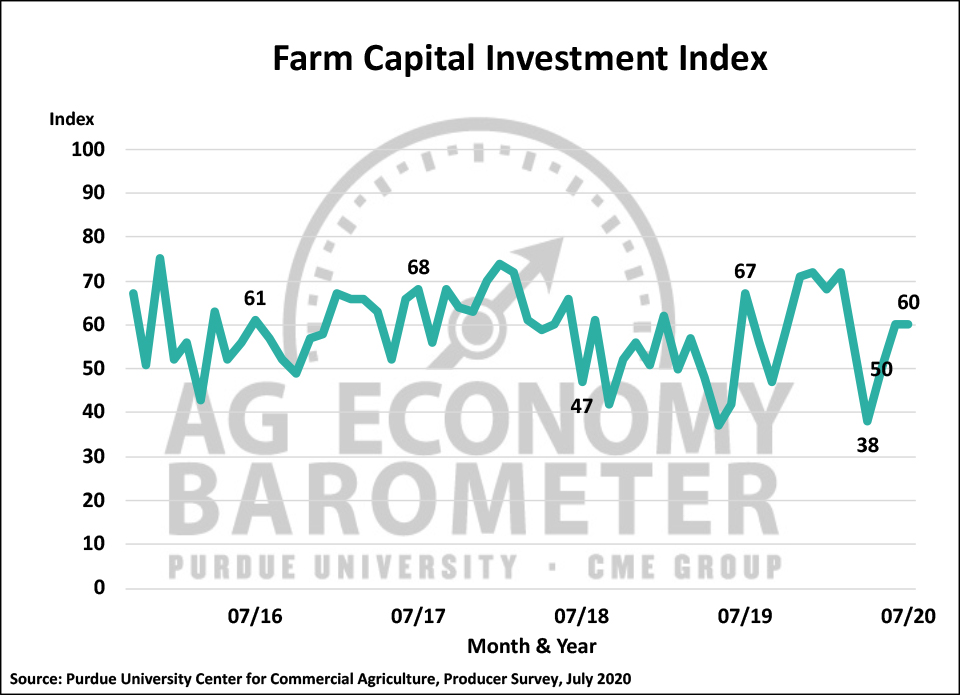
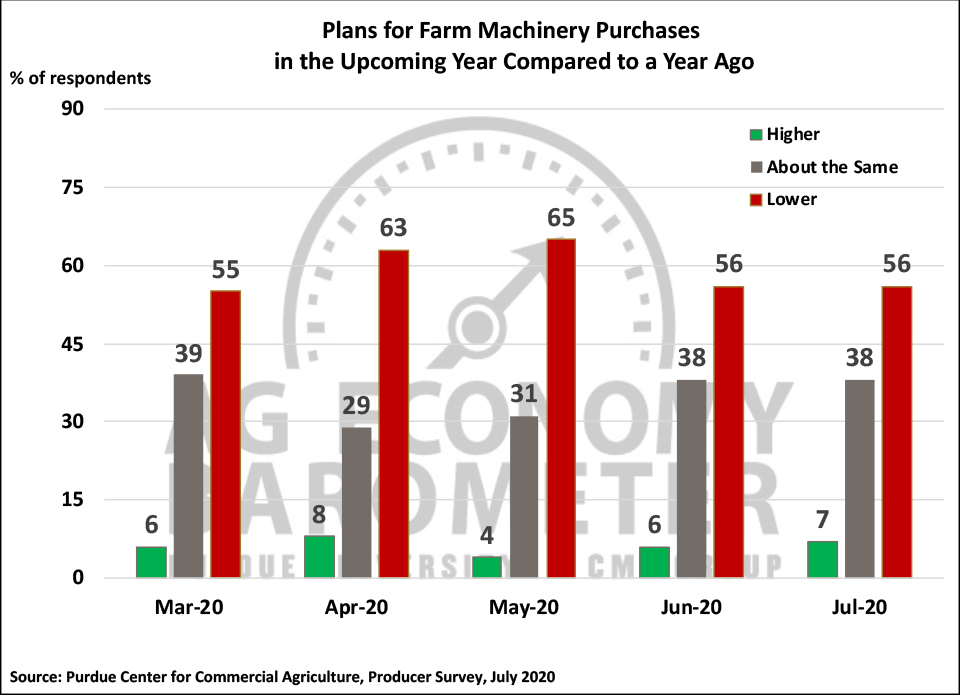
The percentage of farmers who plan to reduce their farm machinery purchases compared to a year ago came in at 56 percent, unchanged from a month earlier but nine points lower than back in May. The percentage of farmers who plan to keep machinery purchases about the same as a year earlier came in at 38 percent, also unchanged from the June reading but seven points higher than in May. Consistent with farmers’ perspective on farm machinery purchases, the Farm Capital Investment Index, with a reading of 60, was unchanged from June. Both the June and July readings for the investment index were stronger than in May, however, when the index stood at a reading of 50.
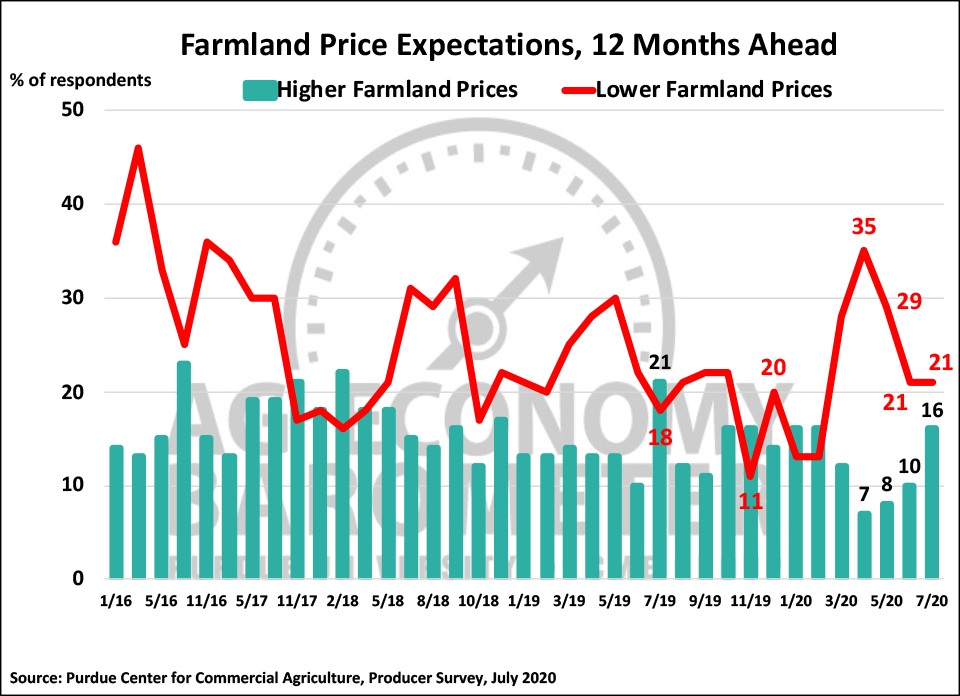
Producers’ short-run perspective on farmland values improved in July compared to June as 16 percent of respondents said they expect farmland values to rise over the next 12 months compared to 10 percent who expected values to rise back in June. However, when queried regarding their longer-run perspective about farmland values, farmers were somewhat less optimistic than they were a month earlier with just 48 percent of respondents saying they expect values to rise over the next five years compared to 55 percent who felt that way in June.
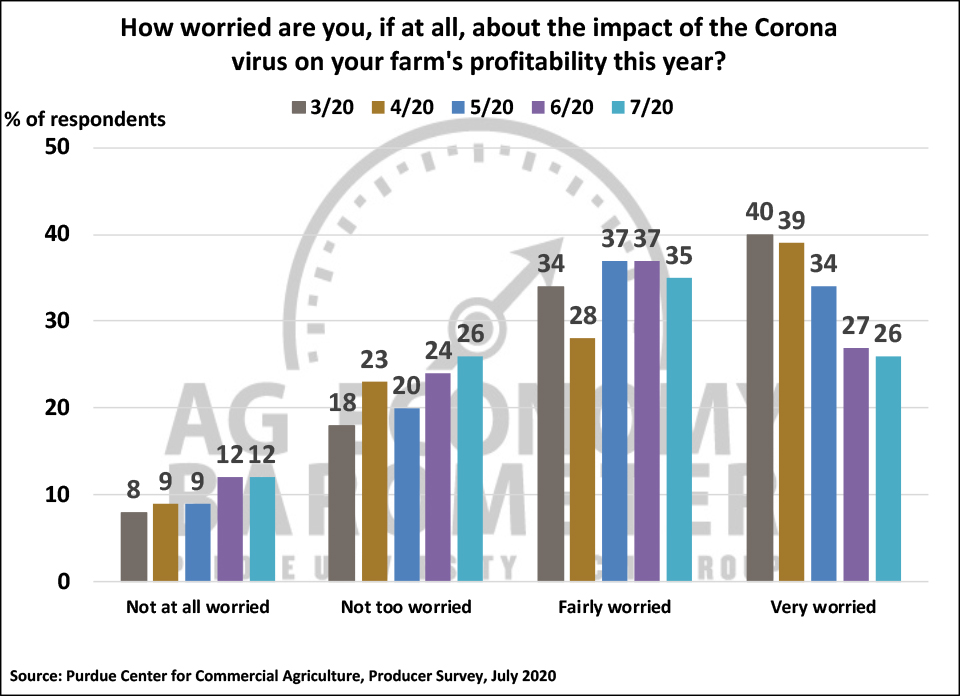
Although a clear majority of farmers responding to the July survey were still worried about coronavirus impacting their farm’s profitability in 2020, the percentage of farmers who were either “fairly worried” or “very worried” has been declining since March. For example, in March, 74 percent of respondents expressed concern about the impact of COVID-19 on their farm’s profitability whereas in July, that percentage had fallen to 61 percent. However, two-thirds of farmers responding to the July survey still said they feel that Congress needs to pass another bill to provide additional economic assistance to farmers, in line with responses received for this question in both May and June.
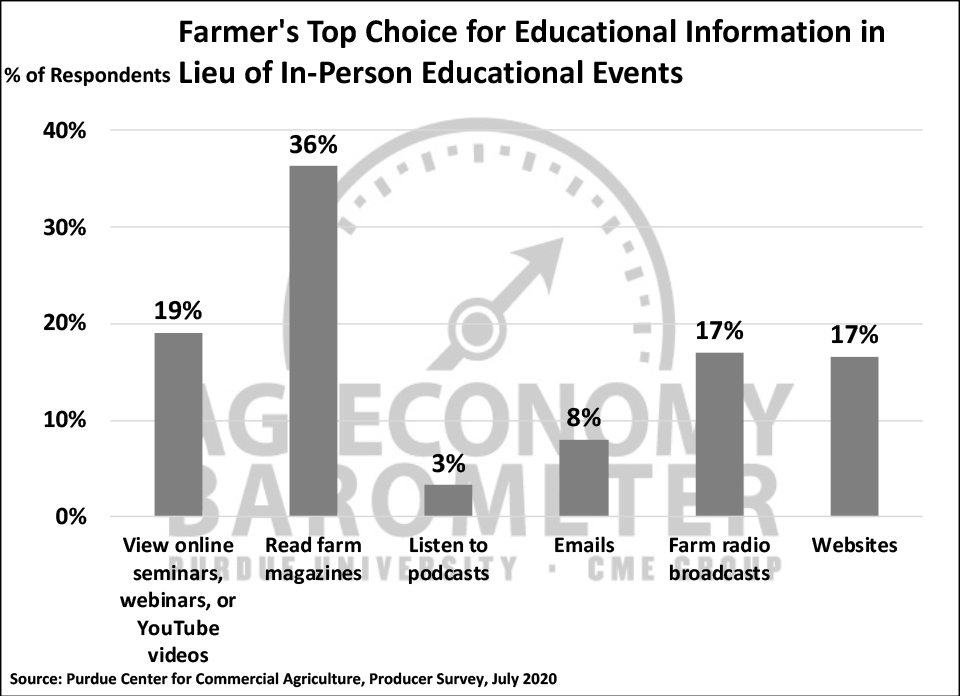
On both the June and July surveys, four out of 10 respondents said they are conducting more business online as a result of COVID-19. On the same two surveys, over half (53 percent) of farmers said they were less likely to attend in-person educational programs as a result of COVID-19 concerns. In light of farmers’ reluctance to attend in-person educational events, the July survey included a couple of questions focused on ascertaining what sources of information respondents intend to rely on in place of in-person events. Responses indicated that a variety of information sources will be relied upon with the most common response being farm magazines, chosen by 24 percent of respondents. Responses to other listed information sources ranged from listening to farm radio broadcasts (17 percent), reading emails (16 percent), visiting websites (16 percent), viewing online webinars and videos (15 percent) and listening to podcasts (12 percent). However, when we followed up and asked respondents to indicate the top source they anticipate relying on in lieu of in-person educational events, over one-third (36 percent) of respondents chose farm magazines, followed by online webinars/videos (19 percent), farm radio broadcasts (17 percent) and websites (17 percent). Noticeably fewer farmers said that emails (8 percent) and podcasts (3 percent) would be their top choice for information to replace in-person educational events.
Volatility in the agricultural markets this year has highlighted the importance of risk management. This month’s survey included several risk management related questions. Just two out of 10 farmers (21 percent) said they have a marketing advisor. Among those farms that do have a marketing advisor, 36 percent said they chose their advisor based upon a recommendation from another producer, and 16 percent said it was based upon a recommendation from another agribusiness. Approximately one out of 10 farmers (11 percent) chose their marketing advisor as a result of an advisor’s direct solicitation to them via U.S. mail, email or phone call while six percent of respondents said they chose their advisor based on an article either written by or quoting the advisor. Farms that work with a marketing advisor said they either “follow somewhat closely” (54 percent) or “follow very closely” (45 percent) their marketing advisor’s recommendations.
Wrapping Up
Farmer sentiment changed little in July compared to a month earlier as the Ag Economy Barometer rose just one point from June to July. Although the barometer changed little from June to July, farmers indicated they were noticeably more optimistic about current conditions and a bit less optimistic about the future than a month earlier. Producers were somewhat less concerned about the impact of coronavirus on their farm’s profitability than they were earlier this spring, but two-thirds of respondents still said they feel Congress needs to pass another bill to provide economic support to farmers as a result of the pandemic. For the second month in a row, over half of farmers said they are less likely to attend in-person educational events this year and over one-third (36 percent) said farm magazines will be their top source to obtain information in lieu of in-person educational events, followed by online webinars/videos (19 percent), farm radio broadcasts (17 percent) and websites (17 percent). Just two out of 10 farmers said they have a marketing advisor to help them make marketing decisions, and over half of the farmers with an advisor said they chose their advisor based upon advice from another producer (36 percent) or an agribusiness firm (16 percent).