


Ag Producer Sentiment Turns Higher; Many Expect Lower Taxes
James Mintert, David Widmar and Michael Langemeier
After trending lower in late 2017, the Purdue/CME Group Ag Economy Barometer turned higher in January. The monthly survey of 400 agricultural producers from across the U.S. indicated that the measure of producer sentiment climbed to 135 points at the beginning of 2018, up 9 points from December’s 126. (Figure 1)
The uptick in sentiment was driven by an improvement in both of the barometer’s two sub-indices: the Index of Current Conditions and the Index of Future Expectations. The improvement in the Index of Future Expectations, a one-month jump of 11 points, was the most obvious driver behind the barometer’s January increase. This was the largest one-month improvement in future expectations since January 2017. The change was further supported by an increase in the Index of Current Conditions, which rose to a reading of 144—a more modest rise of 5 points compared to December 2017 (Figure 2). Producers’ appraisal of current conditions in January was also a bit more positive than last summer when the index reached 142 and was the most positive reading for the Index of Current Conditions since data collection began in October 2015.
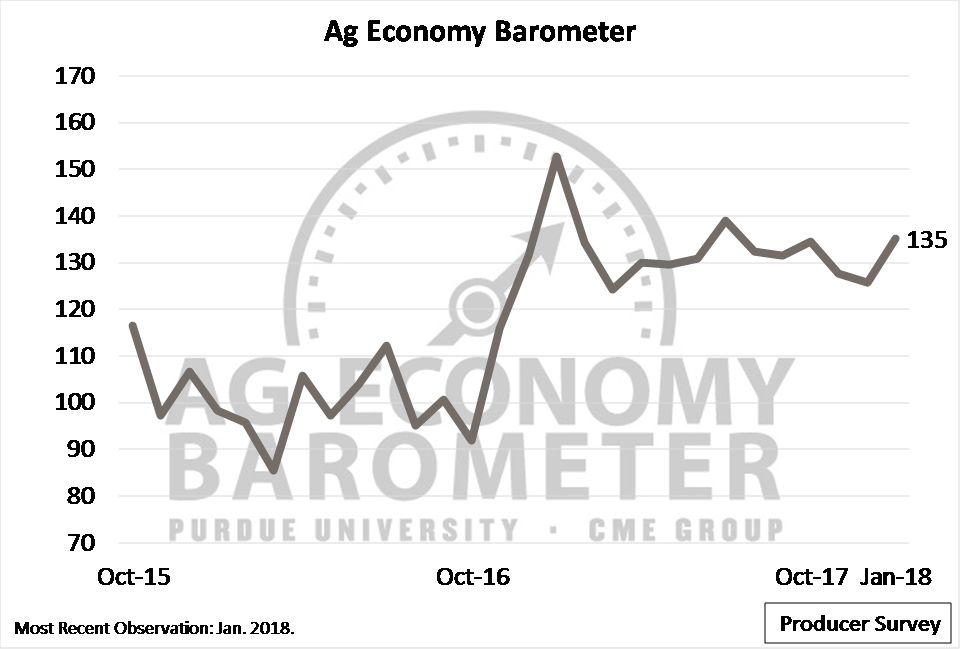
Figure 1. Purdue/CME Group Ag Economy Barometer, October 2015-January 2018.
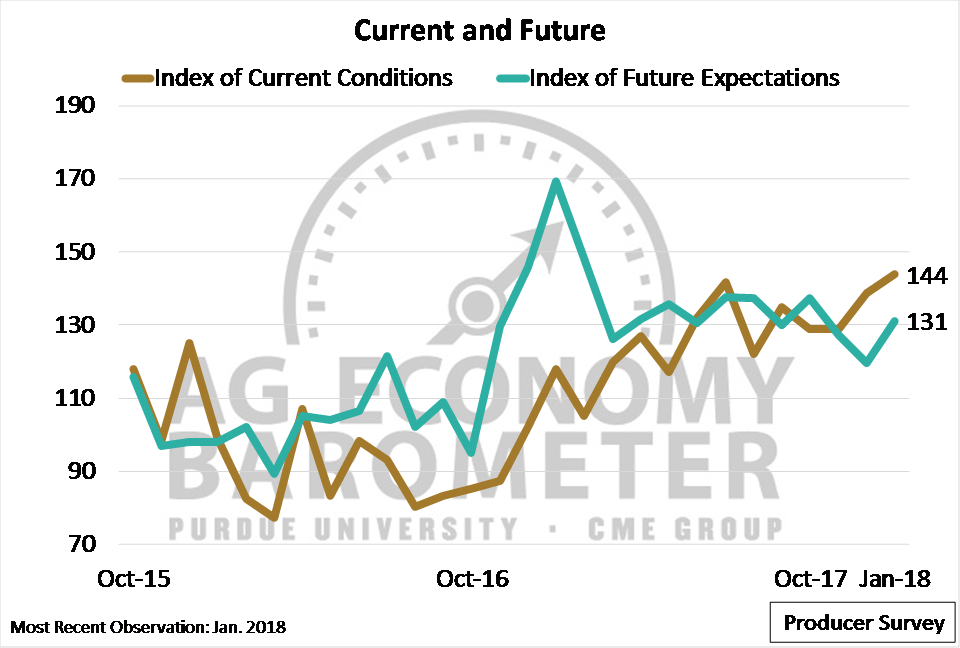
Figure 2. Index of Current Conditions and Index of Future Expectations, October 2015-January 2018.
Improved Farm Financial Conditions
Each month, producers are asked if their farm operations are financially better off, worse off, or about the same compared to a year earlier. Since April 2017, the share reporting “worse off” has consistently fallen below 50 percent of respondents (Figure 3). To help put January’s responses in perspective, this measure, which currently stands at 43 percent of respondents, reached a high of 81 percent in August 2016. The reduction in the share reporting their farms as “worse off” has been an important driver of the ongoing improvement in the Index of Current Conditions.
Also contributing to the rise in the Index of Current Conditions has been an uptick in the share of producers reporting that their farms are financially “better off” compared to a year before. In January 2018, 14 percent of respondents felt their farms were better off financially than in January 2017, which seems low until noticing that this was only the second time since data collection began in 2015 that responses were this positive. Looked at another way, during January more than four times as many producers reported their farm was better off financially, compared to a year earlier, than did in July 2016, when the response hit a life-of-survey low 3 percent.
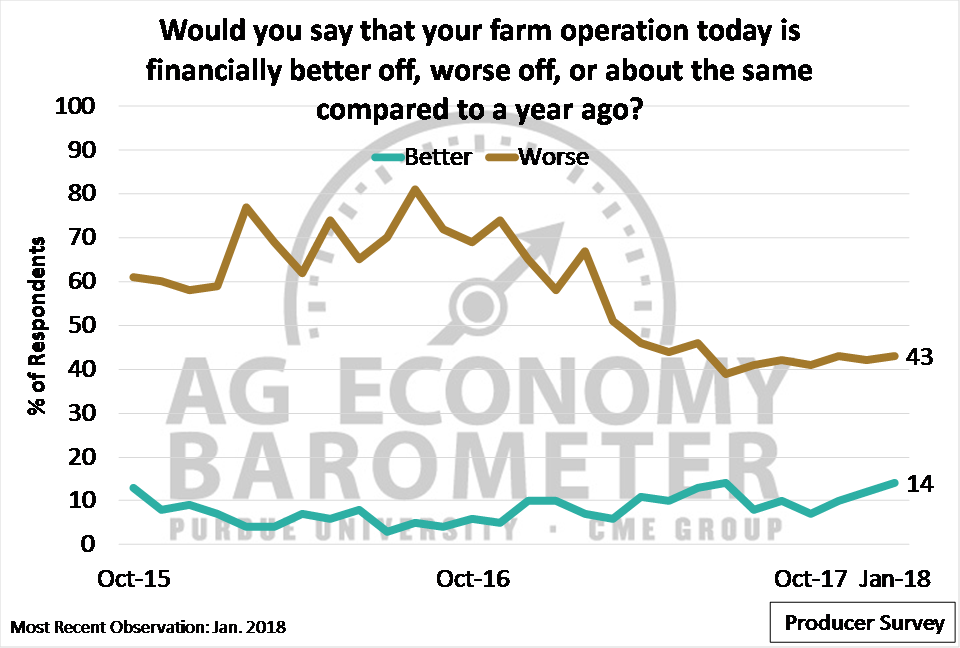
Figure 3. Share of producers reporting their farms “better” and “worse” off financially, compared to a year before. October 2015-January 2018. (Not shown: Share reporting “about the same.”)
Tax Bill’s Impact on Producer Sentiment
The January survey provided the first opportunity following the passage of the Tax Cuts and Jobs Act of 2017 to assess producers’ perspectives regarding the likely impact on their farming operations. Two questions related to the tax bill were posed. The first question asked producers to rate the expected impact of the tax bill on their farm operations on a scale that ranged from 1 (very adverse) to 9 (very beneficial) (Figure 4). Although the single largest response category (35 percent) was 5, suggesting a neutral rating, there were far more producers who expect a beneficial impact than a negative impact from the tax bill. For example, nearly half of all producers (47 percent) expect the tax bill to be beneficial to their operations, providing a rank of 6 or higher on the survey. Conversely, approximately one out of five (19 percent) respondents provided a ranking of 4 or less, indicating they expect the tax bill to have a negative impact on their farming operations.
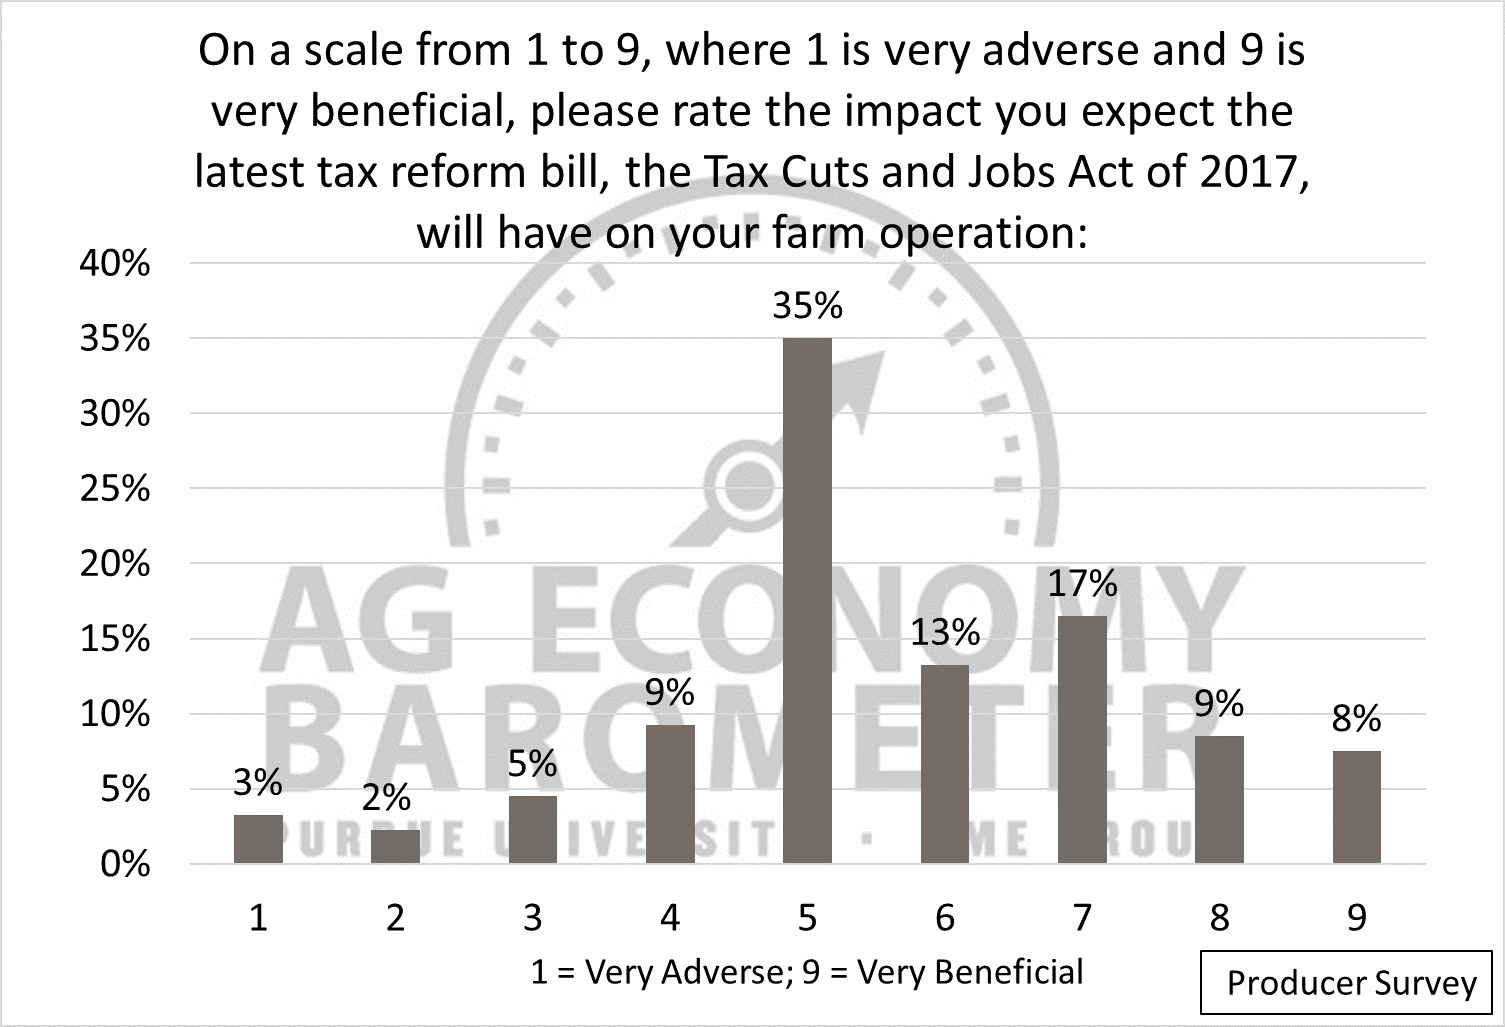
Figure 4. Rating of the Tax Cuts and Job Act of 2017 impacts on respondents’ farm operations.
A second question related to the tax bill asked producers if they expect the taxes their families face to be higher, lower, or about the same as a result of the tax bill’s passage (Figure 5). Approximately four out of ten producers (43 percent) expect their families’ tax burdens to decline as a result of the tax bill’s passage. On the other end of the spectrum, nearly one-fifth of producers (18 percent) expect their taxes to increase as a result of the tax bill. Finally, 40 percent of respondents said they expected their family taxes to be about the same under the new tax bill. It’s possible the 40 percent of respondents expecting no change in their taxes (Figure 5) and the 35 percent of producers who provided a neutral rating with respect to the expected impact of the bill on their farm operations (Figure 4), could reflect uncertainty regarding the specific content of the tax bill and the fact that IRS regulations implementing the tax bill have yet to be issued.
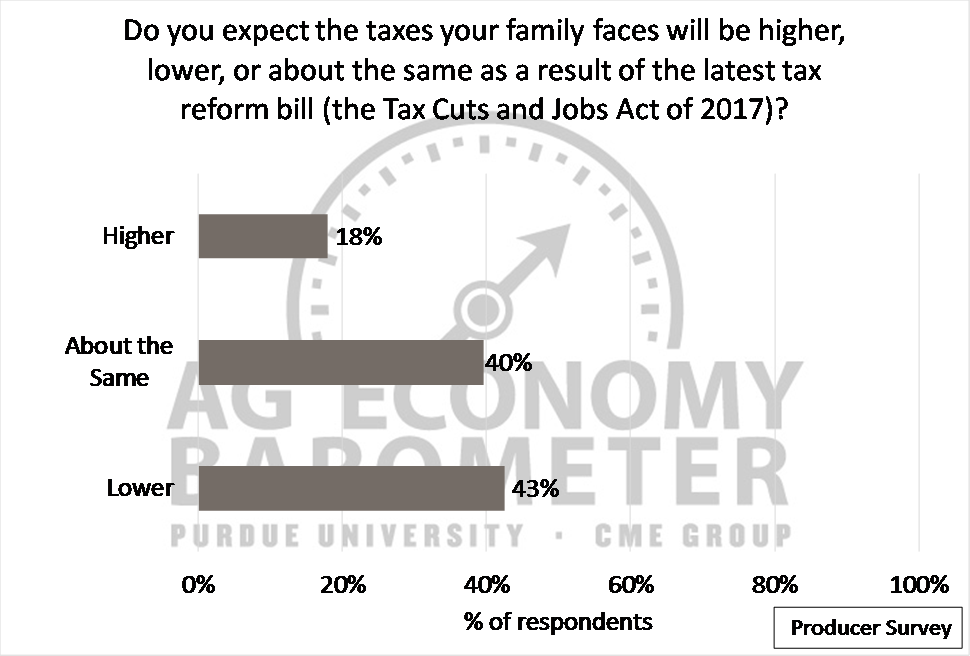
Figure 5. Respondents’ expectations of the Tax Cuts and Jobs Act of 2017 impact on the taxes their families face.
Agricultural Thought Leaders
On a quarterly basis, the Ag Economy Barometer survey is conducted in parallel with a survey sent to 100 agricultural thought leaders. From this second survey, an Ag Thought Leader Index has been calculated and tracked. In January, the Ag Thought Leader Index was 127 points, down sharply from spring, summer and fall 2017 readings, but only modestly lower than in January 2017 (Figure 6).
Digging deeper into Ag Thought Leader Survey responses provides an interesting contrast to responses provided by producers. Similar to the Ag Economy Barometer, the Ag Thought Leaders Index can be decomposed into both current and future expectations indices. Unlike producers, thought leaders’ perception of current conditions has been declining continuously since spring 2017 and is back close to levels recorded during most of 2016 (Figure 7). This is in marked contrast to producers’ Index of Current Conditions, which was at a life-of-survey high in January.
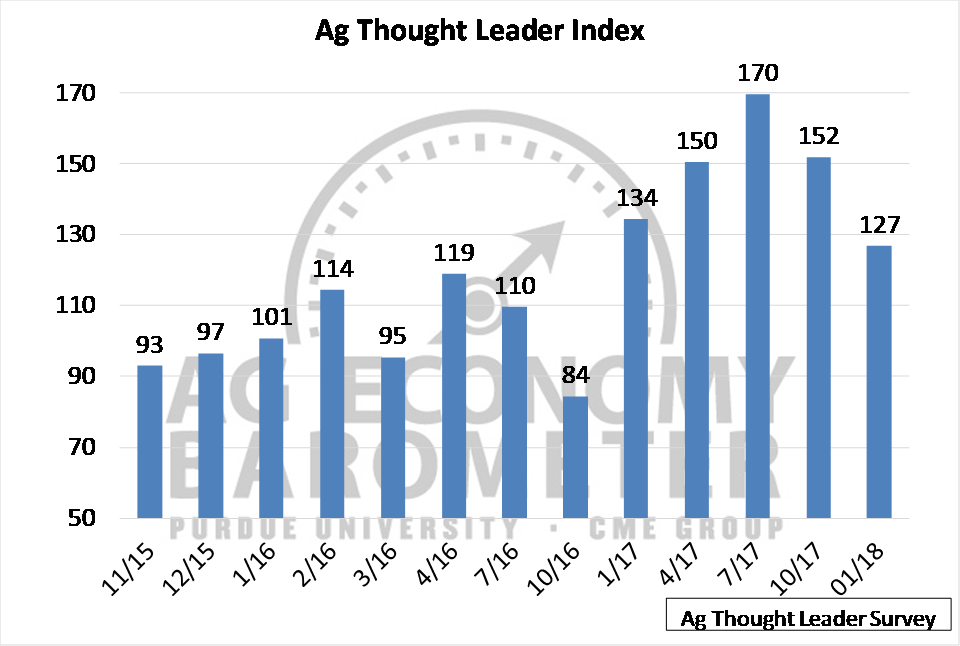
Figure 6. Ag Thought Leader Index, November 2015-January 2018.
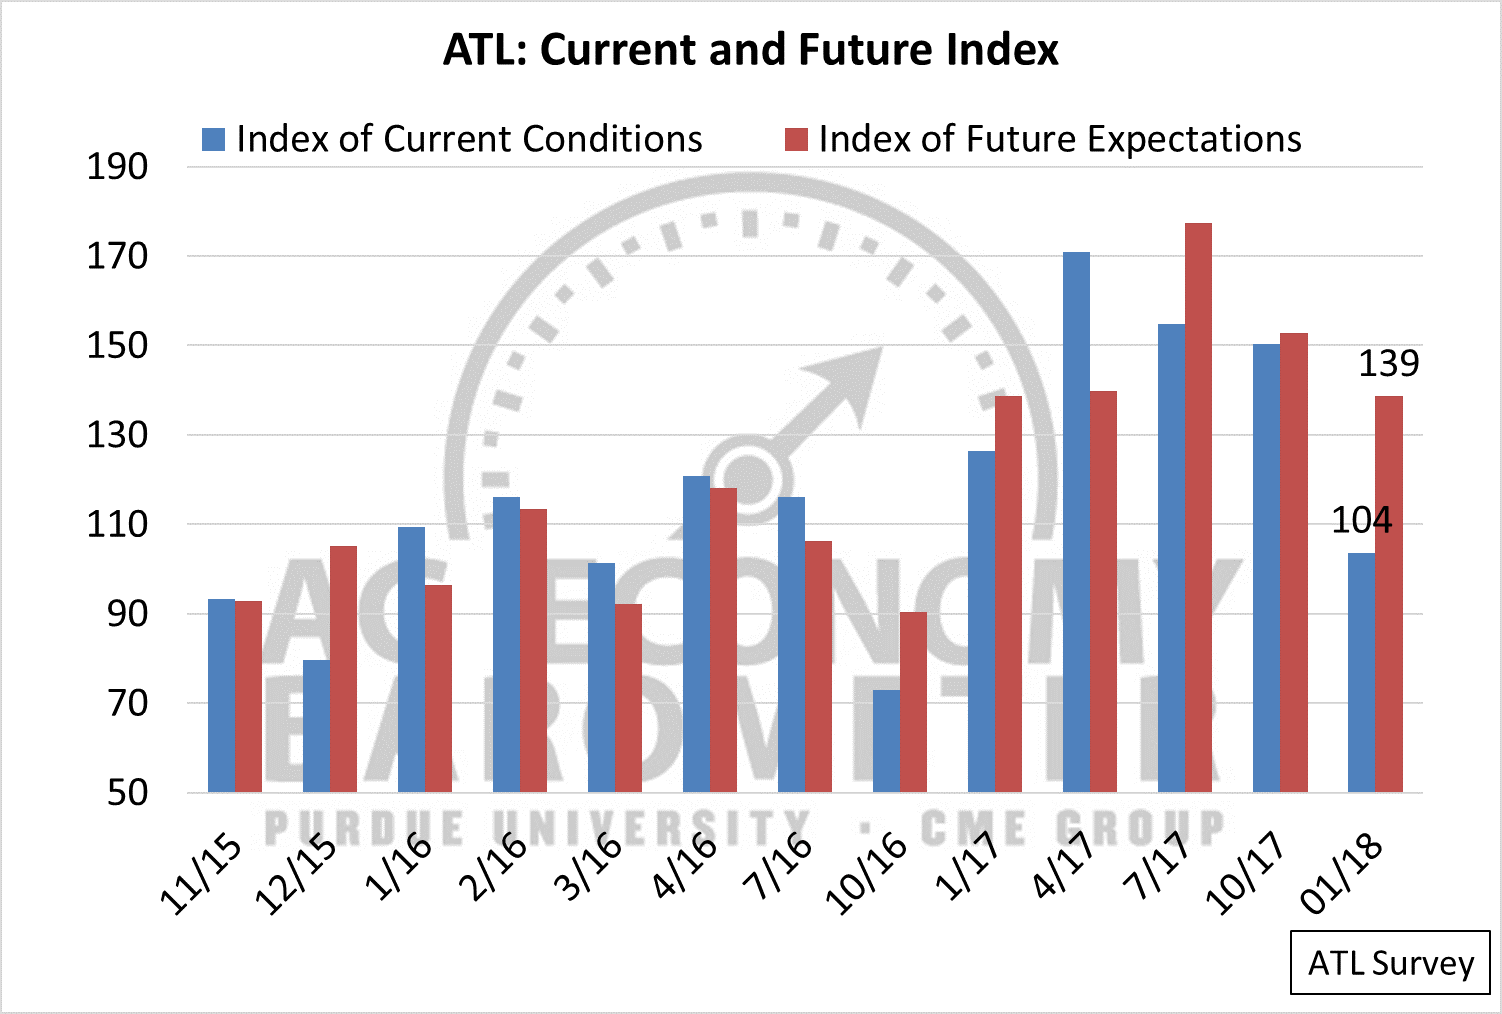
Figure 7. Ag Thought Leader Current Conditions and Future Expectations indices.
Conclusions
Agricultural producer sentiment improved during January compared to a month earlier, driven by improved expectations for the future and, to a lesser extent, by a perceived improvement in current conditions. The increase in the Index of Current Conditions marked the continuation of a long-term trend dating back to summer 2016. In contrast, agricultural thought leaders’ perspective on current economic conditions has been declining continuously since April 2017 and is now back within the range of readings observed throughout much of 2016. This month’s survey provided the first opportunity to gauge producers’ perception of the Tax Cuts and Job Act of 2017 on their farming operations and their families’ tax obligations. Responses indicated that, although there is still a great deal of uncertainty regarding the tax bill’s expected impact, more farm operators expect the tax bill to be beneficial to their farming operations and to lower their families’ taxes than expect a negative impact and higher taxes.