


As producer sentiment holds steady, farmers weigh in on rising input prices and farmland values
James Mintert and Michael Langemeier, Purdue Center for Commercial Agriculture
A breakdown on the Purdue/CME Group Ag Economy Barometer July results can be viewed at https://purdue.ag/barometervideo. Find the audio podcast discussion for insight on this month’s sentiment at https://purdue.ag/agcast.
Download report (pdf)
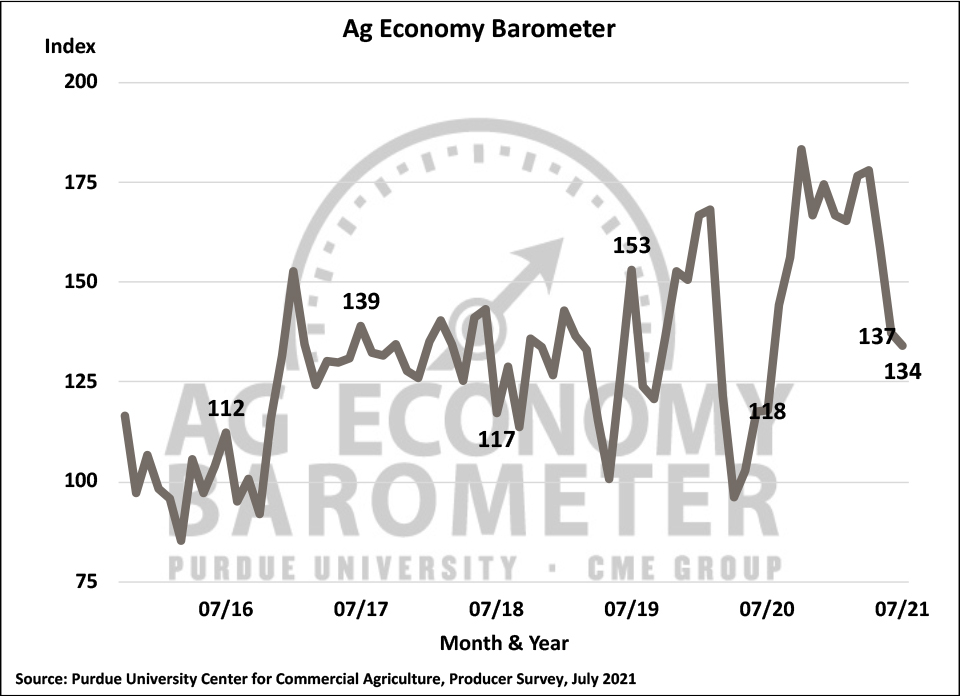
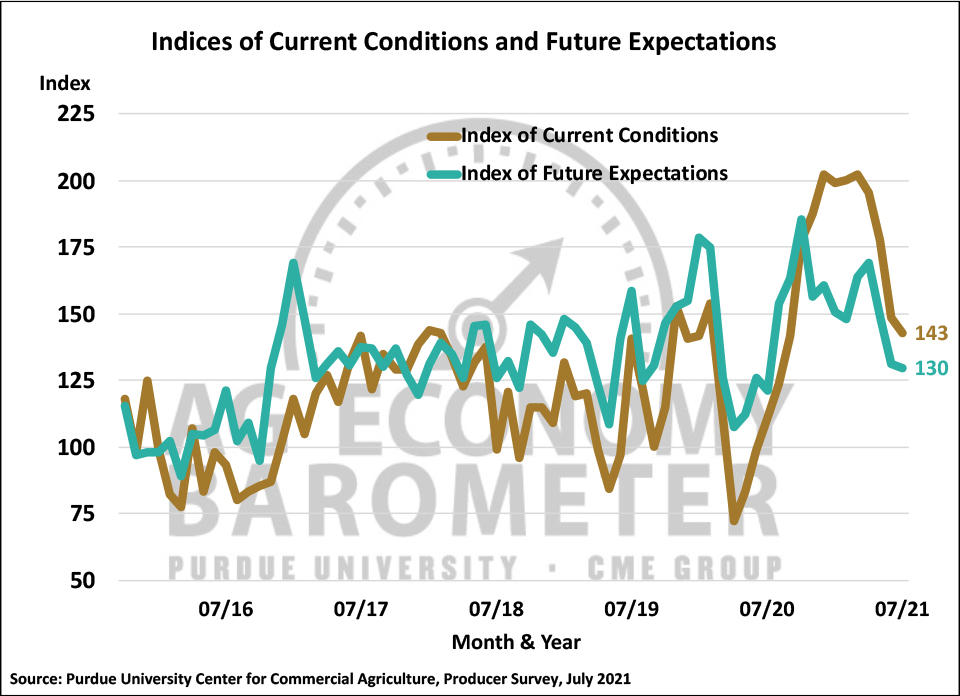
On the heels of a sharp two-month decline, the Agricultural Economy Barometer stabilized at a reading of 134 in July, just 3 points below a month earlier. This month’s sentiment index was the weakest barometer reading since July of 2020 and marked a return to sentiment readings observed from 2017 through 2019 when annual average barometer readings ranged from 131 to 133. Ag producers’ sentiment regarding current conditions weakened in July. The Index of Current Conditions, at 143, fell 6 points below June’s value as principal crop prices weakened. The Index of Future Expectations also softened, but at 130 was just 2 points below a month earlier. The Purdue University-CME Group Ag Economy Barometer sentiment index is calculated each month from 400 U.S. agricultural producers’ responses to a telephone survey. This month’s survey was conducted from July 19-23, 2021.
The Farm Financial Performance Index improved modestly during July to a reading of 99, 3 points higher than in June. Although this month’s index reading was 28% below its April peak, it remains well above readings from a year earlier. For example, this month’s Farm Financial Performance Index reading was up 43% compared to July 2020 when the index stood at 69. Ag producers’ sentiment regarding their farms’ financial condition was more optimistic when prices for corn, soybeans, and wheat were surging last fall, winter, and early spring but viewed in a longer-run context, recent sentiment readings suggest farmers remain cautiously optimistic about financial conditions on their farms.
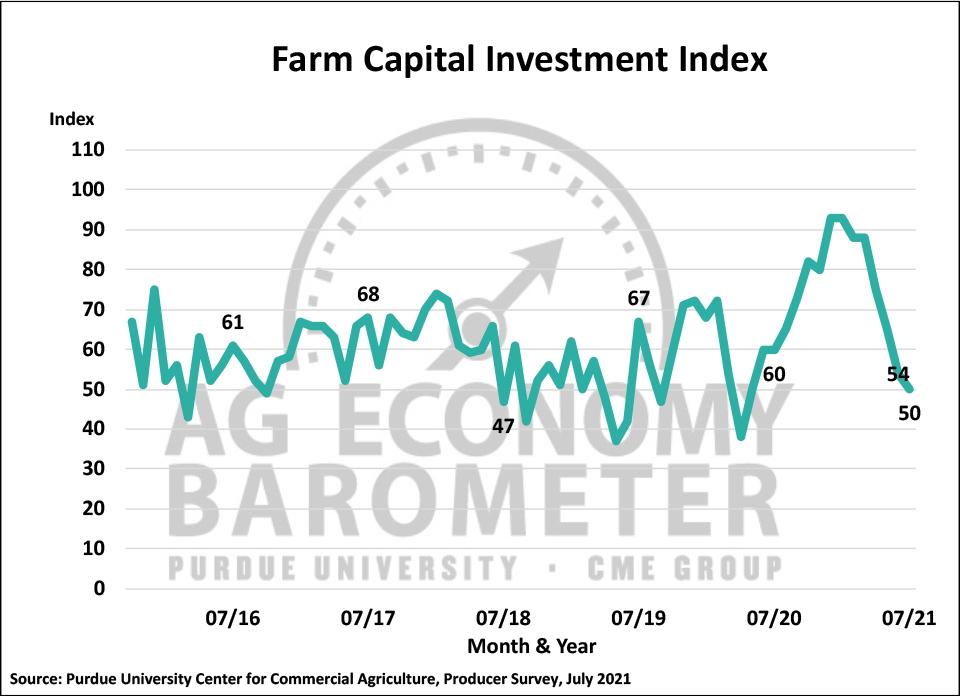
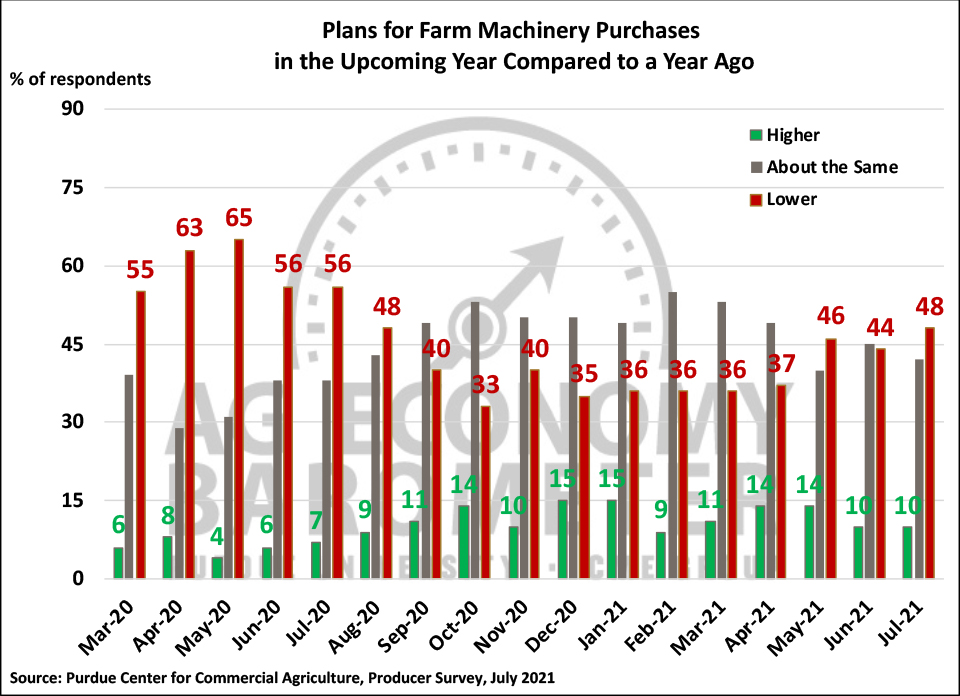
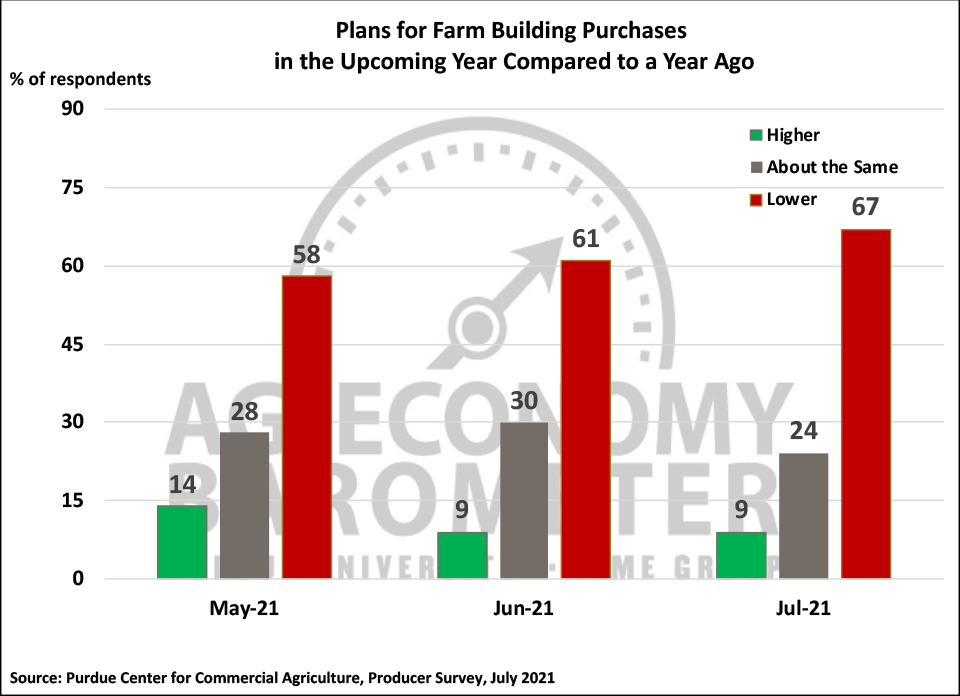
The Farm Capital Investment Index moved lower in July to a reading of 50, down 4 points compared to June. Weakness in the investment index was primarily attributable to the ongoing decline in plans for farm building and grain bin purchases in the upcoming year. Two-thirds of July’s respondents said their construction plans were lower than a year earlier, compared to 61% who said that in June. The shift in construction plans was attributable to a drop-off in the percentage of farmers who planned to keep their purchases about the same as last year. Plans for farm machinery purchases were somewhat weaker in July than in June as producers were a bit more inclined to say they would reduce their machinery purchases instead of holding them constant with a year earlier. Meanwhile, the percentage of producers planning to increase purchases was unchanged.
Some of the concerns picked up about future financial performance and the advisability of making large investments on the survey could be attributable to producers’ concerns about rising costs. For the second month in a row, the barometer survey asked producers about their expectations for farm input prices. Responses on the July survey mirrored those on the June survey. Just over half (51%) of the producers in this month’s survey expect input prices to rise 4% or more over the next year, three out of ten expect costs to rise 8% or more and nearly one out of five (18%) expect input prices to rise by 12% or more. These expectations are markedly higher than the rate of 1.8% per year that input prices rose over the last decade.
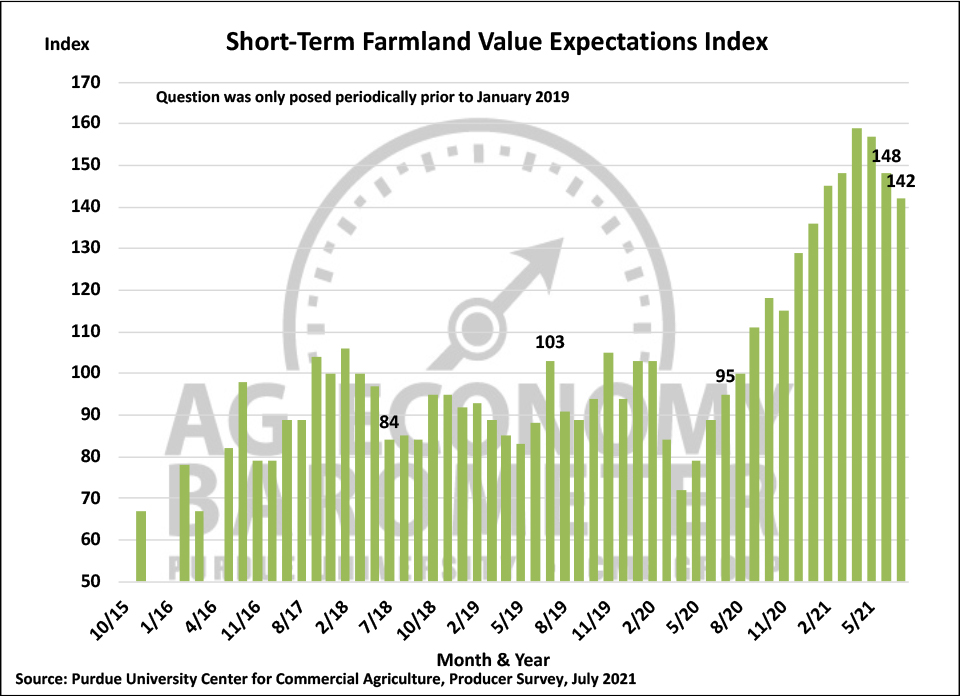
Farmers remain bullish about farmland values, although recent value increases could be making some producers more cautious about where land values are headed in the next 12 months and the next several years. The Short-Term Farmland Values Expectations Index weakened this month to a reading of 142, down from 148 in June while the long-term index also weakened to 151 vs. 155 a month earlier. In both cases, however, the indices remain near their all-time highs, indicating farmers remain relatively bullish about farmland values.
One reason why some farmers are not as optimistic about future farmland values as they were earlier this year could be the increase in farmland values that has already taken place. Corn Belt farmland values, in particular, have climbed sharply in recent months. Purdue University’s annual Farmland Values and Cash Rent Survey, conducted in June 2021 and published in late July, indicated that Indiana cropland values rose 12 to 14%, depending on land quality, compared to the June 2020 survey results. The Purdue survey’s results followed on the heels of the Chicago Federal Reserve Bank’s Spring 2021 survey which indicated that 7th District agricultural land values rose 7% from April 2020 to April 2021.
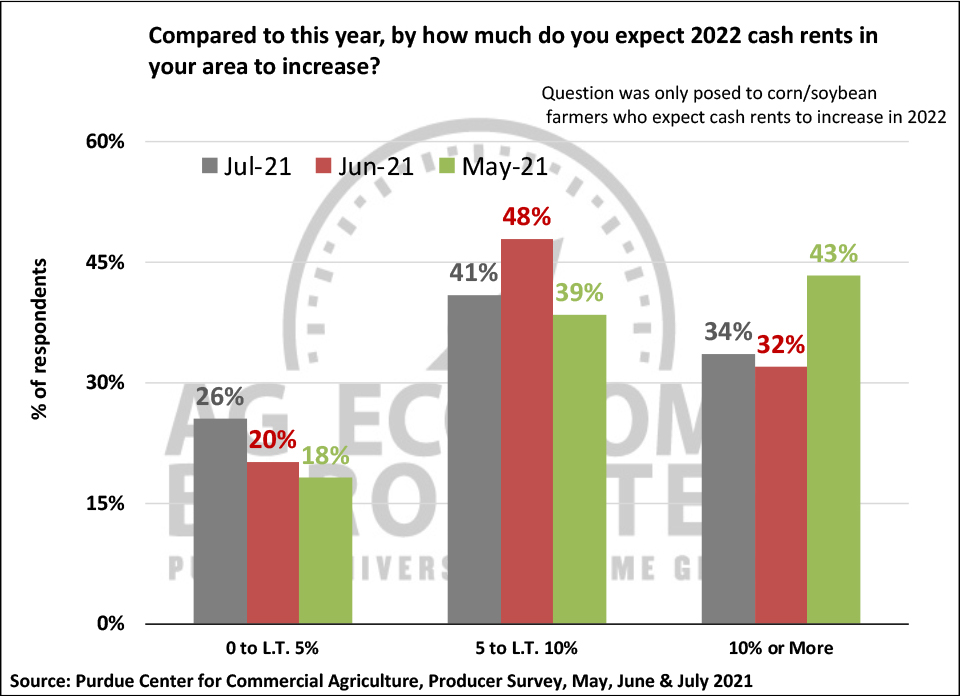
Nearly half (47%) of the corn/soybean growers in our July survey said they expect farmland cash rental rates to rise in 2022. The percentage of growers expecting rates to rise in 2022 was unchanged from the June survey but lower than in May. Among those producers expecting higher rental rates next year, there’s been a shift over the last 3 months regarding how large of a rental rate increase is likely. Just over 40% of corn/soybean growers who expect rates to rise think the increase will range from 5 up to 10%, but fewer producers in July (34%) said they expect a rate rise of 10% or more, compared to 43% in May. Correspondingly, more producers in July (26%) said they expect a moderate rate increase of less than 5%, compared to 18% in May.
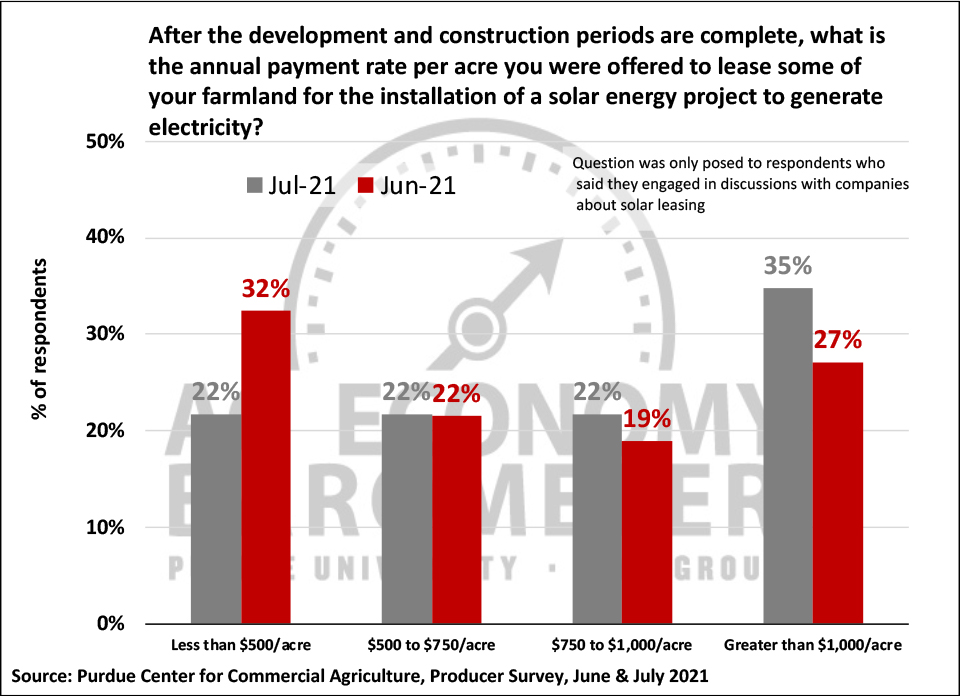
For the second month in a row, the barometer survey included questions on leasing farmland for solar energy production. Several findings are of interest. First, on the June and July surveys, the percentage of all respondents who have engaged in solar energy leasing discussions ranged from 6% (July survey) to 9% (June survey). Second, on the July survey, a question asking producers if one or more of their landlords had engaged in solar leasing discussions was included. Six percent of all ag producers in our survey said they had a landlord discussing solar leasing alternatives which matched the percentage of producers engaging in solar lease discussions on farmland they owned themselves. Third, in a follow-up question, we asked producers if either they or one of their landlords had signed a solar leasing contract. Four percent of this month’s survey respondents indicated that a solar contract had been signed either by them or one of their landlords. Finally, we asked producers what lease rates, following completion of the development and construction phases, were offered by solar leasing companies. Once again lease rates offered were quite variable. Keeping in mind that the number of respondents reporting lease rates was quite small, a comparison of the June and July results suggests there might be a trend towards solar lease rates rising. For example, in July more respondents reported lease rates greater than $1,000 per acre and fewer reported being offered lease rates of less than $500 than on the June survey.
Finally, this month’s survey included a question to learn more about ag producers’ reaction to the Executive Order issued in early July by President Biden. The order, which addresses several aspects of agricultural production and marketing, is entitled Executive Order on Promoting Competition in the American Economy and we asked producers for their perspective on the order. Nearly a fourth of respondents indicated that they did not think the order was needed while 8% of respondents said they agreed with the need for the order. However, the vast majority of respondents (69%) said they needed more information about the order to respond to the question.
Wrapping Up
Ag producer sentiment appeared to stabilize in July, following a sharp two-month decline, as the Ag Economy Barometer was just 3 points lower than in June. The small decline in the barometer was primarily the result of weakening perceptions of current conditions as the Current Conditions Index declined 6 points compared to a month earlier. Producers remain concerned that farm input prices are likely to rise much more sharply in the coming year than in the recent past and nearly half of corn/soybean farmers expect farmland cash rental rates to rise, potentially squeezing profit margins. The Farm Capital Investment Index declined again this month, the fourth month in a row the index has declined. The decline in the investment index appeared to be driven mostly by the ongoing decline in plans for farm building and grain bin construction. Although the short-term and long-term farmland value indices weakened in July, both indices remain near the all-time highs. Recent declines in the farmland indices could be reflecting the fact that farmland values have risen sharply over the last year, leading producers to be cautious about the likelihood of further price increases.