


Commodity Price Outlook and Interest Rate Concerns Cloud Farmer Sentiment
James Mintert and Michael Langemeier, Purdue Center for Commercial Agriculture
A breakdown on the Purdue/CME Group Ag Economy Barometer January results can be viewed at https://purdue.ag/barometervideo. Find the audio podcast discussion for insight on this month’s sentiment at https://purdue.ag/agcast.
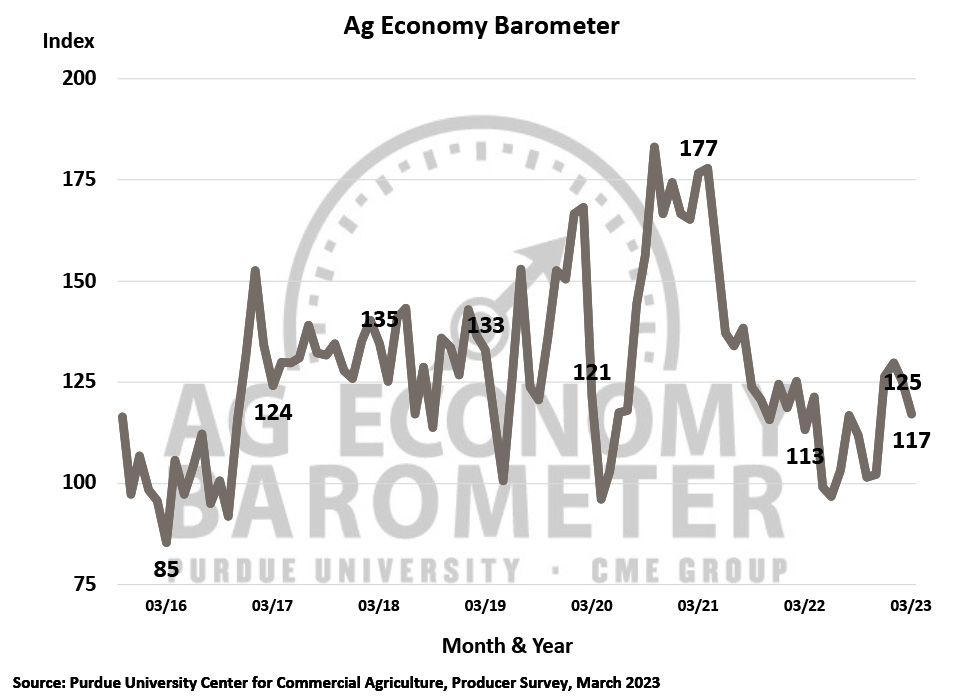
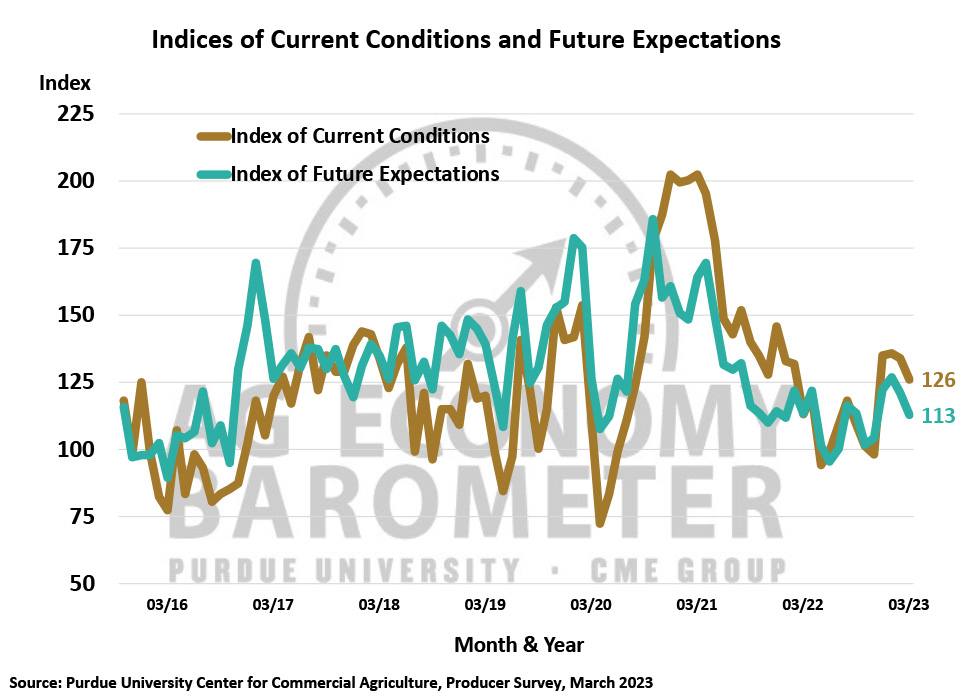
Farmer sentiment weakened again in March as the Purdue University-CME Group Ag Economy Barometer fell 8 points to a reading of 117. Both the Index of Current Conditions and Index of Future Expectations declined 8 points in March leaving the Current Conditions Index at 126 and the Future Expectations Index at 113. Weaker prices for key commodities including wheat, corn, and soybeans from mid-February through mid-March were a key factor behind this month’s weaker sentiment reading. The Purdue University-CME Group Ag Economy Barometer sentiment index is calculated each month from 400 U.S. agricultural producers’ responses to a telephone survey. This month’s survey was conducted from March 13-17, 2023 which coincided with the demise of Silicon Valley Bank and Signature Bank. Although the March survey did not include any questions directly related to the bank closures, it did reveal that rising interest rates have become a bigger concern among farmers. Additionally, when responding to the open-ended comment question posed at the end of each survey, multiple respondents voiced concerns about the banking sector’s problems and its potential to hurt the economy which likely also weighed on producer sentiment.
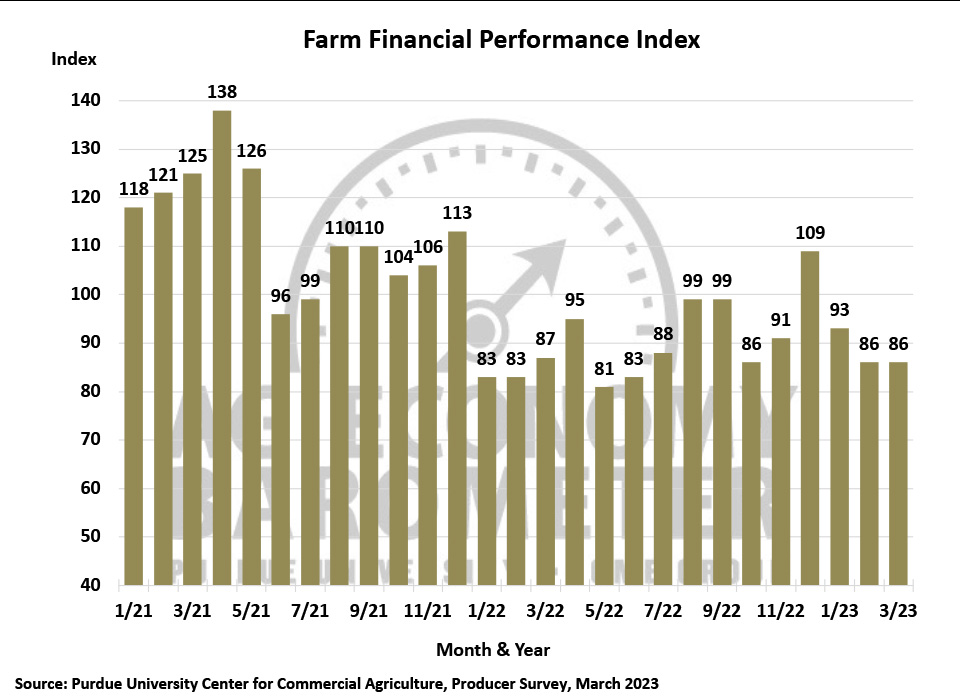
The Farm Financial Performance Index reading of 86 was unchanged from February and nearly identical to a one-year earlier. Although the index was unchanged, farmers continue to express more concern about rising interest rates with 25% of respondents choosing that as one of their top concerns for the upcoming year. The percentage of farmers choosing rising rates as a top concern has been increasing steadily since last summer when just 14% of respondents identified it as a top concern. Higher input costs remain the number one concern, chosen by 34% of producers this month, but concern about input costs has been falling since last summer’s peak when it was chosen by 53% of producers.
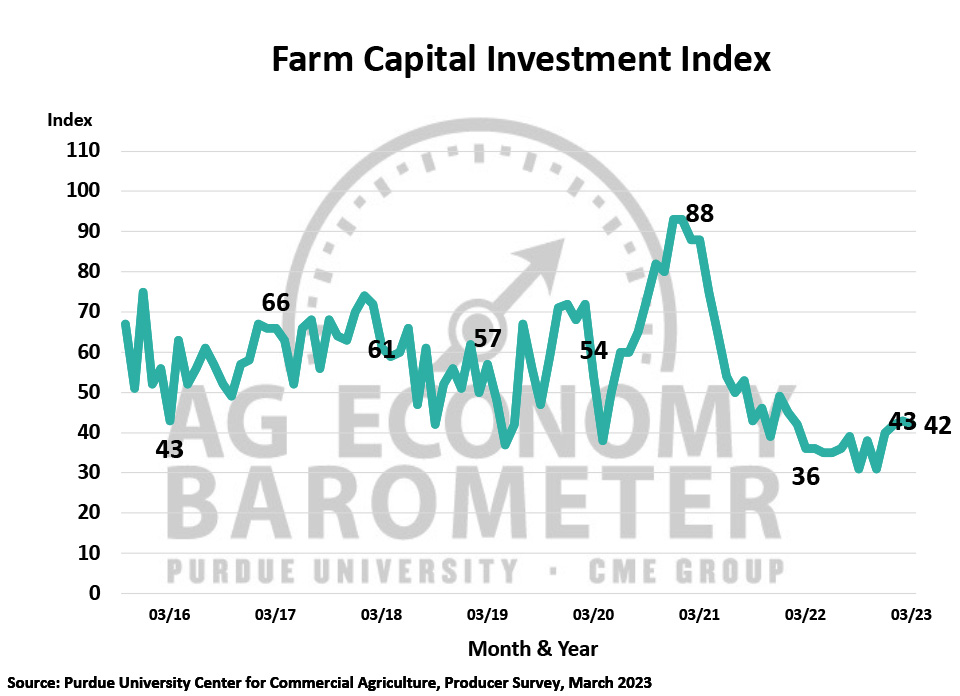
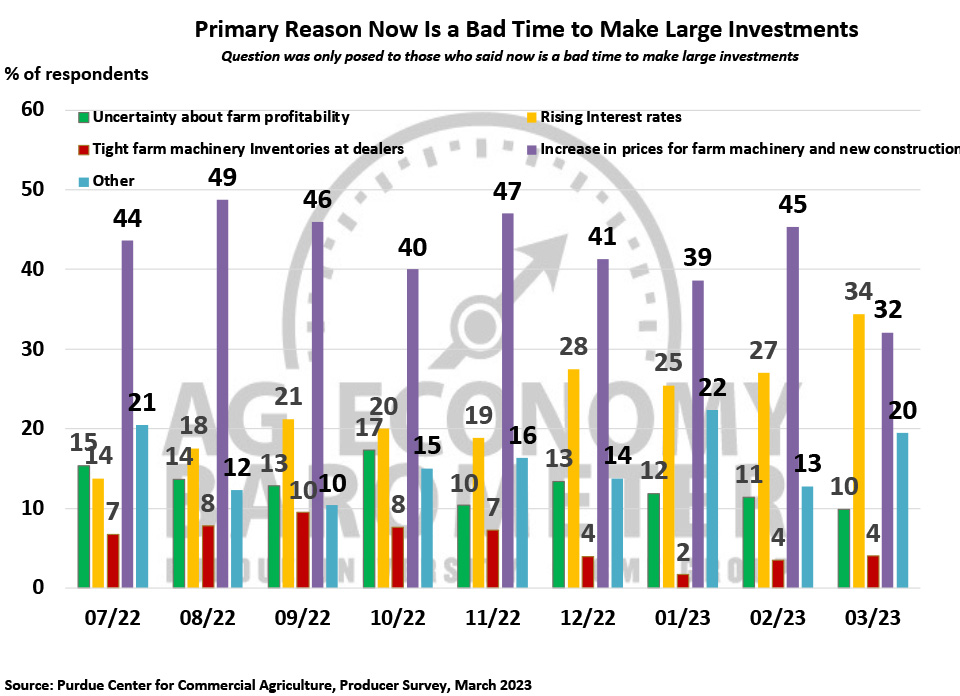
For the third month in a row, there was little change in the Farm Capital Investment Index which came in at 42 in March, one point lower than a month earlier but 6 points higher than a year ago. However, among respondents who said it was a bad time for large investments, there was a change in perspective. In previous surveys going back to last July, the increase in prices for farm machinery and new construction was the top choice among respondents as the key reason now is a bad time to make such investments. That changed this month with the increase in prices eclipsed by rising interest rates as the primary reason. High prices for machinery and new construction was chosen by 32% of respondents this month, down from 45% last month, while rising interest rates was chosen by 34% of those who think now is a bad time for investments, up from 27% in February. Rising interest rates was chosen by only 14% of the respondents last summer.
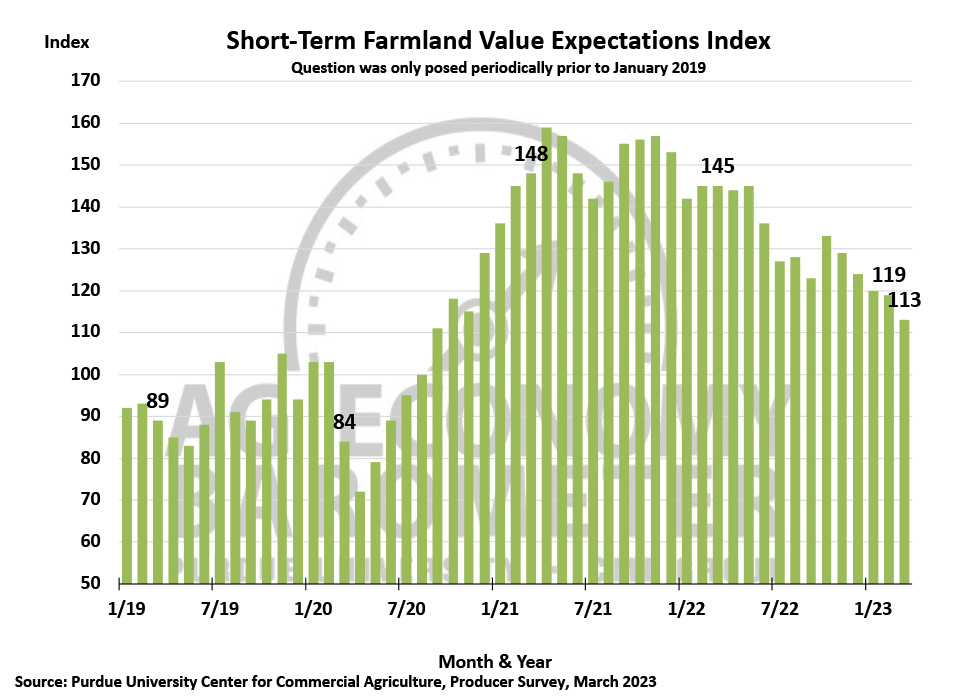
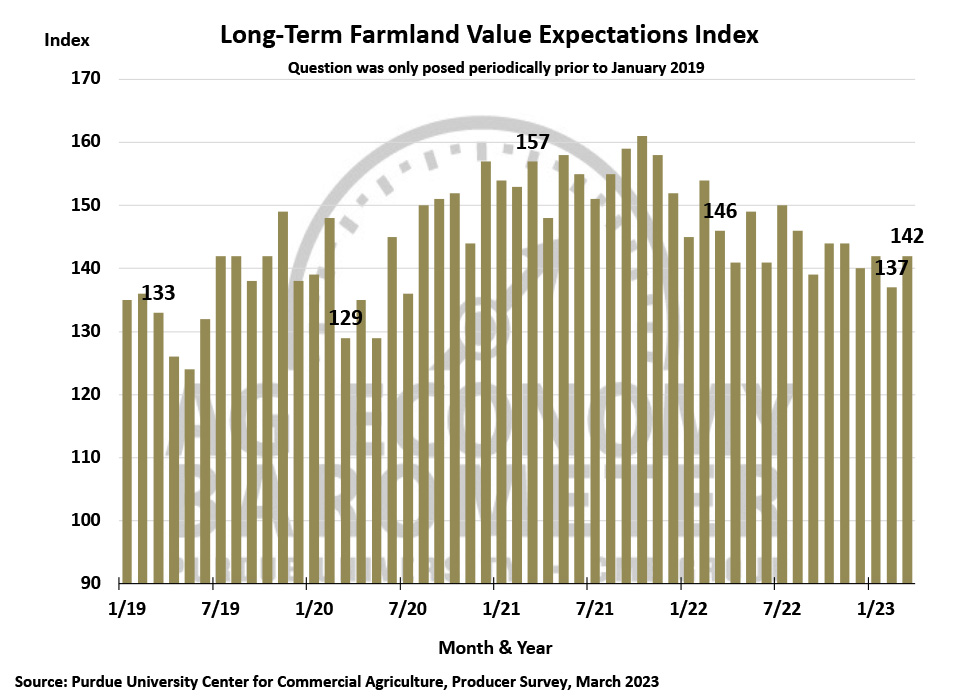
The Short and Long-Term Farmland Value Indices moved in opposite directions in March. The short-term index, which asks respondents about their farmland value expectations in the upcoming 12 months, fell 6 points to a reading of 113. On the other hand, the long-term index, which asks respondents about their farmland outlook for the upcoming 5 years, rose 5 points to 142. This month’s short-term index value provided the weakest reading since September 2020 and left the index 32 points lower than a year earlier. One out of five producers in this month’s survey said they expect farmland values to weaken in the next 12 months. Producers’ longer-term outlook for farmland was noticeably more sanguine as the long-term index was just 4 points lower than in March 2022. Although the long-term index continues to provide a more optimistic view of future farmland values than the short-term index, the percentage of producers who think values could weaken in the next five years has been rising. This month 17% of respondents said they expect weaker values in the next 5 years, up from 13% a year ago and 7% two years ago.
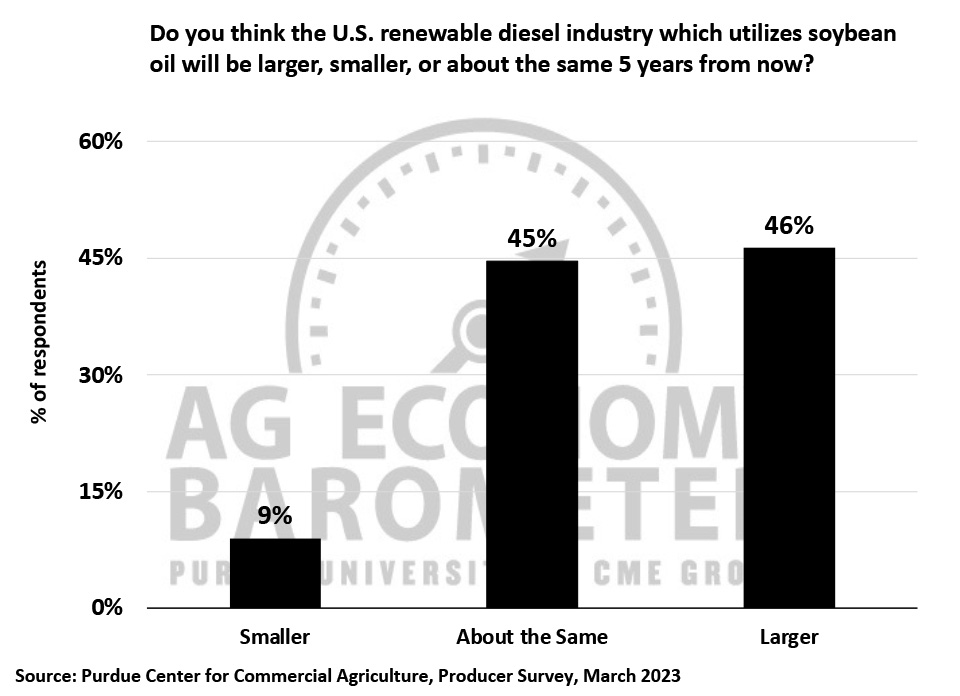
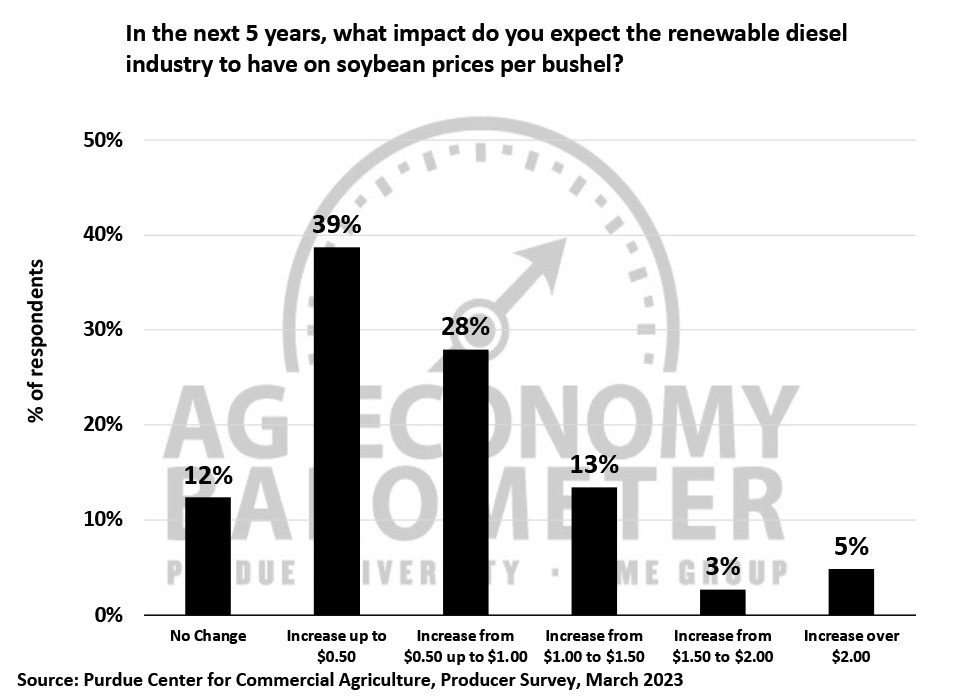
This month’s survey included several renewable energy questions focused on the ethanol and renewable diesel sectors. When asked to look ahead 5 years, nearly half (46%) of respondents said they expected the renewable diesel industry to be larger than it is today. This compares to just 25% of respondents who expect the ethanol industry to grow in size over the next 5 years. In a follow-up question, respondents were asked what impact they expect the renewable diesel industry to have on soybean prices over the upcoming 5 years. The most common response chosen by 39% of respondents was a price increase of up to $0.50 per bushel while just over one-fourth (28%) of farmers in the March survey said they expect renewable diesel to boost soybean prices in a range of $0.50 up to $1.00 per bushel. Finally, just over one out of five producers (21%) expect soybean prices to rise by $1.00 or more per bushel as a result of increased demand from the renewable diesel industry.
Wrapping Up
Farmers’ sentiment weakened again in March as producers expressed less confidence both in the current and future situations on their farms and in U.S. agriculture. Price declines for wheat, corn and soybeans during late February and early March likely contributed to weaker sentiment as did concerns about disruption in the U.S. banking sector. Although producers still cite high input costs as their top concern for their farm operations in the upcoming year, they are becoming more worried about rising interest rates and the impact those higher rates will have on their operations. Farmers are becoming less confident that farmland values will continue to rise in the short run with one out of five producers saying they expect values to weaken in the next 12 months. Producers’ longer-term farmland outlook remains more positive than in the short-run, although the percentage of farmers who expect farmland values to weaken over the next five years is up compared to this time last year and two years ago. Finally, the vast majority (88%) of producers surveyed this month expect growth in the renewable diesel industry to boost soybean prices in the next five years with 21% of respondents expecting a soybean price rise of $1.00 or more per bushel.