


Producer sentiment inches up despite commodity price decline and continued trade war concerns
James Mintert & Michael Langemeier
Ag producer sentiment improved slightly during June as the Ag Economy Barometer index rose to a reading of 143 compared to 141 a month earlier. The modest rise in the Ag Economy Barometer, which is based on a nationwide survey of 400 U.S. agricultural producers each month, was underpinned by a rise in the Index of Current Conditions, which rose to 138 compared to a reading of 132 a month earlier. The Index of Future Expectations was essentially unchanged with a reading of 146 in June vs. 145 in May.
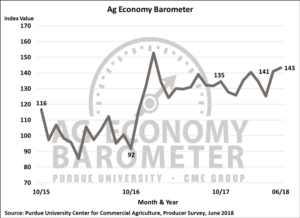
Figure 1. Purdue/CME Group Ag Economy Barometer, October 2015-June 2018.
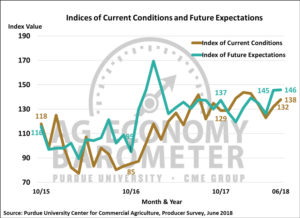
Figure 2. Indices of Current Conditions and Future Expectations, October 2015-June 2018.
Sentiment Rises Despite Collapse in Crop Prices
The modest uptick in sentiment was surprising given the collapse in prices for key agricultural commodities that took place recently. For example, futures prices for corn, wheat and soybeans reached short-term peaks in late May and drifted downward in early June before dropping sharply in mid-June when it became increasingly likely that the trade war with China would not be resolved before tariffs are imposed. Concerns about the potential for reduced exports to China were exacerbated by improving U.S. crop conditions for both corn and soybeans, pushing yield and U.S. production expectations higher. By the time the June sentiment survey was complete, nearby corn futures were down over 10 percent, nearby wheat futures prices were down 7 percent and nearby soybean futures prices were down 12 percent, all compared to their late May closing prices.
Uncertainty About Outlook Among Producers Increases
The small change in the Ag Economy Barometer compared to a month earlier masks the tremendous amount of uncertainty about future conditions that exists among U.S. producers. One example of the uncertainty is the change in the percentage of producers that are expecting good and bad times in U.S. agriculture over the next year. The percentage of respondents expecting good times in U.S. agriculture during the year ahead declined from 32 percent in May to 26 percent in June, suggesting an erosion in producers’ optimism. But at the same time, the percentage of producers expecting bad times declined from 54 percent in May to 46 percent in June. Similarly, when asked to look ahead five years the percentage of producers expecting good times in U.S. agriculture declined from 51 percent in May to 45 percent in June, whereas those expecting bad times actually fell from 38 percent in May to 31 percent in June. Examining responses to both the one-year ahead and five-year ahead questions, the biggest shift among respondents was away from answering “good times” or “bad times” to “neutral”, suggesting what was really taking place was a rise in uncertainty about the outlook for U.S. agriculture.
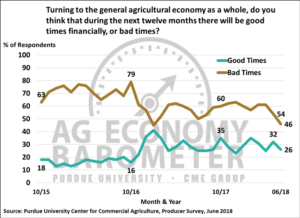
Figure 3. Percentage of producers expecting good times and bad times in the U.S. agricultural economy over the next 12 months, October 2015-June 2018.
Differences among producers with respect to their expectations for commodity prices helps explain some of the variation in their outlook. Several times throughout the year, we ask producers if they expect prices for key commodities to move higher, lower or remain unchanged over the next 12 months. Compared to earlier in the year, there was a sizable increase in the percentage of producers expecting corn, wheat, and especially soybean prices to head lower over the next 12 months on the June survey. For example, in June nearly 30 percent of respondents expected soybean prices to decline over the next year vs. 27 percent in April and just 15 percent back in January. However, at the same time there was also an increase in the percentage of producers expecting higher prices. Compared to earlier in the year, the percentage of producers expecting higher soybean prices in the year ahead rose to 25 percent on the June survey compared to 20 percent in April and 18 percent in January. Finally, although the recent sharp decline in crop prices caught many observers by surprise, it was not completely unexpected by producers. On the April survey, 53 percent of producers said they expected to see July 2018 CBOT soybean futures trade below $9.50 per bushel and 45 percent of respondents said they expected to see July 2018 corn futures trade below $3.50 per bushel. Those expectations were met in June.
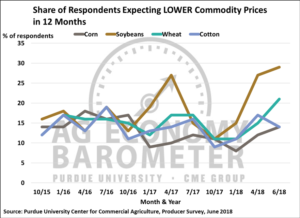
Figure 4. Percentage of producers expecting lower crop prices in the year ahead, October 2015-June 2018.
Replacement Needs Driving Large Farm Investments
Each month we ask producers whether now is a good or a bad time to make large farm investments. The percentage of producers indicating it’s a bad time for large farm investments has been trending lower since October 2016, falling to 60 percent in June compared to 67 percent a month earlier. However, it is also worth noting that the percentage of producers indicating that it is a good time for large farm investments dropped to 26 percent, down slightly compared to a month earlier and 8 percentage points below its most recent peak of 34 percent in February 2018. Responding to an additional question on the June survey, 13 percent of respondents indicated they actually plan to make a large investment on their farm this year. To learn more about their plans, we asked those that plan on investing their motivation for their investment. Over half of respondents said it was because a building or piece of equipment needed to be replaced. Farm expansion was cited by 18 percent of respondents as a reason for investing and 10 percent said it was to reduce their tax liabilities, whereas just over one out of five respondents cited “other” as the reason for making a large investment in their farm operation this year.
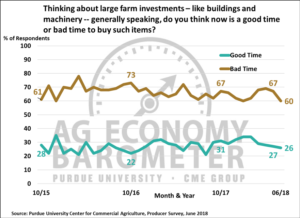
Figure 5. Large farm investments, is now a good time or a bad time to buy such items, October 2015-June 2018.
Growth in Crop Farm Acreage
Farm operations continue to grow in size and to learn more about growth that actually took place this year, survey respondents were asked by how much their crop acreage changed in 2018 compared to 2017. Not surprisingly, over three-fourths of the producers said there was no change in the acreage their farm is operating this year compared to last. However, 8 percent of respondents said the acreage they operated increased by 10 percent or more and 6 percent of producers in the survey said their acreage increased up to 10 percent. When the same question was posed with respect to planned acreage changes for 2019, 86 percent of respondents said they did not anticipate any change in their crop acreage. However, 3 percent of the producers plan a crop acreage increase of 10 percent or more while 6 percent plan to increase their crop acreage up to 10 percent in 2019 compared to 2018.
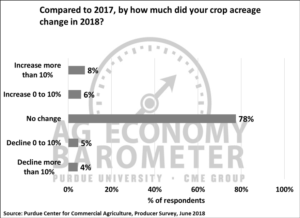
Figure 6. How much did your crop acreage change in 2018 compared to 2017, June 2018.
Flexible Cash Rent Lease Usage and Terms
To expand their crop acreage, many farm’s rent cropland. Just under half (48 percent) of all respondents (regardless of their primary enterprise) on the June survey said they expect to rent cropland in 2019. Flexible cash rent leases have been promoted as a way for farm operations to share some risk with land owners, while also providing landowners some of the stability that comes with a cash rental agreement. Among the farm operations that indicated they rent crop land, 36 percent said they expect to use a flexible cash rent lease in the upcoming year. Operations that expect to use a flexible cash rent lease in the upcoming year were asked what variable is used to determine the final payment to the land owner. Choices provided on the survey were 1) price, 2) yield, 3) revenue and 4) other. The most common response was revenue with 34 percent of producers flexing their final rental payment based on revenue. Close behind revenue as a variable to determine the final rental payment was commodity price (28 percent) followed by yield (16 percent). Finally, 22 percent of respondents indicated their cropland rental arrangement would flex on something other than just revenue, price or yield.
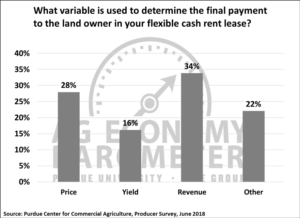
Figure 7. What variable is used to determine the final payment to the land owner in your flexible cash rent lease?, June 2018.
Wrapping Up
Ag producer sentiment rose modestly in June compared to a month earlier, driven primarily by an improvement in producers perception of current economic conditions. The improvement in sentiment was surprising given that prices for key commodities, including corn, wheat and, especially, soybeans declined sharply during June. Close examination of producers’ responses indicates that, although the Ag Economy Barometer did increase slightly in June compared to May, it occurred as uncertainty about the future rose sharply among U.S. agricultural producers. When queried about future growth plans for their farm’s crop acreage, most respondents do not expect to increase their acreage next year, but 3 percent of respondents expect rapid growth (more than 10 percent) and 6 percent expect modest growth (up to 10 percent) to take place. Finally, among the farms that rent cropland, over one-third said they expect to use a flexible cash-rent lease in the year ahead on some of their acreage. The variable used to determine the final rental payments on these flexible cash-rent leases varied with about one-third of the leases using revenue, just over one-fourth using commodity price and less than one out of five using crop yield.