


Expectations for improved trade with China sends farmer sentiment soaring
James Mintert and Michael Langemeier, Center for Commercial Agriculture
James Mintert and gives his breakdown on the Purdue/CME Group Ag Economy Barometer January results at purdue.ag/barometervideo.
Download report (pdf)
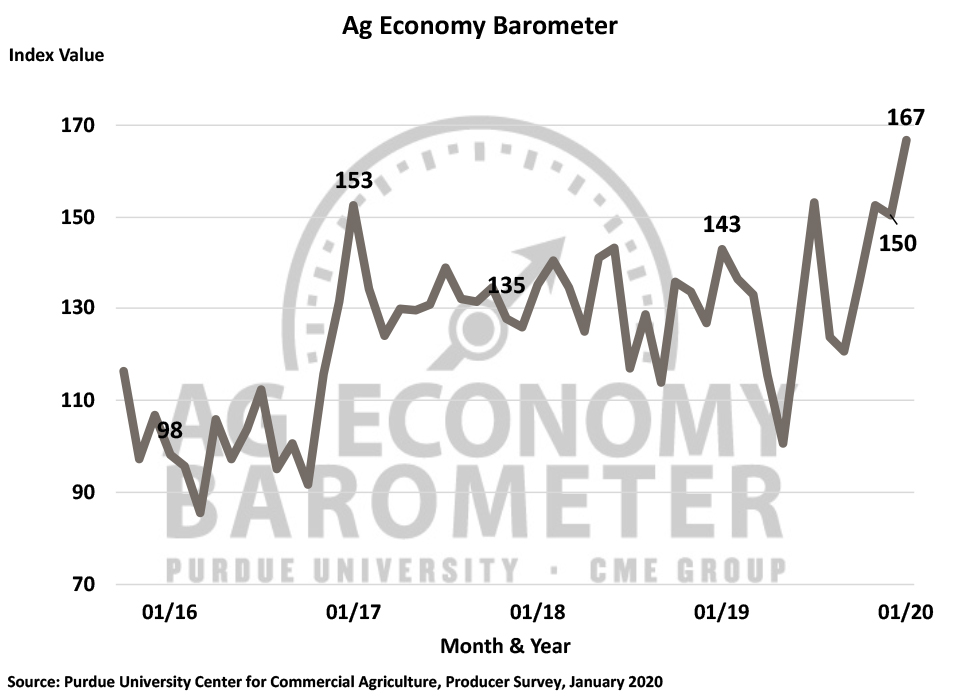
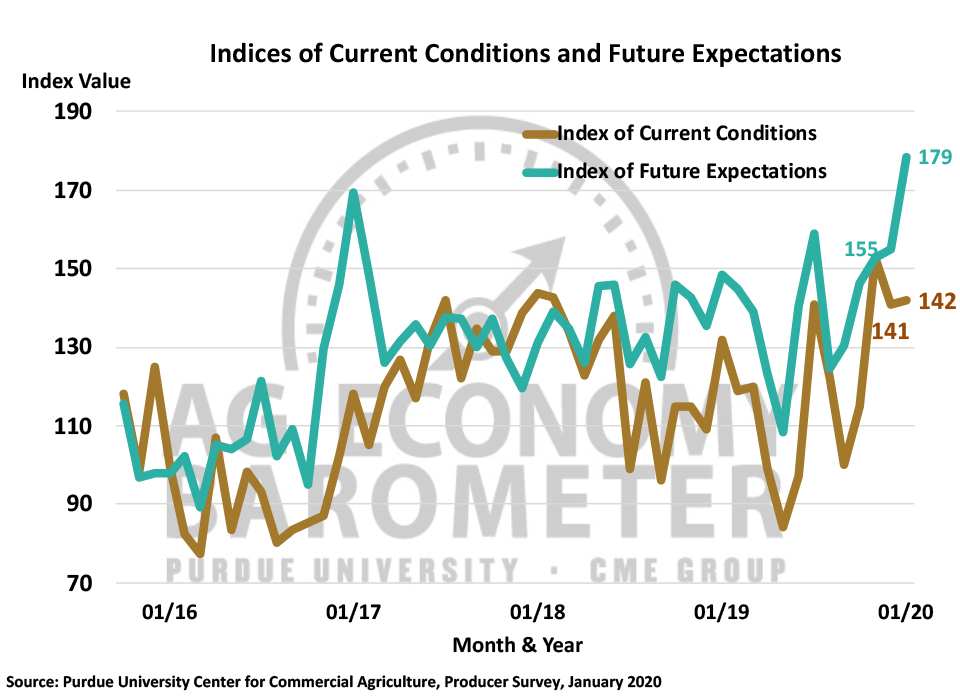
The Ag Economy Barometer rose to a reading of 167 in January, a 17-point jump from December when the index stood at 150. Virtually all of the rise in this month’s barometer was attributable to a sharp rise in optimism about future conditions in agriculture. The Index of Future Expectations climbed 24 points to 179, while the Index of Current Conditions at 142 was essentially unchanged from the December reading of 141. This month’s Ag Economy Barometer survey, which is based on responses from a nationwide survey of 400 agricultural producers, was conducted from January 13-17, 2020. The sharp improvement in future expectations coincided with President Trump’s signing of the Phase One Trade Agreement between the U.S. and China on January 15th. In the agreement, China agreed to increase purchases of U.S. manufacturing, energy, and agricultural goods and services by at least $200 billion over two years, but it did not include specific information regarding which U.S. goods and services would benefit from the purchases.
Agricultural producers have become noticeably more optimistic about the future of agricultural trade over the last several months. As recently as October, just 55 percent of the farmers in our survey said they expect to see U.S. ag exports increase over the next 5 years. That changed in November and continued through the January survey as 70 to 71 percent of survey respondents said they expect to see ag exports rise in the upcoming years. At the same time, the percentage of producers with a pessimistic ag export outlook declined, as just 4 percent of respondents in January said they expect to see an export decline. That represents a shift from late summer when 10 to 12 percent of producers in our survey said they expect exports to decline over the next five years.
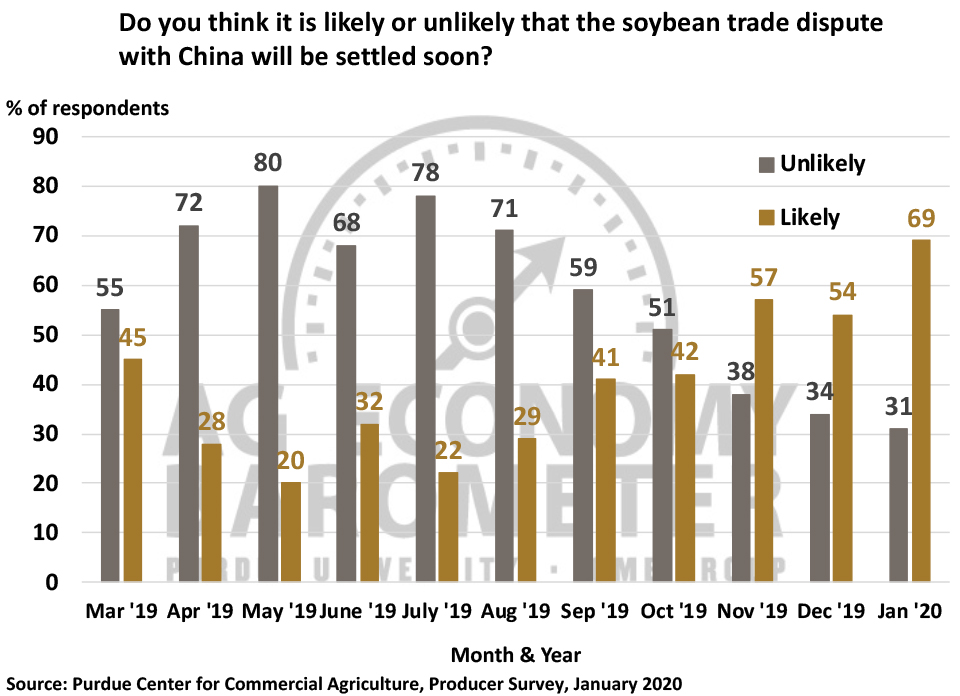
Part of the improvement in farmers’ trade outlook can be traced to a shift in their expectations regarding the trade dispute with China. Although the Phase One Trade Agreement with China did not explicitly address the soybean trade dispute, the percentage of farmers who expect the soybean trade dispute to be settled soon rose to 69 percent in January from 54 percent in December. That percentage has been rising steadily since July when just 22 percent of producers said they expected a quick resolution to the soybean trade dispute. At the same time, 80 percent of farmers in January said they expect a favorable outcome to the trade dispute with China compared to 72 percent who felt that way in December.
Despite the big improvement in future expectations among farmers in our survey, the Farm Capital Investment Index in January actually fell 4 points below December’s to a reading of 68. The index is based upon a question that asks farmers whether now is a good or bad time to make large investments in things like farm machinery and buildings. The index has ranged from the high 60s to the low 70s since November and, despite the small decline in the January reading, remains much stronger than it was in late summer and early fall when it ranged from the high 40s to the high 50s.

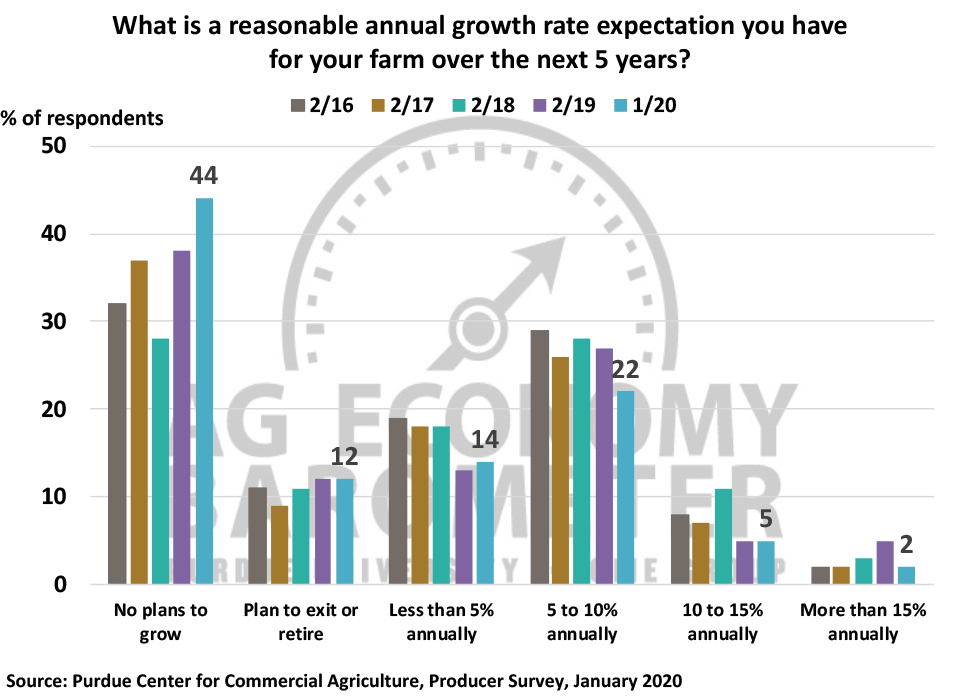
Each winter, we ask producers about future plans for their farming operation. Specifically, we ask what is a reasonable growth rate for their farming operation over the upcoming five years? Over the five years that we’ve included this question on the barometer survey, there has consistently been a small percentage of farms that plan to grow rapidly and a relatively large group who either has no plans to grow or actually plans to exit or retire from farming. That was true again this year. But what was noticeable this year was a trend in the responses with the percentage of farms that either have no plans to grow or actually plan to exit/retire from farming rising over time. For example, two years ago 28 percent of respondents said they had no plans to grow, while a year ago 38 percent of respondents said they had no plans to grow their operation. In January 2020, that percentage rose again to 44 percent of respondents. Combined, farms that either have no plans to grow or plan to exit/retire totaled 56 percent of the farms in the January 2020 survey, compared to 50 percent last year, and just 39 percent two years ago. Correspondingly, fewer farms in this year’s survey indicated that they expect to grow rapidly compared to prior years. The rise in the number of farms that don’t plan to grow could be a response to a perceived rise in risk on the part of farm operators.
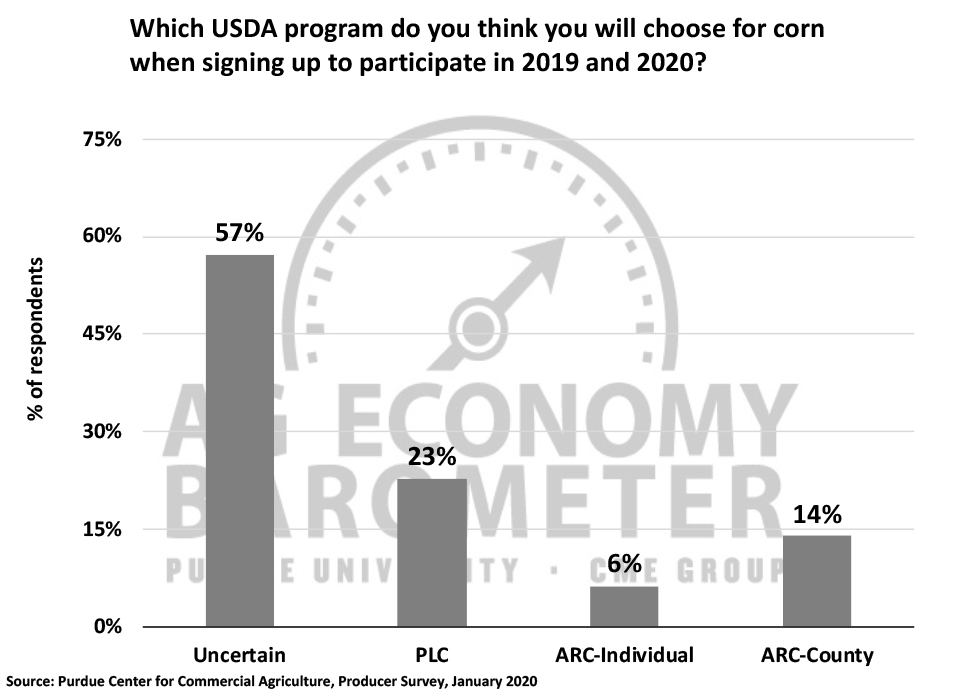
Farmers are faced with a March 15 deadline to sign-up for the USDA’s Agriculture Risk Coverage (ARC) or the Price Loss Coverage (PLC) program under the 2018 Farm Bill. This year’s sign-up is for the 2019 and 2020 crop years and farmers can choose different programs for corn or soybeans. USDA’s Farm Service Agency indicates that the vast majority of farmers have not enrolled their farms yet. To learn more about farmers’ perspective on which program might be more attractive, we asked farmer’s which program they planned to enroll in for corn for the 2019 and 2020 crop years? The majority (57 percent) of farms in our survey are still uncertain about which program they will choose. However, among the farmers who have decided, there appeared to be a shift away from the program choice made by many farmers for the 2014 Farm Bill. Under the 2014 Farm Bill, the most popular program choice among corn farmers was the ARC-County program. This month’s survey responses indicate that might not be the case for the 2018 Farm Bill sign-up. In our January survey, the PLC program was chosen by 23 percent of respondents, while 14 percent of respondents chose the ACR-County program. However, unlike in the 2014 Bill sign-up period, the ARC-Individual Coverage program appears to be a viable option for a significant number of producers as 6 percent of respondents indicated that was their preferred program choice.
Wrapping Up
Producer sentiment improved markedly in January, as the Ag Economy Barometer rose 17 points above its December reading. The improvement in farmer sentiment was attributable to a rise in optimism regarding future conditions in agriculture as the Index of Future Expectations rose 24 points from December to January, while the Index of Current Conditions was virtually unchanged compared to a month earlier. This month’s survey was conducted the week that President Trump signed the Phase One agreement with China and the rise in optimism about future conditions appeared to be motivated by expectations for improved trade with China. In January, nearly 70 percent of farmers said they expect the soybean trade dispute with China to be settled soon, up from 54 percent who felt that way in December, and 80 percent of farmers think the trade dispute will ultimately be resolved in a way that benefits U.S. agriculture. Producers increase in optimism about the future was not enough to push the Farm Capital Investment Index up. Although the investment index fell 4 points below December’s reading in January, it remained strong compared to late summer and early fall. Finally, the percentage of farm operations who have no expectations for growth in the next five years has been trending up the last couple of years and fewer farms expect to grow rapidly over the same time frame.