


Farmer Sentiment Dips Amid Weaker View of Current Conditions
James Mintert and Michael Langemeier, Purdue Center for Commercial Agriculture
A breakdown on the Purdue/CME Group Ag Economy Barometer August results can be viewed at https://purdue.ag/barometervideo. Find the audio podcast discussion for insight on this month’s sentiment at https://purdue.ag/agcast.
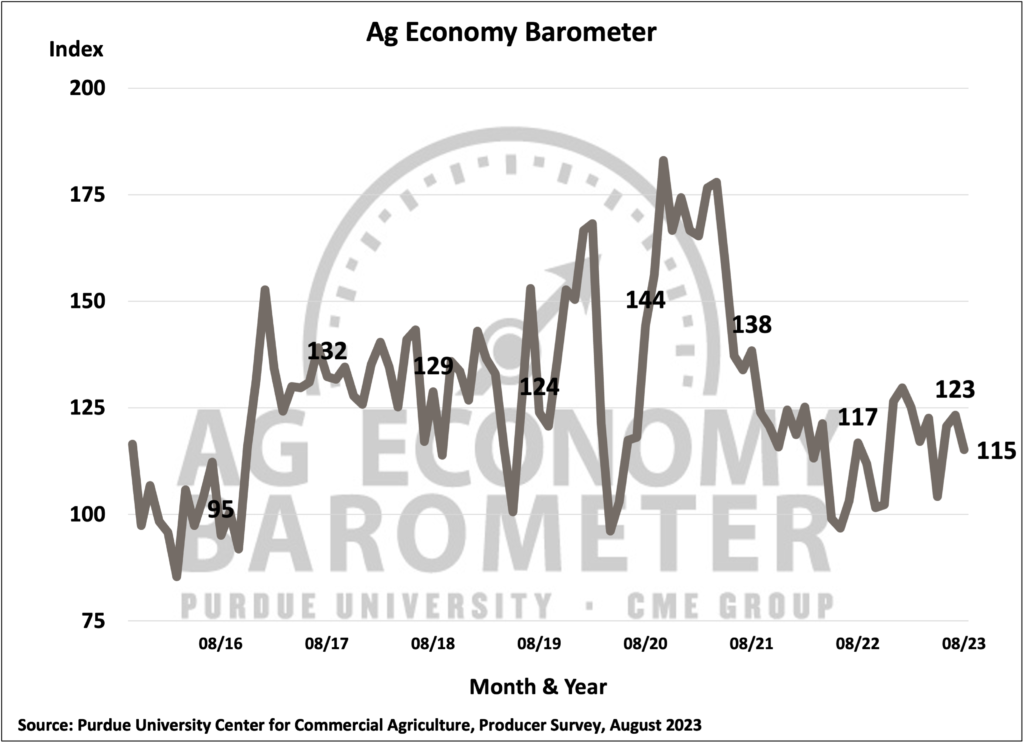
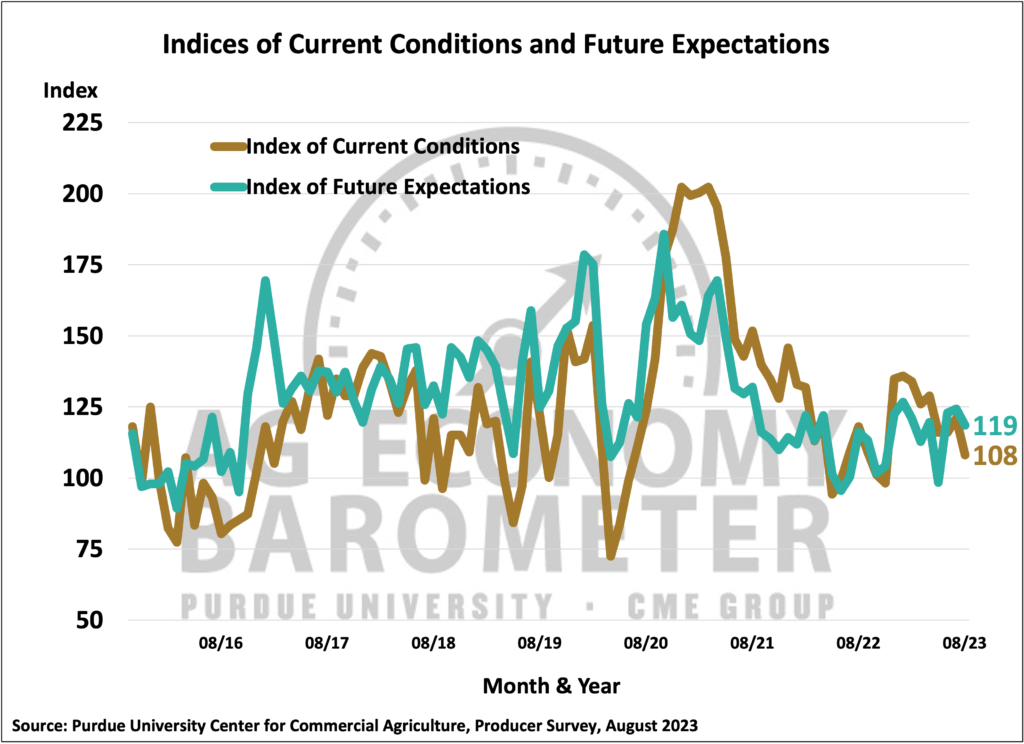
U.S. farmers’ sentiment weakened in August compared to July as the Purdue University-CME Group Ag Economy Barometer dipped 8 points to a reading of 115. This month’s decline was fueled by producers’ weaker perception of current conditions both on their farms and in U.S. agriculture as the Current Conditions Index fell 13 points to a reading of 108. The Future Expectations Index also declined in August to a reading of 119, 5 points below a month earlier. This month’s Ag Economy Barometer survey was conducted from August 14-18, 2023.
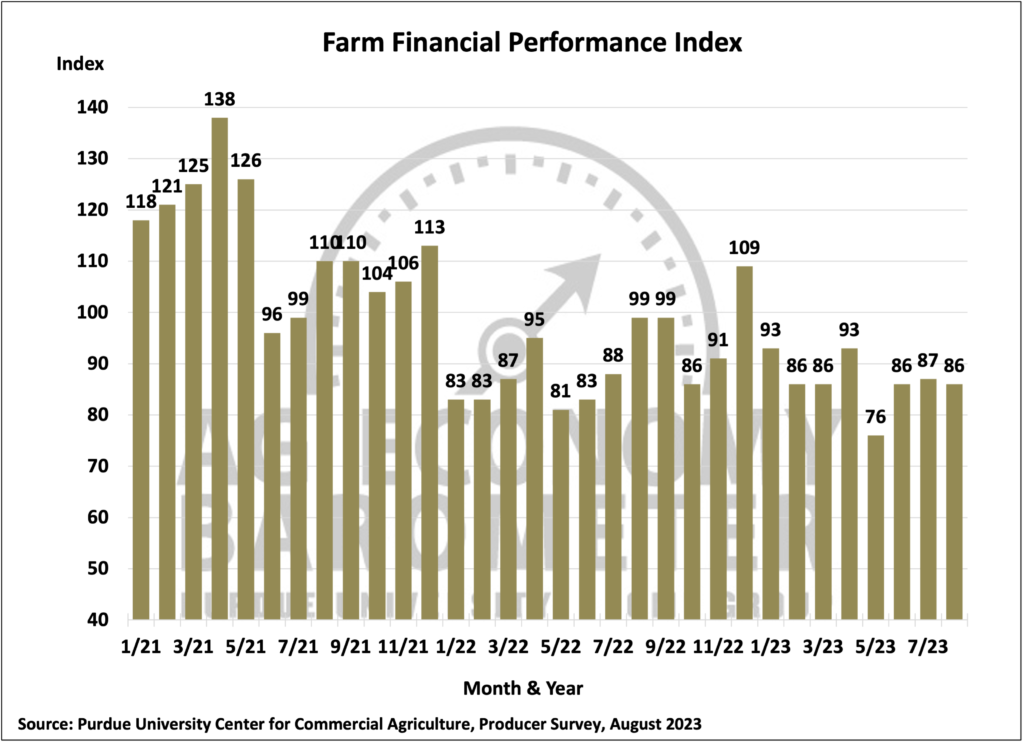
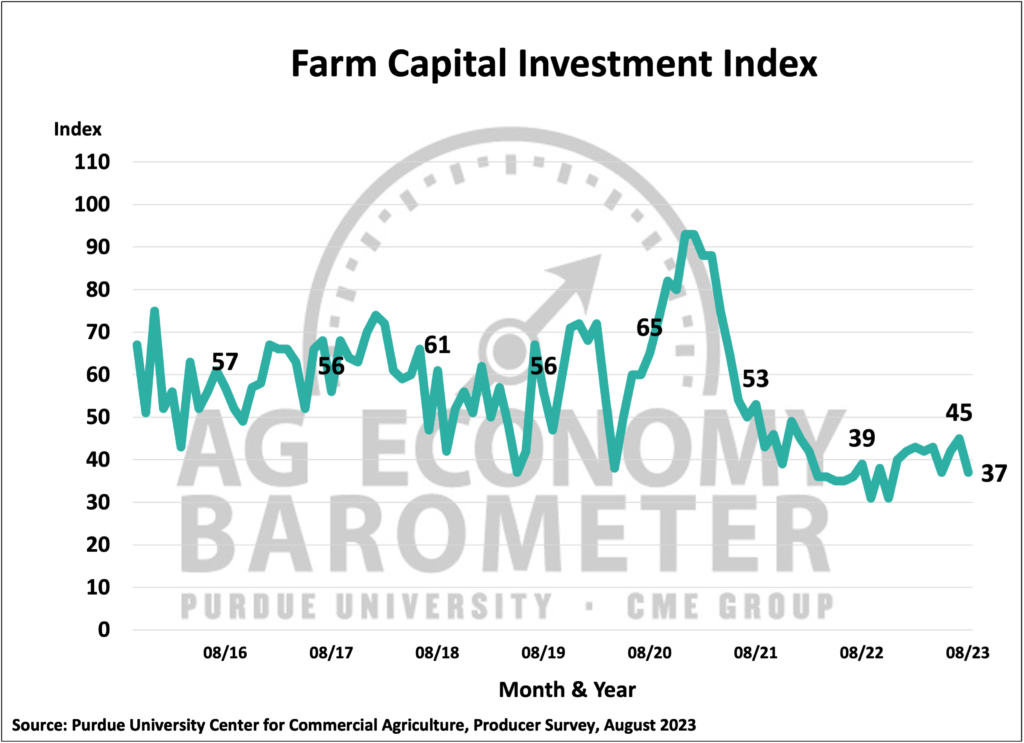
Although producer sentiment weakened in August, producers’ rating of farm financial conditions changed little this month, as the Farm Financial Performance Index declined just one point to a reading of 86. However, producers’ perspectives on farm financial conditions were noticeably weaker than a year earlier when the index stood at 99. Weaker producer sentiment this month did translate into a decline in the Farm Capital Investment Index. The investment index fell to 37, eight points lower than in July and two points lower than a year earlier. Among producers with a negative view of the investment climate, the increase in prices for farm machinery and new construction along with rising interest rates were the two most commonly cited reasons for their negative view. In a related question, over half (60%) of producers in this month’s survey said they expect interest rates to rise in the upcoming year.
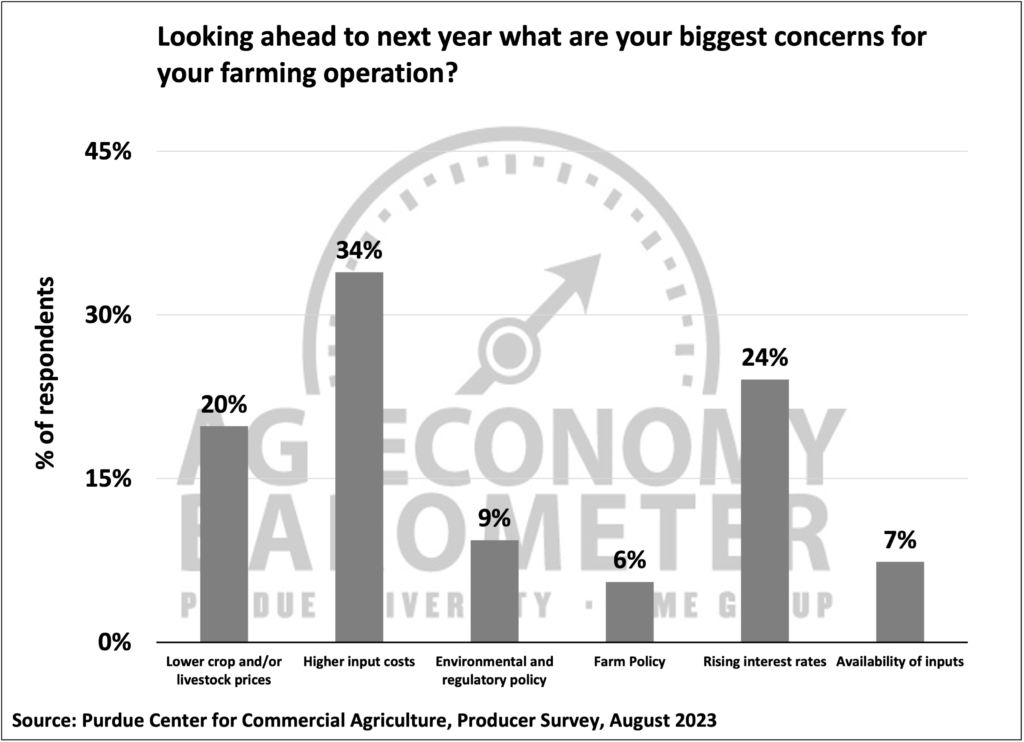
When asked about top concerns for their farming operations in the next 12 months, producers continue to point to higher input prices and rising interest rates as their top two concerns. Higher input prices was chosen by one out of three (34%) and rising interest rates was chosen by one out of four (24%) survey respondents as a top concern. Even though crop prices weakened significantly this summer, producers ranked declining commodity prices as their number three concern, chosen by one out of five (20%) producers.
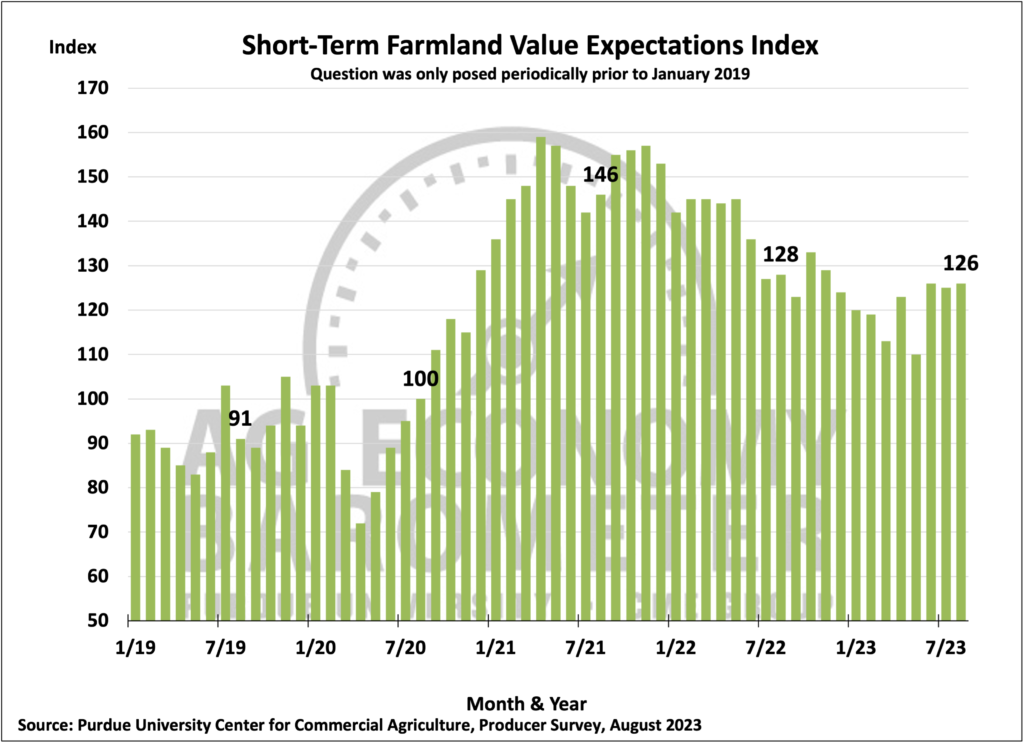
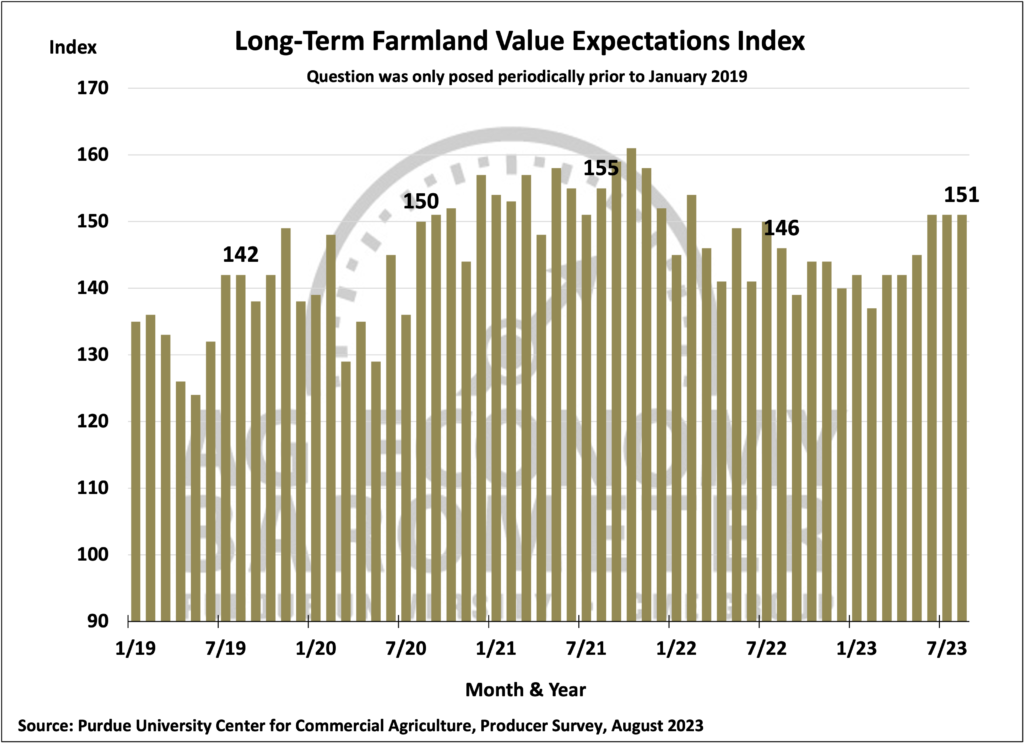
Despite increasing concerns about rising interest rates, producers remain cautiously optimistic about farmland values. This Short-Term Farmland Values Expectation Index rose one point to 126 while the long-term index was unchanged at a reading of 151. In this month’s survey, four out of ten respondents (39%) said they expect farmland values to rise over the next year while 13% said they look for values to decline in the next year. The percentage of respondents expecting values to rise in the near term has increased since May when just 29% of farmers in the survey said they expected values to rise during the upcoming year. When asked about their longer-term view of farmland values, six out of ten (63%) respondents said they expect values to rise over the next five years while 12% said they expect values to fall. The percentage of producers who held a negative five-year outlook on farmland values peaked back in February at 19%.
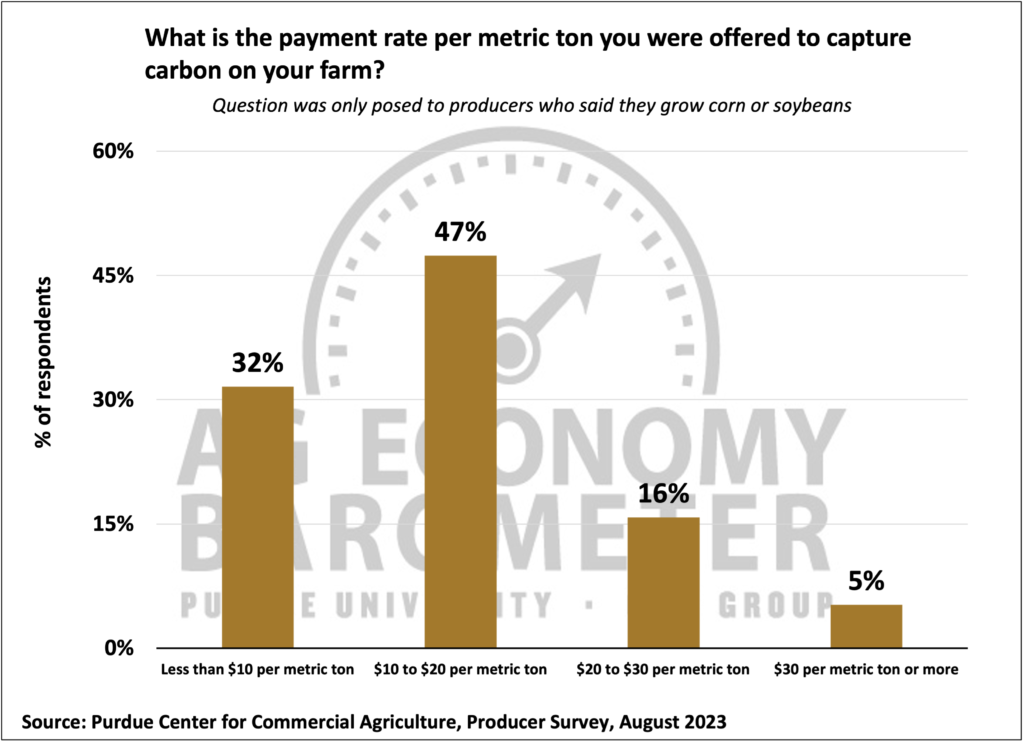
Interest about usage of carbon contracts in row-crop agriculture remains high. This month’s survey posed questions about carbon contracts to corn and soybean growers. In the August survey, 6% of corn and soybean growers said they have engaged in discussions with companies about receiving payments to capture carbon on their farms, while just 2% said they had signed a carbon contract. Nearly half (47%) of the farms who discussed contract terms with a company said they were offered a payment rate of $10 to $20 per metric ton of carbon captured. Among the farms who engaged in discussions but chose not to sign a carbon contract, half of them said it was because the payment level was too low.
Wrapping Up
Farmer sentiment dipped in August with farmers weakening perception of current conditions on their farms providing the impetus for weaker sentiment. Although farmers reported little change in their farms’ financial condition compared to a month earlier, conditions were reported to be weaker than a year earlier. Six out of ten farmers in this month’s survey said they expect interest rates to rise over the next year which, along with rising prices for farm machinery and new construction, was cited as a reason for a weaker investment climate. Despite concerns about rising interest rates, producers remain cautiously optimistic about farmland values in both the short-run and longer-term.