


Farmer Sentiment Dips in February
James Mintert and Michael Langemeier, Purdue Center for Commercial Agriculture
A breakdown on the Purdue/CME Group Ag Economy Barometer February results can be viewed at https://purdue.ag/barometervideo. Find the audio podcast discussion for insight on this month’s sentiment at https://purdue.ag/agcast.
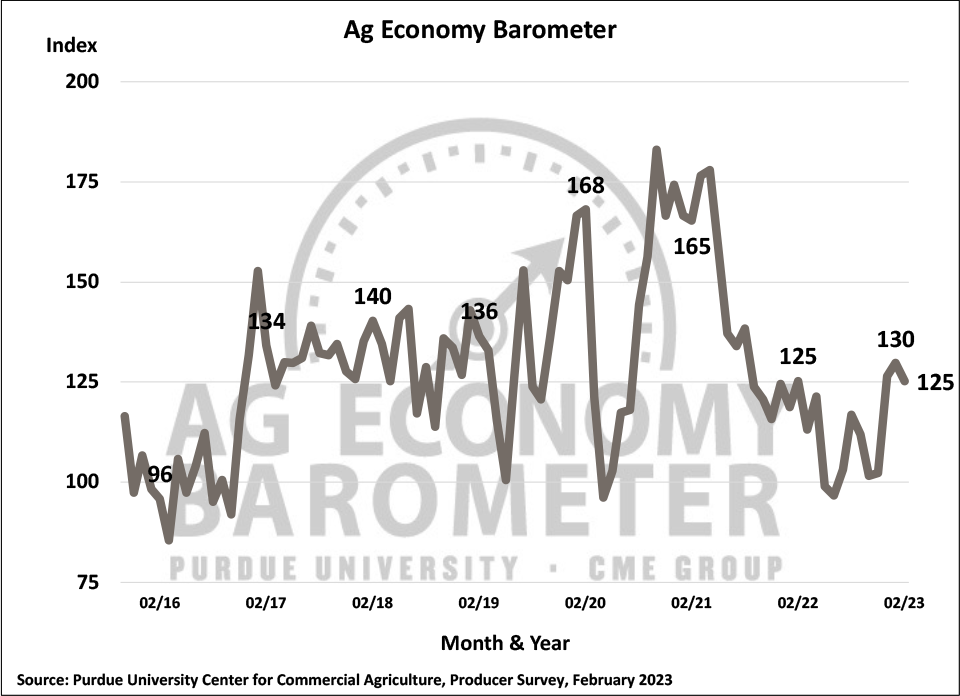
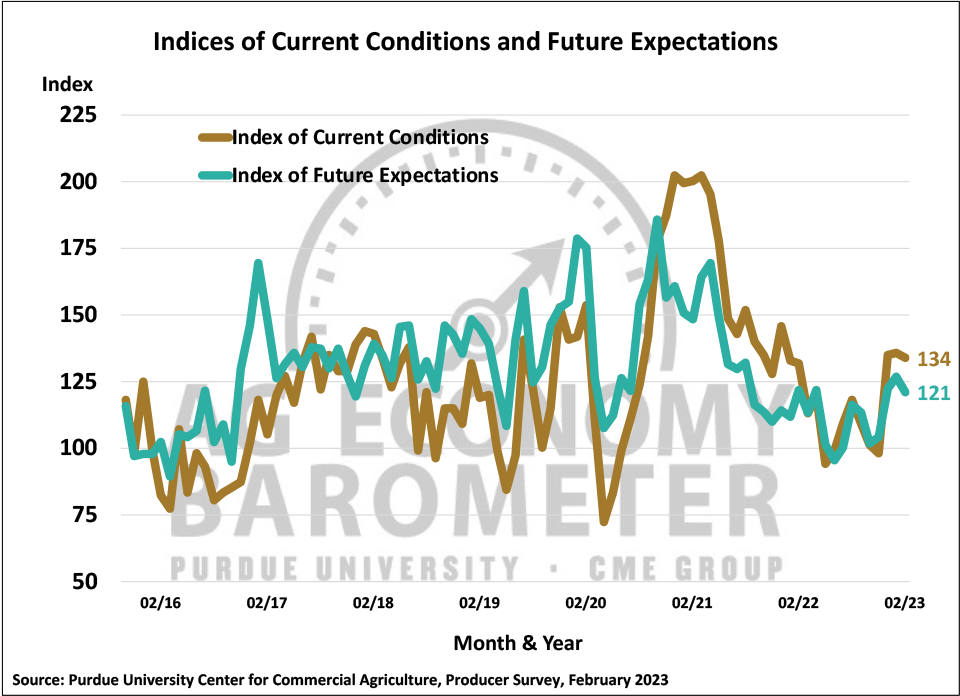
The Purdue University-CME Group Ag Economy Barometer Index dipped 5 points in February to a reading of 125. Farmers’ perspectives regarding both current conditions on their farms and their expectations for the future both weakened slightly as the Index of Current Conditions fell 2 points to 134 and the Index of Future Expectationsdeclined to 121 compared to 127 in January. This month’s survey revealed that producers’ confidence in the future growth of U.S. agricultural exports continues to weaken. In addition, although both land value expectation indices remain in positive territory, more producers think farmland values could weaken in the year ahead than on previous surveys. The Purdue University-CME Group Ag Economy Barometer sentiment index is calculated each month from 400 U.S. agricultural producers’ responses to a telephone survey. This month’s survey was conducted from February 13-17, 2023.
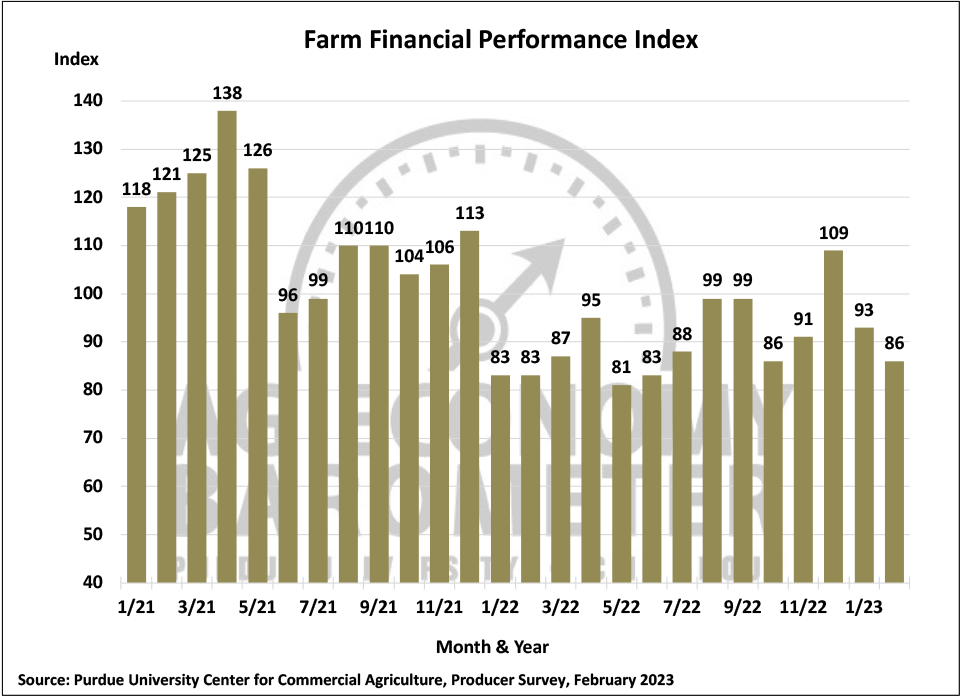
Producers’ expectations for their farms’ financial performance in 2023 compared to 2022 weakened in February. The Farm Financial Performance Index declined 7 points to a reading of 86. Farmers continue to point to concerns about higher input costs, chosen by 38% of February’s survey respondents, as their biggest concern for the year ahead. Notably, in this month’s survey more producers said they are concerned about the risk of lower crop and/or livestock prices than just a few months ago. Eighteen percent of this month’s respondents chose lower output prices as one of the top risks they are facing, up from just 8 percent who cited that as a key risk in September. Concerns about rising interest rates appear to be on an upswing as well. In February, nearly one-fourth of survey respondents (24%) chose rising interest rates as a key concern, up from 22% in the last two months and up from just 14% who cited interest rates as a top concern last summer.
Agricultural exports have been a key source of growth for U.S. agriculture for decades. Monthly Ag Economy Barometer surveys since the beginning of 2019 have routinely included a question asking producers about their expectations for agricultural exports in the upcoming 5 years. Producer’s confidence in U.S. agriculture’s exporting prowess has weakened considerably since this question was first included in barometer surveys. Confidence in agricultural exports increasing peaked in 2020 barometer surveys when just over 70% of respondents said they expected exports to increase in the upcoming 5 years. Since then, the percentage of farmers looking for exports to grow over time has drifted lower, dipping to just 33% in the February survey. And in this month’s survey, the percentage of respondents who expect U.S. exports to decline reached 18%, providing the weakest perspective on future exports since barometer data collection began, suggesting that lack of confidence in future agricultural export growth is contributing to the weak sentiment among producers.
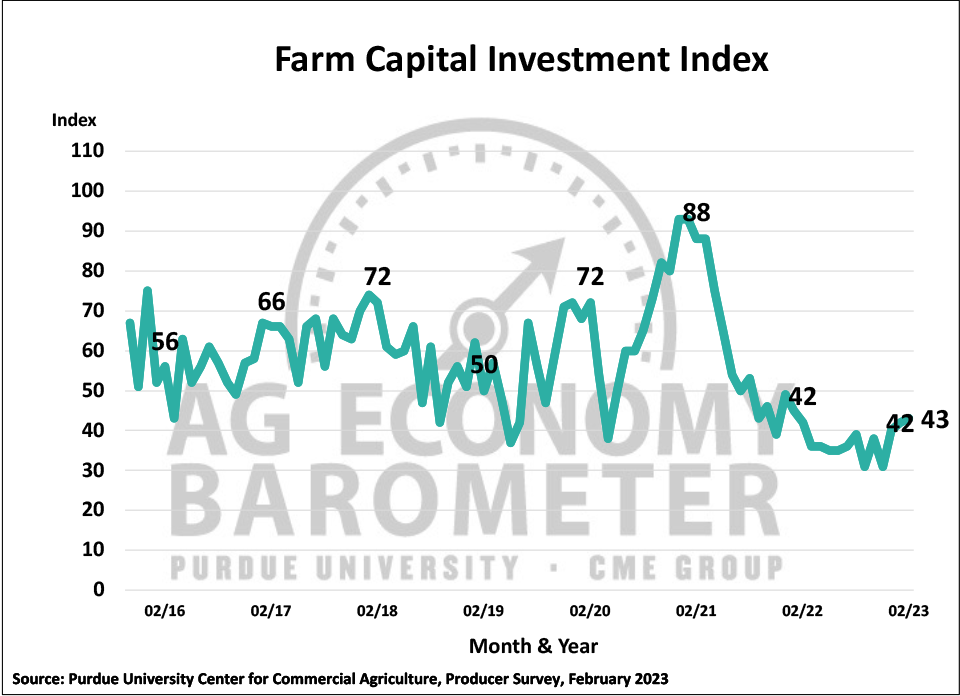
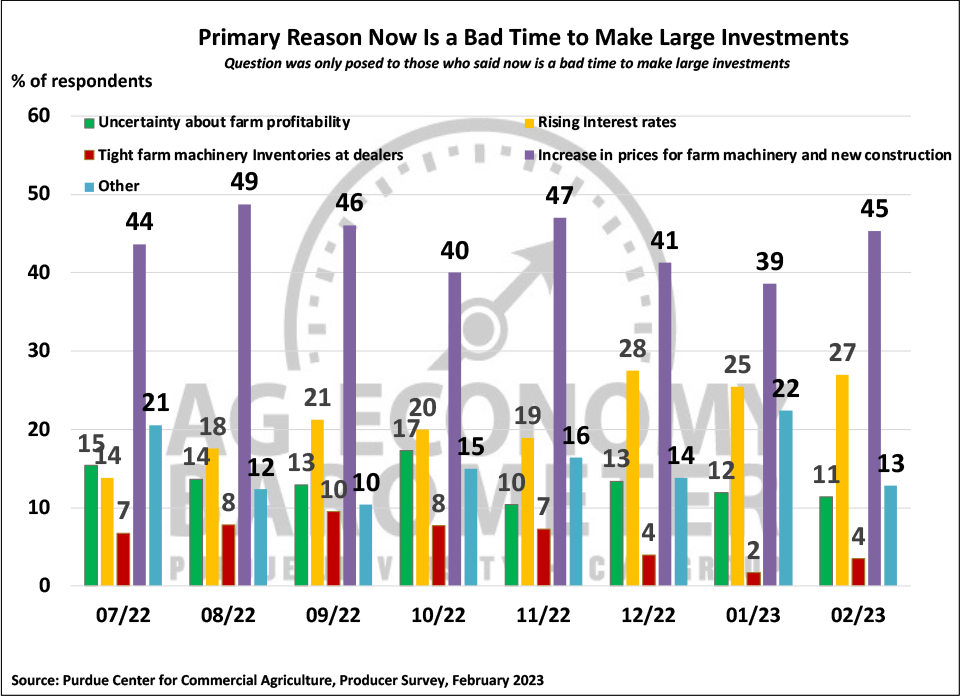
The February reading of the Farm Capital Investment Index changed little this month, rising to 43, just one point higher than a month earlier. Weak capital investment readings have been the norm for nearly two years, despite strong farm income. Seventy-two percent of producers in this month’s survey said it is a “bad time” to make large investments in their farming operation while just 15% reported it is a “good time” to make such investments. The disparity between responses to the barometer’s investment question and actual farm equipment sales continues to be focused on costs. In February, 45% of respondents who said it was a “bad time” to make large investments said it was because of the increase in prices for farm machinery and new construction while 27% of respondents chose “rising interest rates” as a primary reason for it being a poor time for making large investments. The percentage of respondents focused on rising interest rates as a key reason has doubled since last July when this question was first included in a barometer survey.
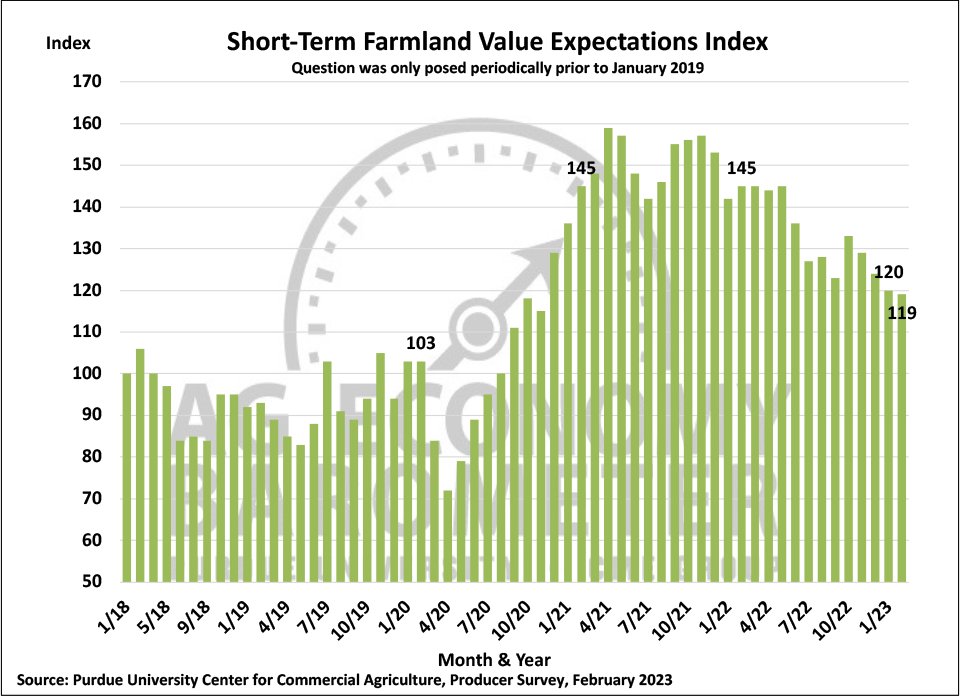
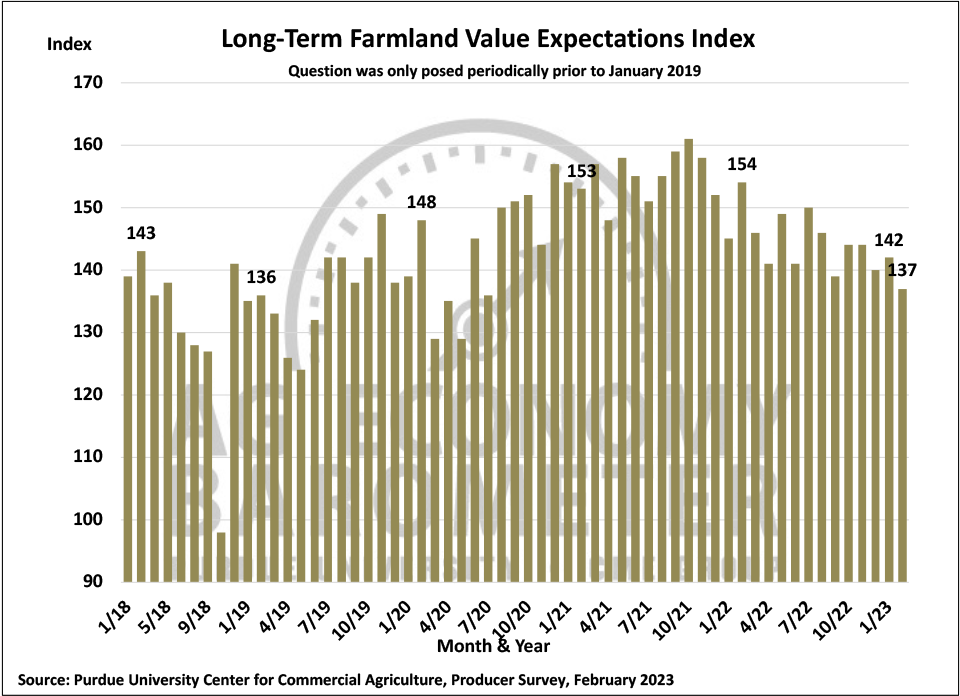
Both the short and long-term farmland value indices weakened in February. The Short-Term Farmland Value Indexdeclined one point to 119 while the Long-Term Farmland Value Index dropped 5 points to 137. Although both indices remain above 100, indicating a positive outlook on farmland values, the percentage of producers who said they expect values to decline over the next 5 years reached 19% this month, the highest percentage since this question was first routinely included in barometer surveys in 2019. Still, over half (56%) of respondents expect values 5 years from now to be higher than today. This month just 33% of respondents said they expect values to rise in the next 12 months while 14% said they expect values to weaken.
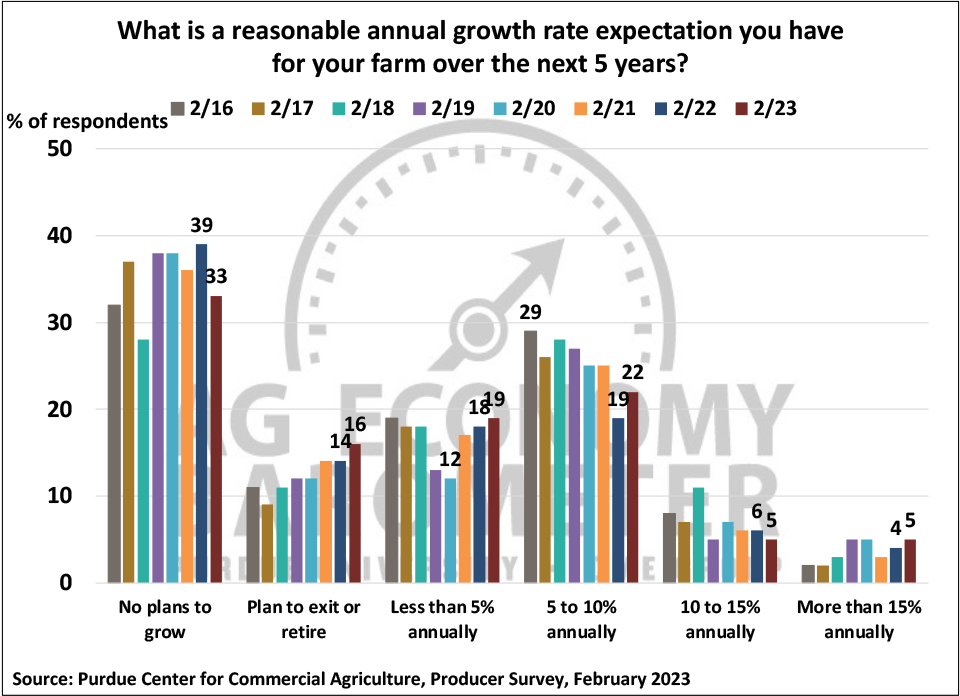
Each year in February, the barometer survey includes a question focused on farm growth, asking respondents what annual growth rate they expect for their farm over the next 5 years. This year 49% of the survey respondents said their farm either had “No plans to grow” (33%) or “Plan to exit or retire” (16%). There was very little change in the percentage of farms choosing a growth rate of “Less than 5% annually”, totaling 19% of respondents this year vs. 18% a year ago. However, the percentage of farms in the under 5% growth category has risen since 2020 when just 12% of respondents were in this group. The percentage of farms in the rapid growth category of 5 to 10% annual growth rose this year to 22%, reversing a longer-term decline for this group. For comparison purposes, in 2016 29% of farms in the barometer survey said they expected growth of 5 to 10% annually. The percentage of farms in this group has trended down since 2016, bottoming out in 2022 at 19%. It remains to be seen if this is a trend reversal or a one-year aberration.
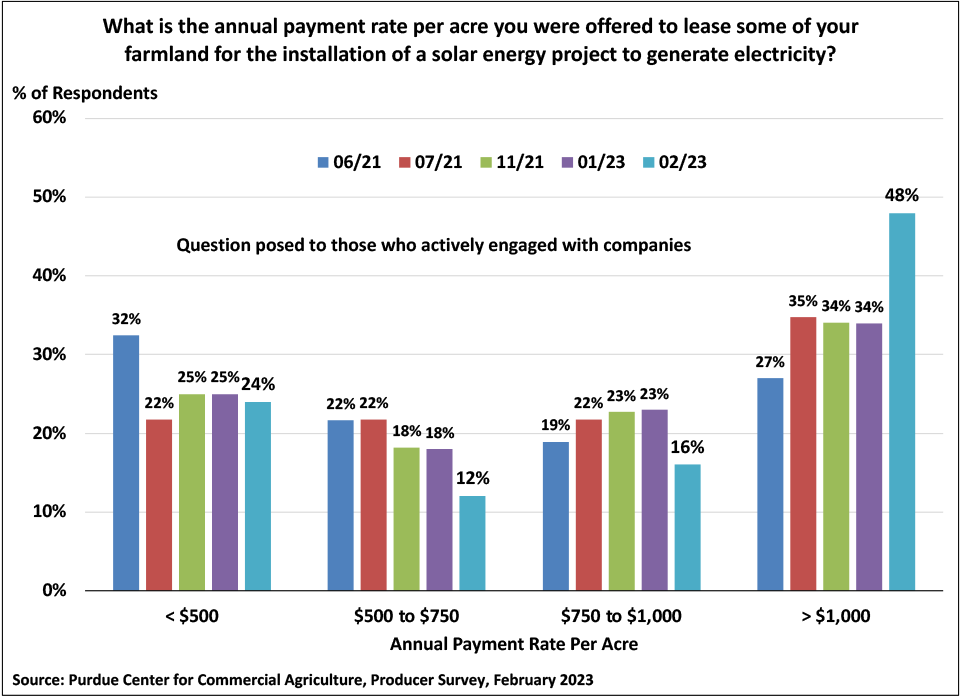
Leasing of farmland for solar energy production is a hot topic in many parts of the U.S. Barometer surveys have periodically included questions about solar leasing dating back to late spring 2021. Both the January and February 2023 surveys asked respondents if they have engaged in discussions with companies about leasing farmland for solar energy production. Across those two most recent surveys, just over 10% of respondents said they had discussed a solar lease with a company. Each time we’ve surveyed farmers about solar leases, the survey also included a question about the annual lease payment offered by solar companies. This month’s survey suggests companies have started to increase lease rates they are willing to pay. In February, nearly half (48%) of respondents who discussed solar leasing with a company reported that they were offered a lease rate above $1,000 per acre. In prior surveys the percentage of respondents who reported a lease rate this high ranged from a low of 27% to a high of 35%. At the same time, the percentage of farmers reporting lease rates of $500 up to $1,000 per acre fell substantially in February compared to prior surveys.
Wrapping Up
Farmer sentiment weakened in February as producers continue to be concerned about high input costs and, increasingly, the risk of declining output prices and rising interest rates. Longer term, the percentage of producers who expect to see U.S. agricultural exports rise has been declining for some time and reached a new low this month. Although both the long-term and short-term farmland value indices remain in positive territory, the percentage of producers who expect farmland values to fall in the upcoming year has been rising, reaching a life-of-survey peak in February. In the two most recent barometer surveys approximately 10% of farms reported having solar leasing discussions with companies and, in February, nearly half of them said they were offered an annual lease rate of over $1,000 per acre.