


Farmer Sentiment Drifts Lower on Weaker Future Expectations
James Mintert and Michael Langemeier, Purdue Center for Commercial Agriculture
A breakdown on the Purdue/CME Group Ag Economy Barometer June results can be viewed at https://purdue.ag/barometervideo. Find the audio podcast discussion for insight on this month’s sentiment at https://purdue.ag/agcast.
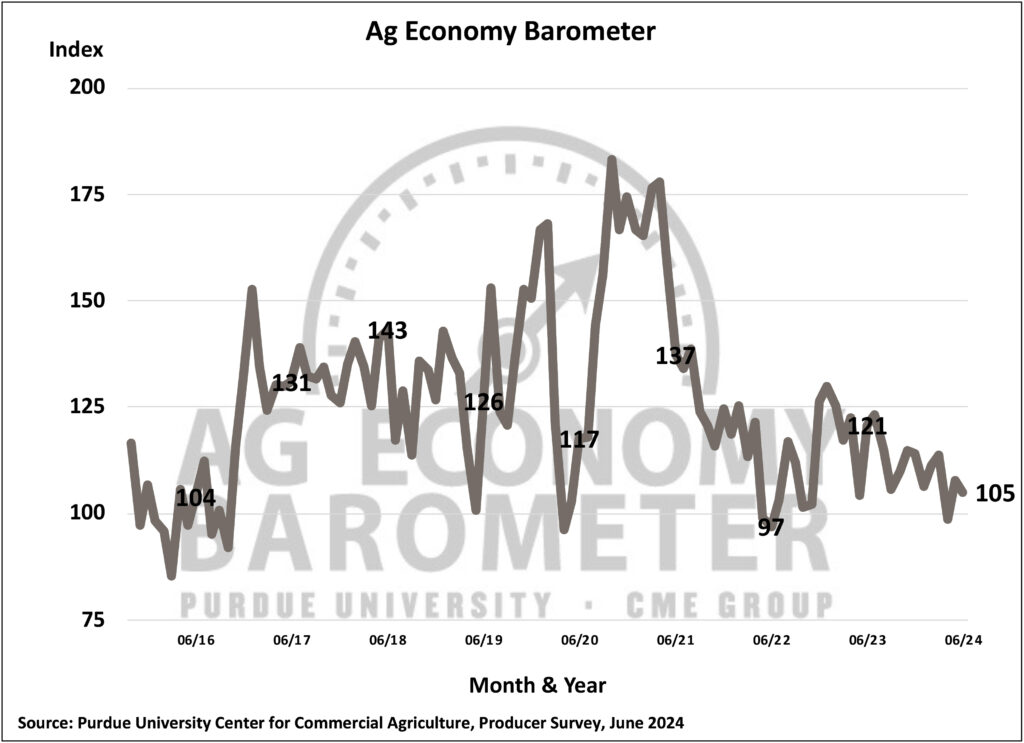
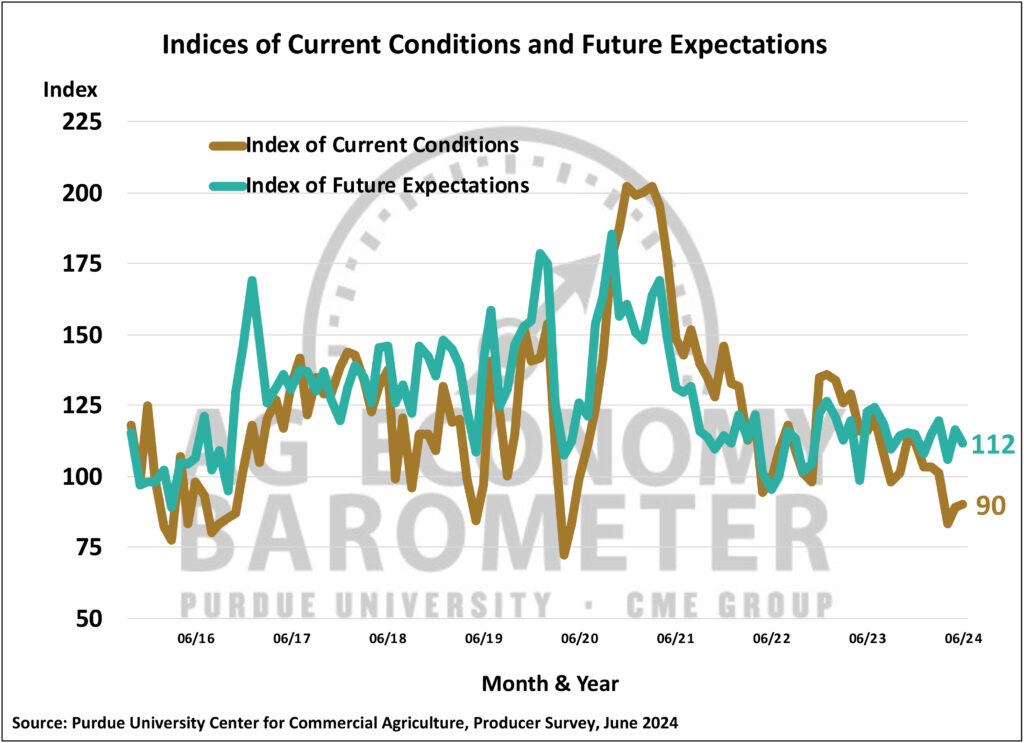
Farmer sentiment drifted lower in June as the Purdue University-CME Group Ag Economy Barometer reading of 105 was 3 points lower than a month earlier. A five-point decline in the Index of Future Expectations to 112 was responsible for the overall sentiment decline, as the June Current Conditions Index of 90 was one point above the May index value. High input costs and the risk of lower prices for the products they produce continue to weigh on farmer sentiment, along with concerns about rising interest rates. This month’s Ag Economy Barometer survey was conducted from June 17-21, 2024.
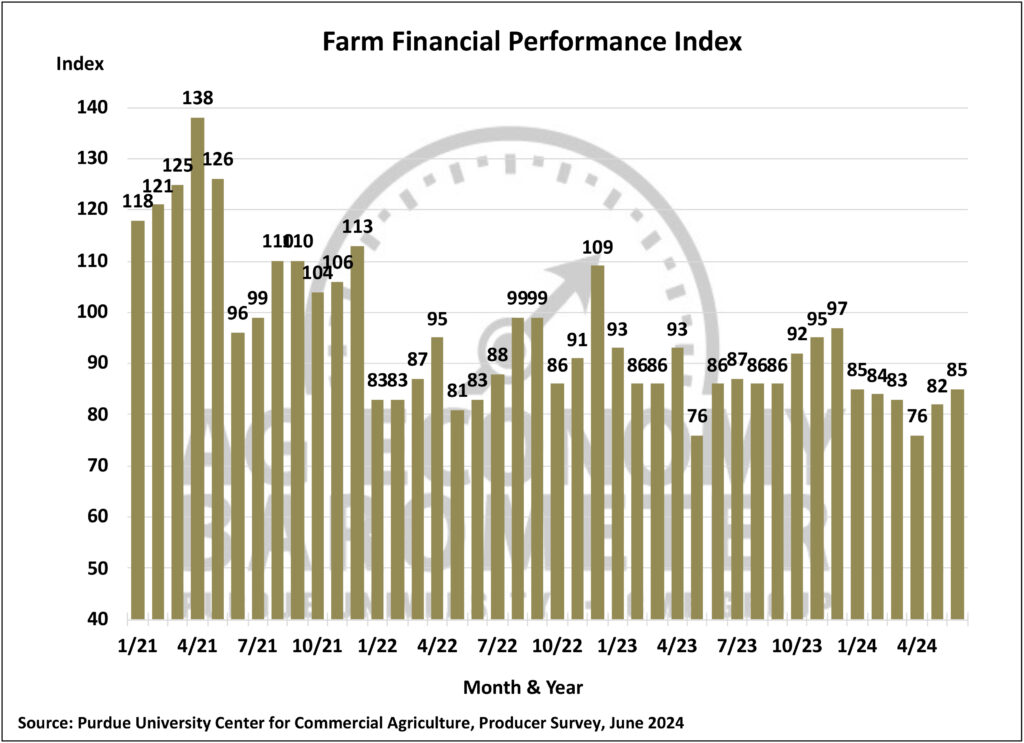
The Farm Financial Performance Index rose three points in June to a reading of 85. There’s been a tendency in recent years for producers’ financial performance expectations to bottom out in spring and improve as the spring crop growing season progresses. This year seems to be following that pattern as the index has risen 9 points over the last two months. Last year, producers’ farm financial expectations improved from spring into summer and then again from summer into fall. The index’s improvement in 2023 was driven by improving revenue expectations arising from good crop yields and a fall price rally. It remains to be seen if those conditions will be repeated in 2024.
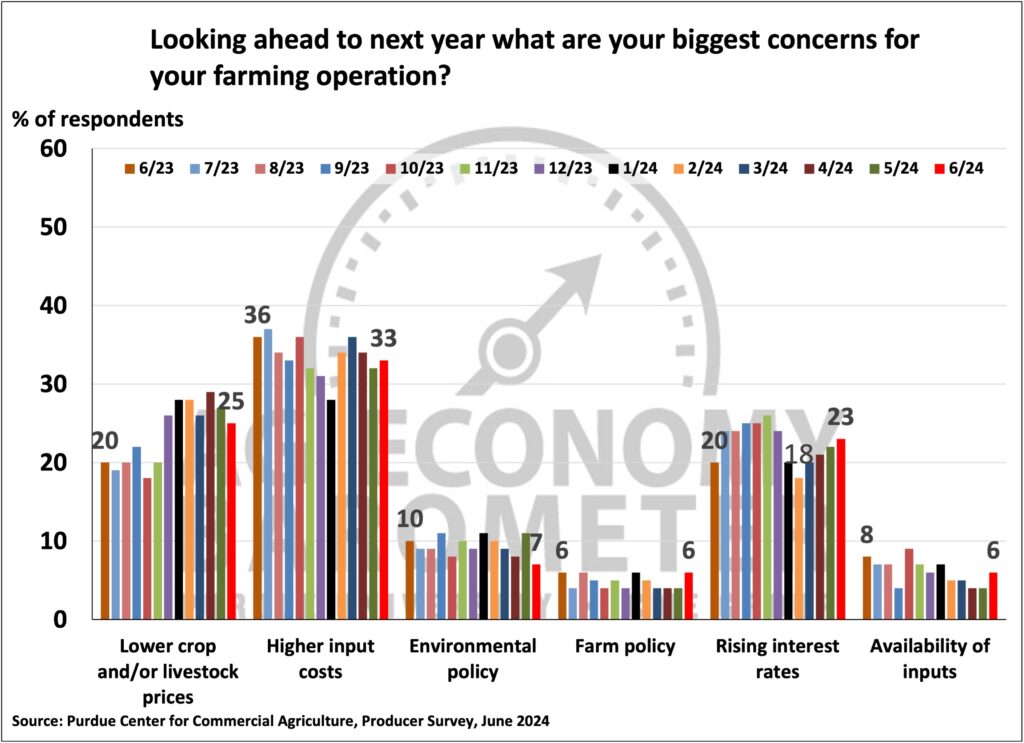
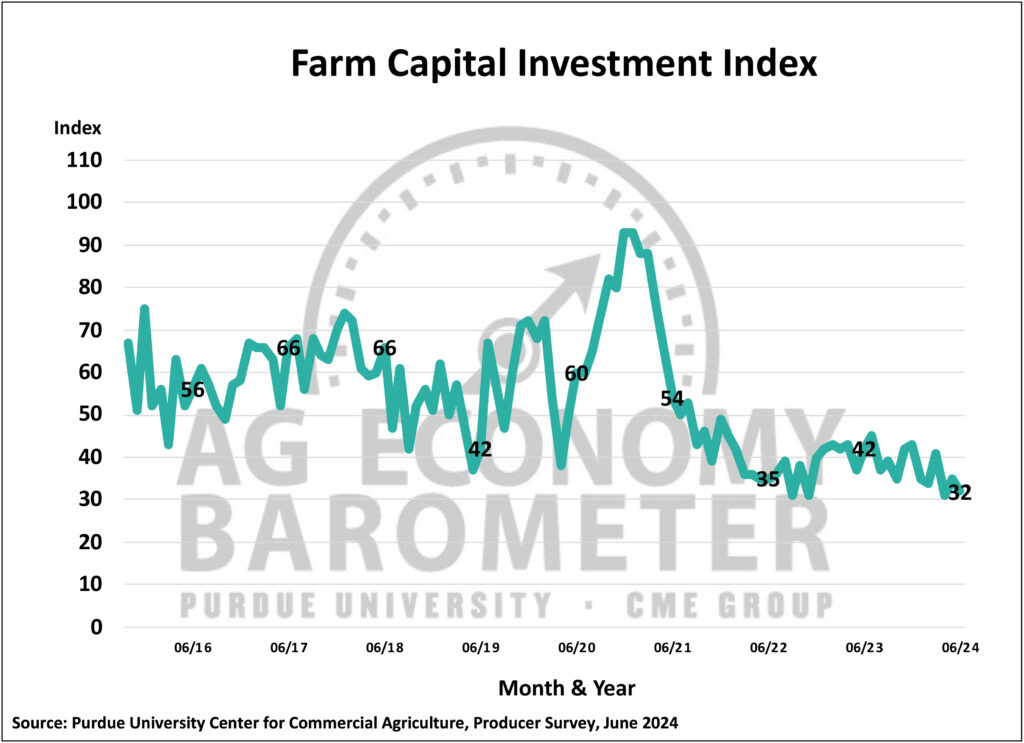
The capital investment outlook weakened slightly in June as the Farm Capital Investment Index fell 3 points to a reading of 32, which leaves the index just one point higher than its all-time low. More producers this month said now is a bad time to make large investments than in May, with no change in the percentage of producers who said it’s a good time to invest. Interest rate concerns appear to be affecting farmers’ investment outlook. Over the last several months, the percentage of producers citing rising interest rates as a top concern for their farm operation has been rising. In February, 18% of survey respondents chose rising interest rates as a top concern. That percentage has been rising every month since then, reaching 23% in the June survey.
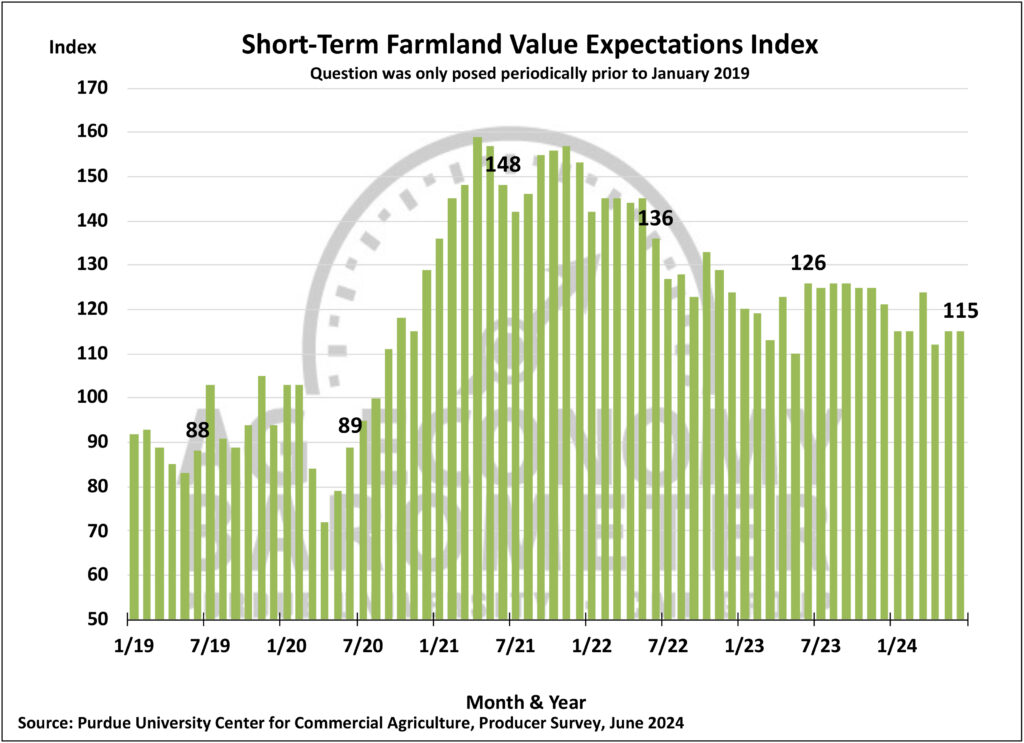
The Short-Term Farmland Value Expectations Index reading in June of 115 was unchanged from a month earlier. However, producers’ longer-term outlook on farmland values did shift as the Long-Term Farmland Values Index value of 152 was 7 points below May’s reading. Fewer producers this month said they expect farmland values to rise over the next five years, with a concurrent rise in the percentage of producers who think values will remain unchanged. Among those producers who expect a long-term increase in farmland values, most (57%) respondents continue to point to non-farm investor demand as a key driver, followed by inflation, which was chosen by 16% of respondents. June marked the third month that the survey instrument included “Energy Production” as a possible driver of farmland values, and this month, 10% of respondents with a bullish outlook chose it as a key factor.
Once again, this month’s survey asked respondents if they or one of their landowners had been approached about a possible Carbon Capture and Storage (CCS) project from an ethanol plant. This month, 8% of respondents said they had been in contact about a CCS project. The vast majority (93%) of respondents who had contact with a company about a CCS project reported that payment rates offered were less than $25 per acre, with just 8% of producers reporting payment rate offers of $50 or more per acre.
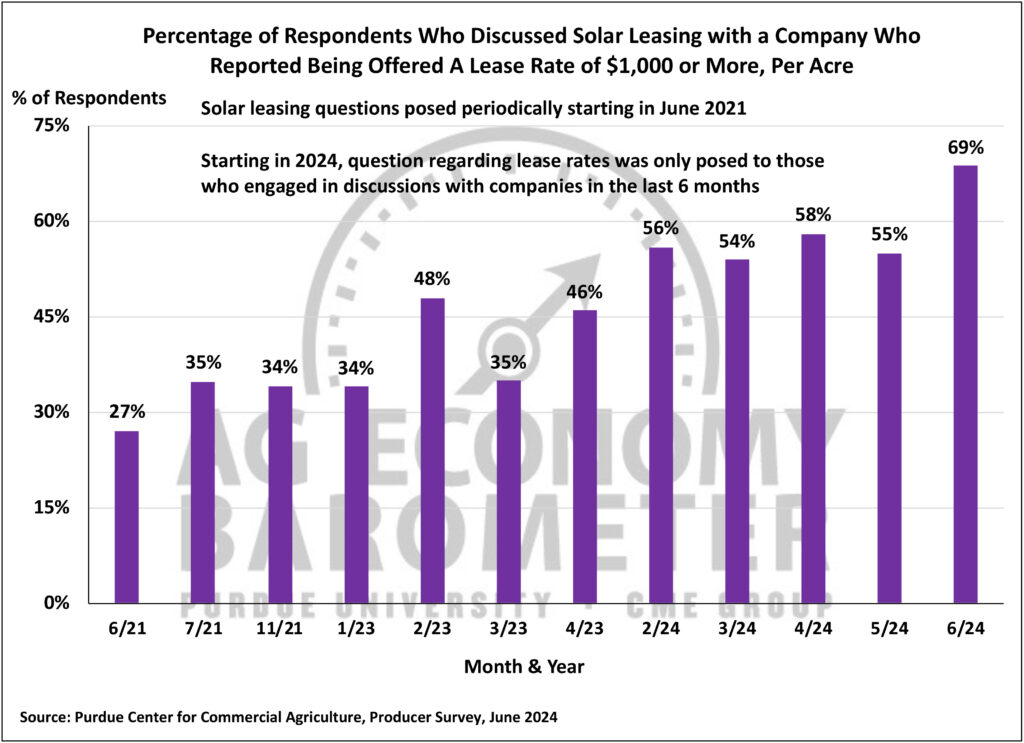
Sixteen percent of respondents this month said that, within the last six months, they had discussed with a company a farmland lease for solar energy production. That’s down slightly compared to April and May, when 19 and 20 percent of respondents, respectively, reported solar leasing discussions taking place. Lease rates have been rising since we first collected data on solar leasing in 2021. This month, 69% of respondents said they were offered a long-term lease rate of $1,000 per acre or more, up from just 27% in June 2021. This month’s survey included a more detailed list of lease rate options for respondents to choose from, and 27% of respondents said they were offered a lease rate of $1,500 per acre or more. Fifty-eight percent of respondents said the lease contract they discussed included an annual escalator clause. Among those respondents who reported discussing an escalator clause, the most common escalator range was from 2 to 3 percent per year.
Wrapping Up
Weaker expectations for the future were responsible for a modest decline in this month’s Ag Economy Barometersentiment index. Farmers long-term farmland value outlook weakened slightly in June after approaching an all-time high last month. The percentage of farmers reporting that they are concerned about rising interest rates has been increasing, which could be one reason why farmers’ future expectations, along with their outlook on capital investments and long-term farmland values, all dipped compared to a month earlier. In areas of the country where leasing of farmland for solar energy production is taking place, lease rates being offered continue to rise. This month, 69% of respondents who reported a solar leasing discussion said they were offered a long-term solar lease rate of $1,000 per acre or more.