


Farmer Sentiment Improves in August, But Inflationary Concerns Mount
James Mintert and Michael Langemeier, Purdue Center for Commercial Agriculture
A breakdown on the Purdue/CME Group Ag Economy Barometer August results can be viewed at https://purdue.ag/barometervideo. Find the audio podcast discussion for insight on this month’s sentiment at https://purdue.ag/agcast.
Download report (pdf)
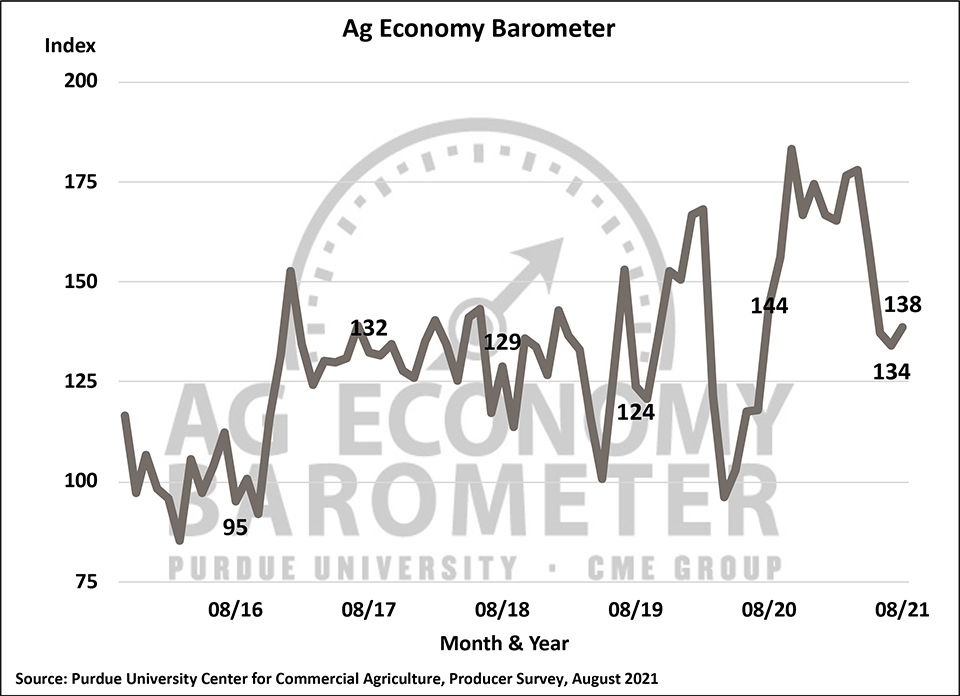
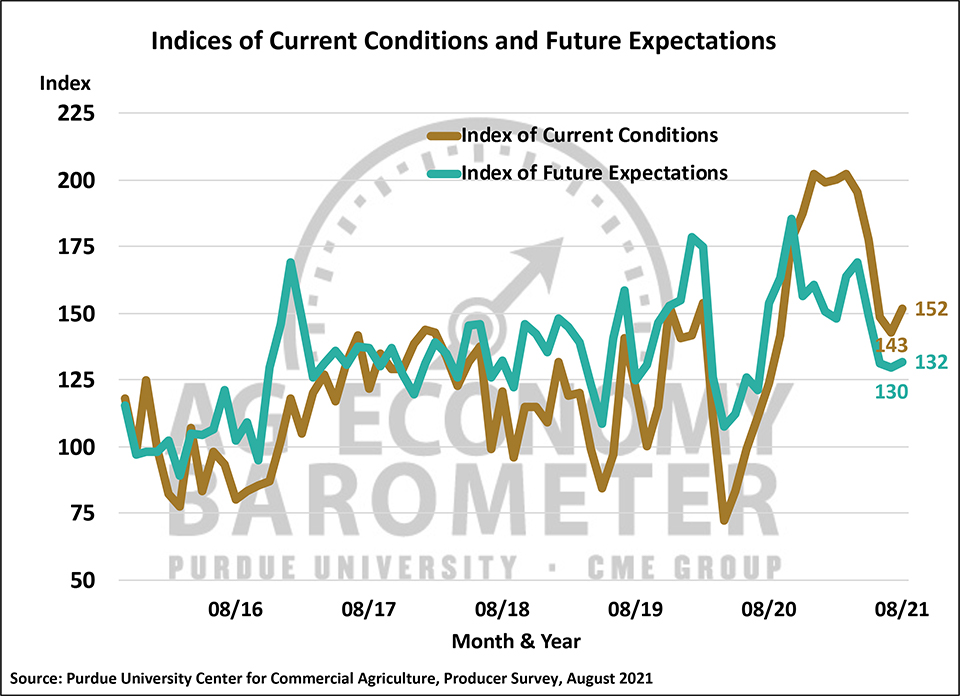
Agricultural producers’ sentiment improved slightly in August compared to July as the Ag Economy Barometer rose four points to a reading of 138 vs. 134 a month earlier. The modest rise in the barometer was primarily attributable to an improvement in the Index of Current Conditions, which climbed 9 points to 152 while the Index of Future Expectations rose just 2 points to 132. Although the barometer and its two key sub-indices improved in August compared to July, all three indices remain well below the very positive sentiment readings posted this past spring. The Purdue University-CME Group Ag Economy Barometer sentiment index is calculated each month from 400 U.S. agricultural producers’ responses to a telephone survey. This month’s survey was conducted from August 23-27, 2021.
The improvement in the Current Condition Index was tied to producers’ more positive view of their farms’ financial situation. The Farm Financial Performance Index rose 11 points to 110, its highest reading since May, as farmers indicated they expect profitability this year to be better than a year earlier. Although corn and soybean prices have declined in recent weeks, they were still well above year-ago levels as were wheat prices. Uncertainty about final yields for fall harvested crops continues, but yield prospects stabilized or improved for many producers in August as some precipitation fell in abnormally dry and drought-stricken areas. Livestock price strength also provided a boost to some farms’ income prospects as fed cattle and slaughter hog prices continued to trade well above levels observed 12 months earlier.
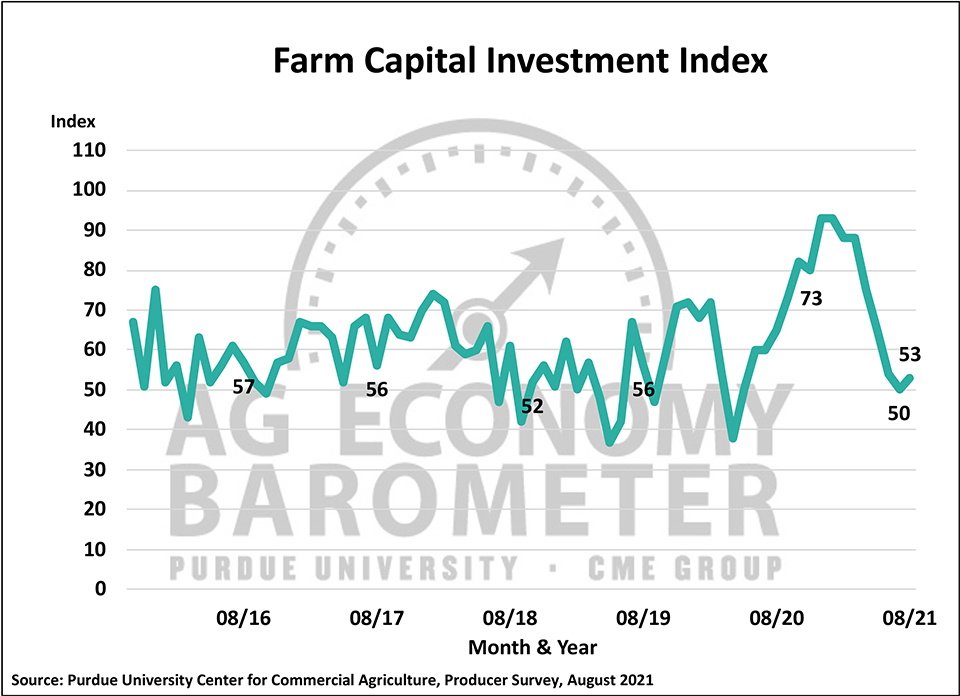
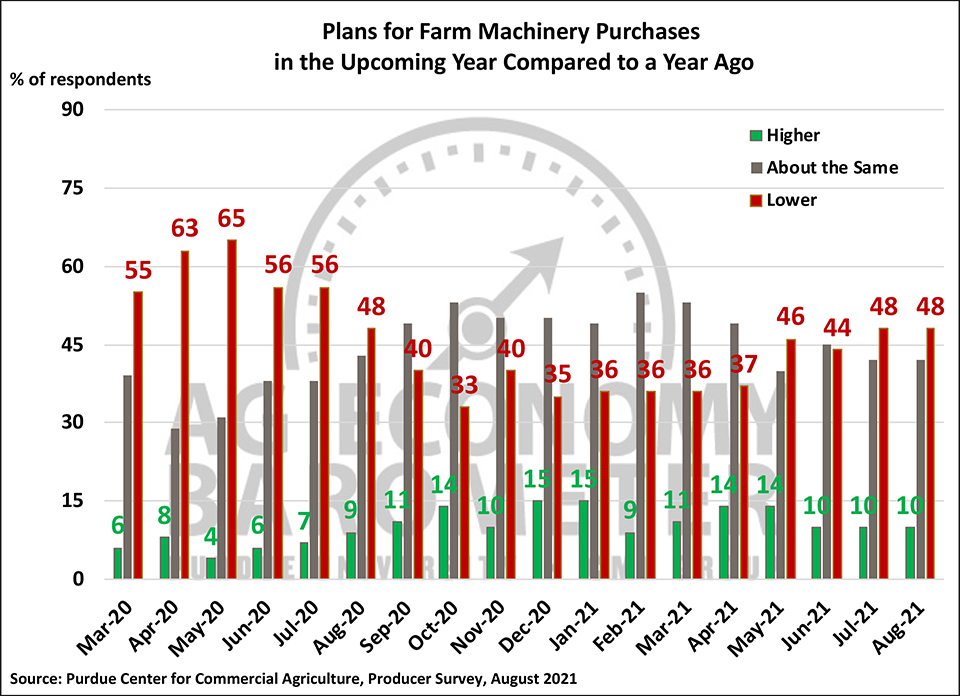
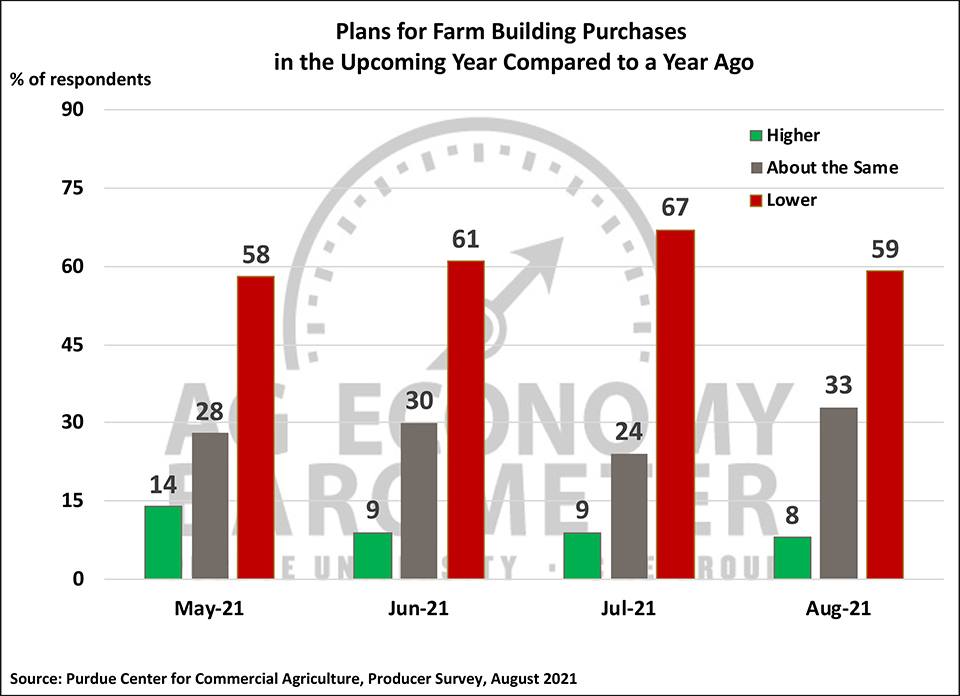
The Farm Capital Investment Index improved modestly in August, rising to a reading of 53, up 3 points compared to July. The small improvement in the index could be traced to fewer producers in August saying they planned to reduce their farm construction activity compared to a year ago. At the same time, farmers said their machinery purchase plans were unchanged from those reported in July. Industry reports continue to suggest that supply chain challenges are hampering farmers’ machinery purchase plans.
Producers are becoming increasingly concerned about rising input costs. For the third month in a row, the barometer survey asked respondents for their expectations about farm input price changes in the upcoming 12 months. On the August survey, 39% of respondents said they expect input prices to rise by 8% or more, up from 30% who felt that way in both June and July while one in five producers (21%) expect farm input price inflation to exceed 12%. Just 13% of producers surveyed said they expect input price pressure in the upcoming year to fall in a range of 0 to 2%, which would be similar to the rise in farm input prices over the last decade.
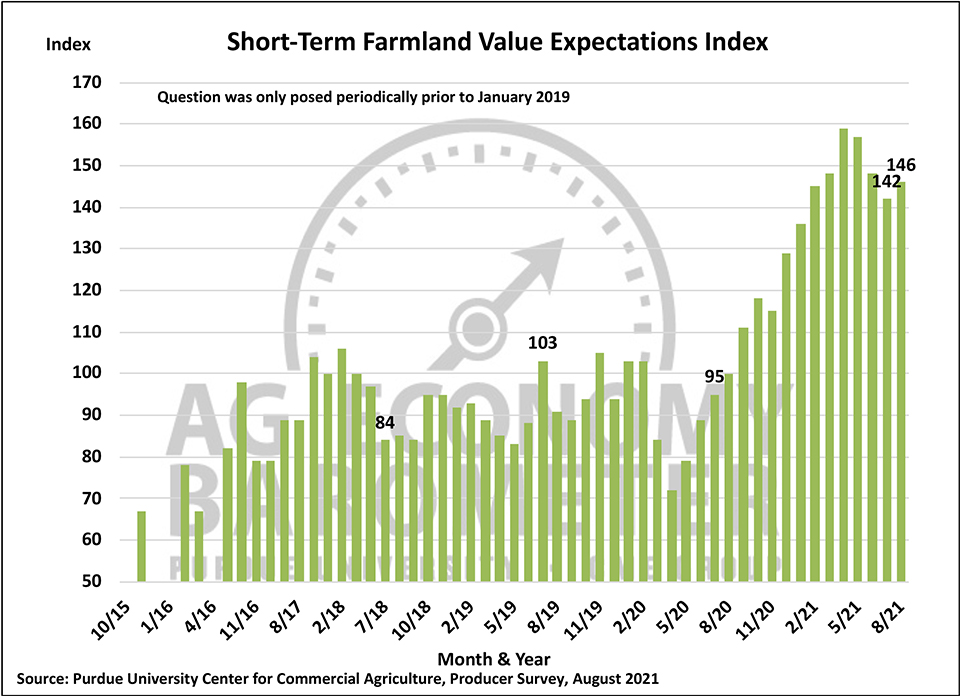
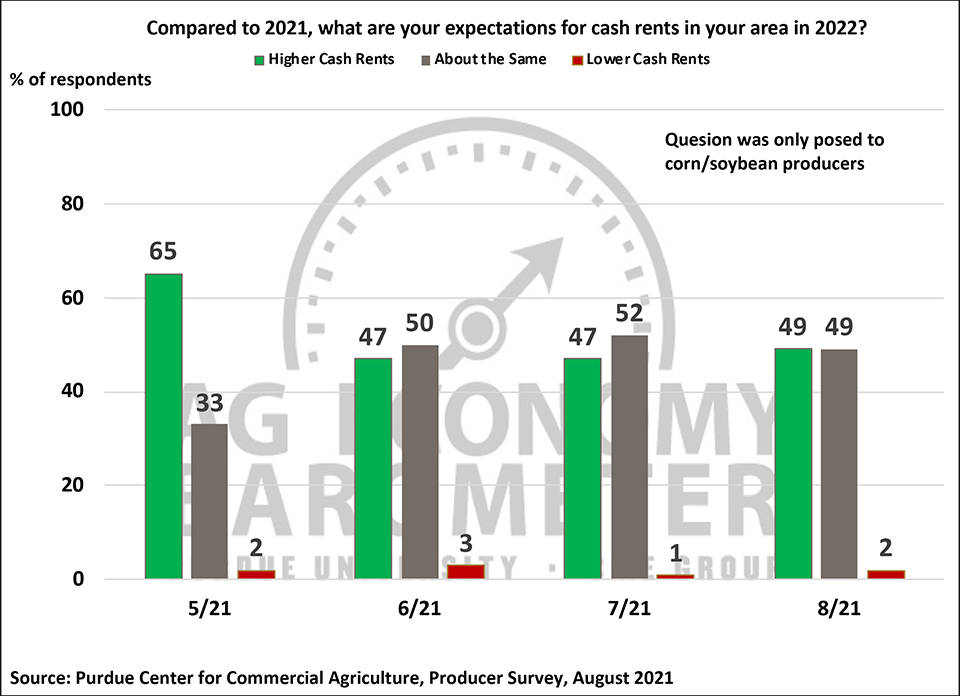
Optimism about farmland values among producers continues. Both the Short-Term and Long-Term Farmland Values Expectations Indices rose by 4 points in August compared to July. Although both indices are below their springtime peaks, they remain near their all-time highs since data collection began in 2015. Consistent with the optimism about farmland values, about one-half of corn/soybean growers expect farmland cash rental rates to rise above 2021 levels in 2022. Among growers who expect cash rents to increase, 44% said that they expect rental rates to rise from 5 to less than 10% with one-third of respondents indicating they expect rates to rise by 10% or more.
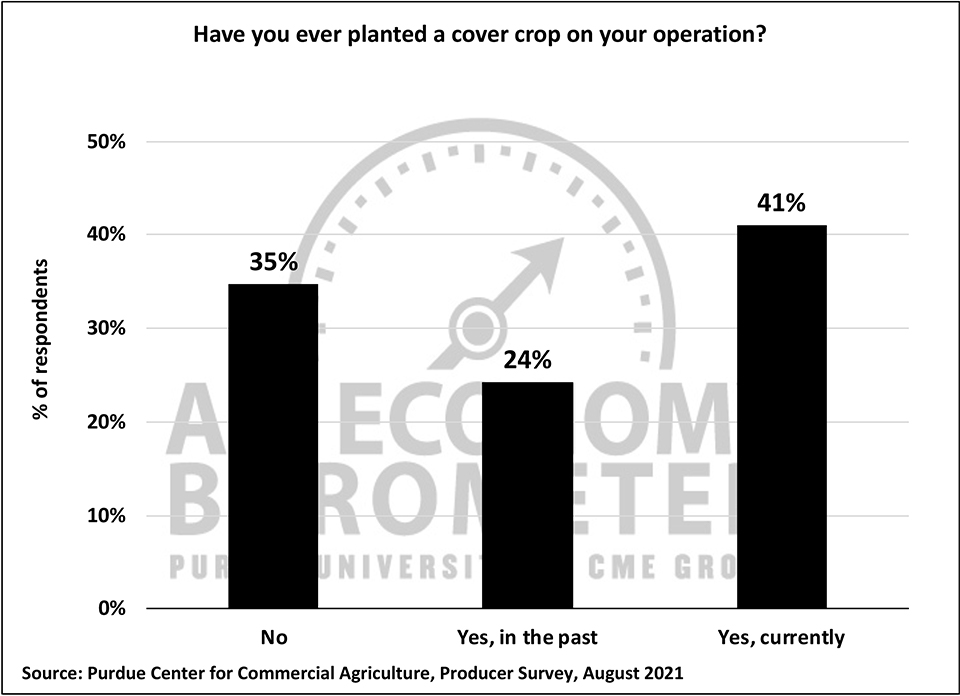
The August barometer survey included a series of questions designed to learn more about producers’ use of cover crops in their farm operation. Nearly two-thirds (65%) of producers said they had either used cover crops in the past or were currently using cover crops with 41% of respondents indicating they currently use cover crops. Among producers currently using cover crops, nearly half (47%) began planting cover crops within the last five years while 29% of respondents have been planting cover crops for more than 10 years. Most producers report that they only plant cover crops on a portion of their farms’ acreage. Fifty-nine percent of cover crop users said they plant cover crops on 25% or less of their total acreage whereas 10% of cover crop users reported planting cover crops on more than 75% of their acreage. When asked why they choose to plant cover crops the most common responses (in order) were to improve soil health, improve erosion control, and improve water quality. Although the existence of carbon sequestration contracts requiring the use of cover crops is a relatively new phenomenon, 10% of cover crop users said that was one of the reasons they choose to plant cover crops.
Wrapping Up
Farmer sentiment improved moderately in August vs. July primarily because producers reported that current conditions on their farm operations were better than a month earlier. The sentiment improvement appeared to be driven in part by stronger financial conditions as the Farm Financial Performance Index in August rose just over 10% when compared to July. Fewer producers this month said they plan to reduce farm construction activity when compared to a year earlier which helped push the Farm Capital Investment Index up slightly compared to July. Agricultural producers remain bullish about farmland values over the next 12 months and the next five years, but at the same time farmers indicated they are concerned about rising input costs. A majority of corn/soybean producers expect a significant rise in farmland cash rental rates for 2022 vs. 2021 while nearly 40% of all producers expect farm input prices to rise by 8% or more in the next 12 months.