


Farmer Sentiment Improves, Producers Credit Stronger Financial Conditions
James Mintert and Michael Langemeier, Purdue Center for Commercial Agriculture
A breakdown on the Purdue/CME Group Ag Economy Barometer November results can be viewed at https://purdue.ag/barometervideo. Find the audio podcast discussion for insight on this month’s sentiment at https://purdue.ag/agcast.
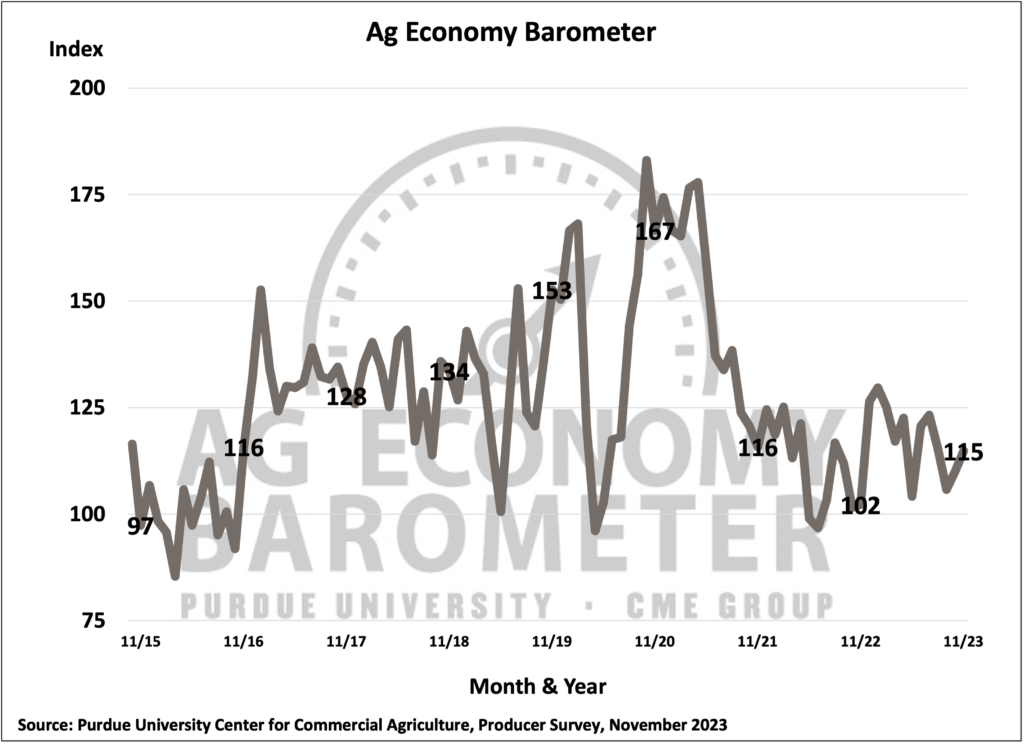
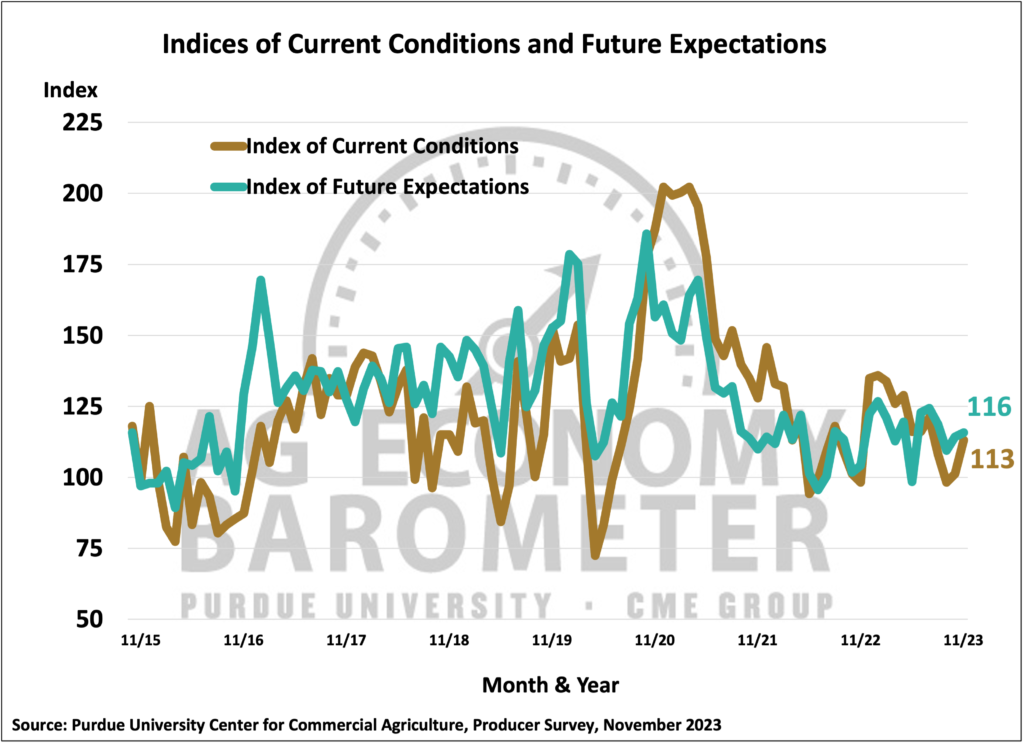
For the second month in a row, farmer sentiment improved as the Purdue University-CME Group Ag Economy Barometer climbed five points to reach an index value of 115 which left the index 12 percent higher than a year earlier. November’s 12-point rise in the Current Conditions Index to a reading of 113 was primarily responsible for this month’s sentiment improvement as the Index of Future Expectations only improved by 2 points. Both sub-indices exceeded their year-ago levels in November. The Current Conditions Index increased by 15% and the Future Expectations Index was up 11% when compared to November 2022. The improved perception among U.S. farmers regarding their farms’ financial condition and prospects contributed to this month’s more positive sentiment reading. The November Ag Economy Barometer survey was conducted from November 13-17, 2023.
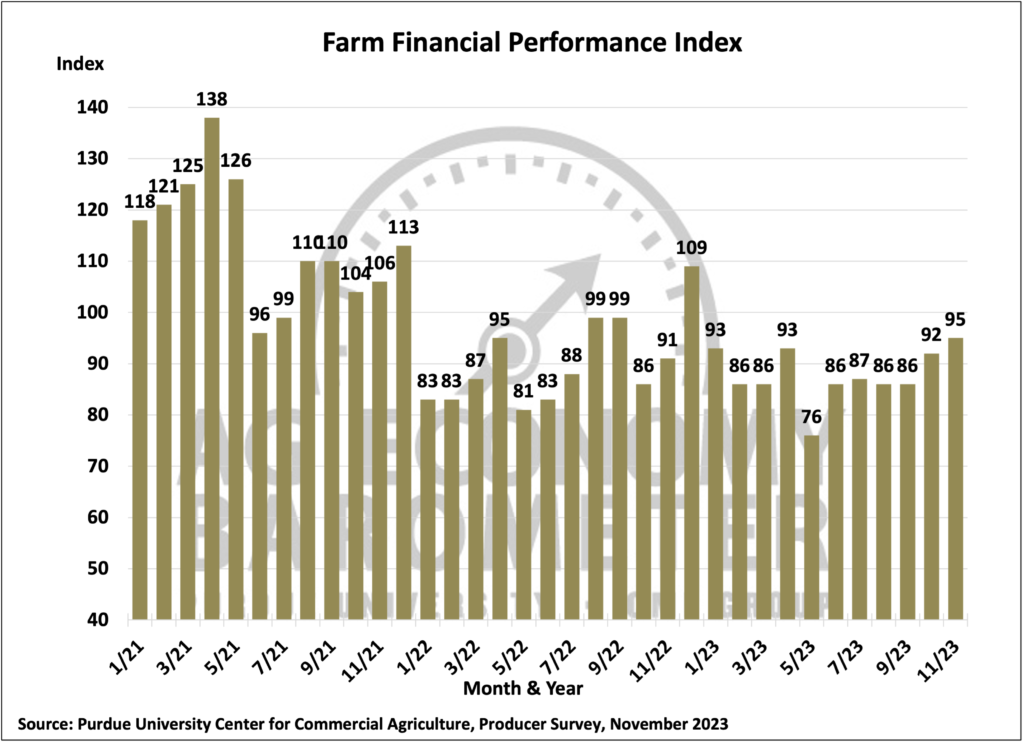
The November reading of the Farm Financial Performance Index improved to 95, up 3 points compared to a month earlier. The index, which is based upon a question that asks producers to compare their farms’ financial performance this year to last year, was 10% higher than at the outset of this fall’s harvest in September and up 25% compared to its lowest point of 2023 back in May. Comparing responses received in May to those in the November survey highlights the change in producers’ perspectives about farm income. When comparing the two surveys the biggest shift was movement toward expecting financial performance to be about the same as last year and away from expecting worse performance than a year ago. In November just 22% of respondents said they expected worse financial performance than a year earlier whereas in May the percentage expecting worse performance was 38%. At the same time, the percentage of respondents expecting financial performance to be about the same as a year earlier rose to 61% in November from 48% who felt that way in May.
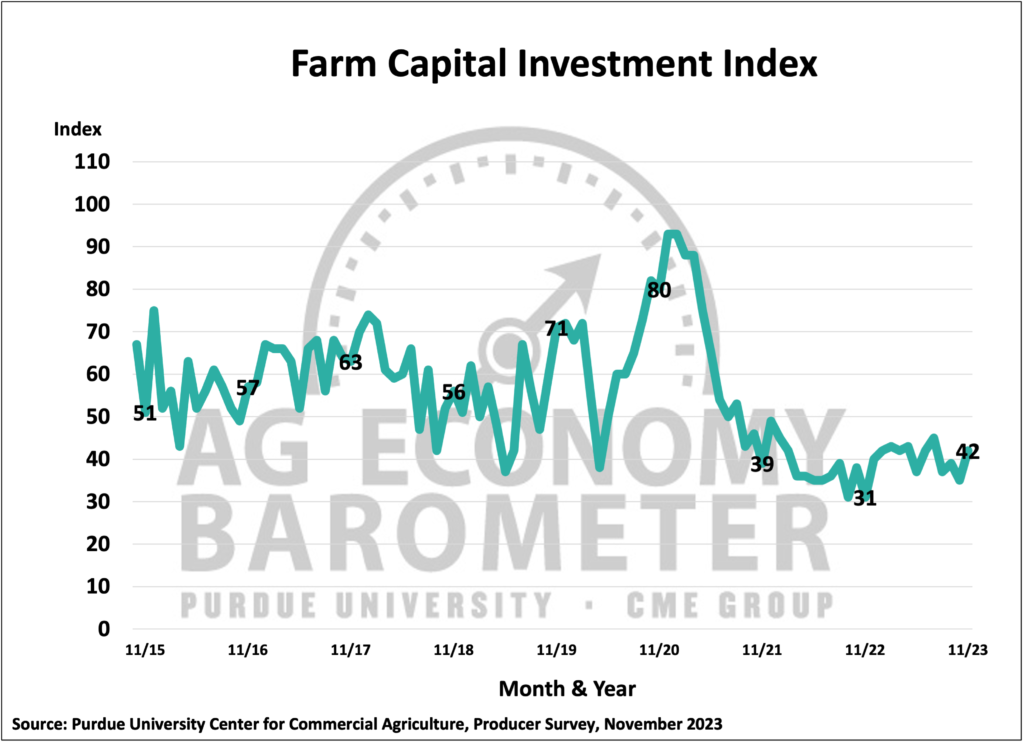
The Farm Capital Investment Index rebounded to a reading of 42, up 7 points from October. So far in 2023, the index has ranged from a high of 45 in July to a low of 35 reached in October. Sixteen percent of respondents in this month’s survey said now is a good time to make large investments, nearly matching this year’s high point of 17% which was reached in July. Surveys conducted from July through November 2023 have asked respondents who think it’s a good time for large investments why they feel that way. The percentage of respondents choosing “strong cash flows” has been drifting lower since summer when approximately 40% of respondents chose that as their primary reason. This month just 22% of respondents chose “strong cash flows” with “higher dealer inventories,” chosen by 29% of respondents, claiming the top spot for why now is a good time to make large investments. The rise in the percentage of farmers pointing to higher dealer inventories could also be an indication that farm equipment price rises are starting to moderate.
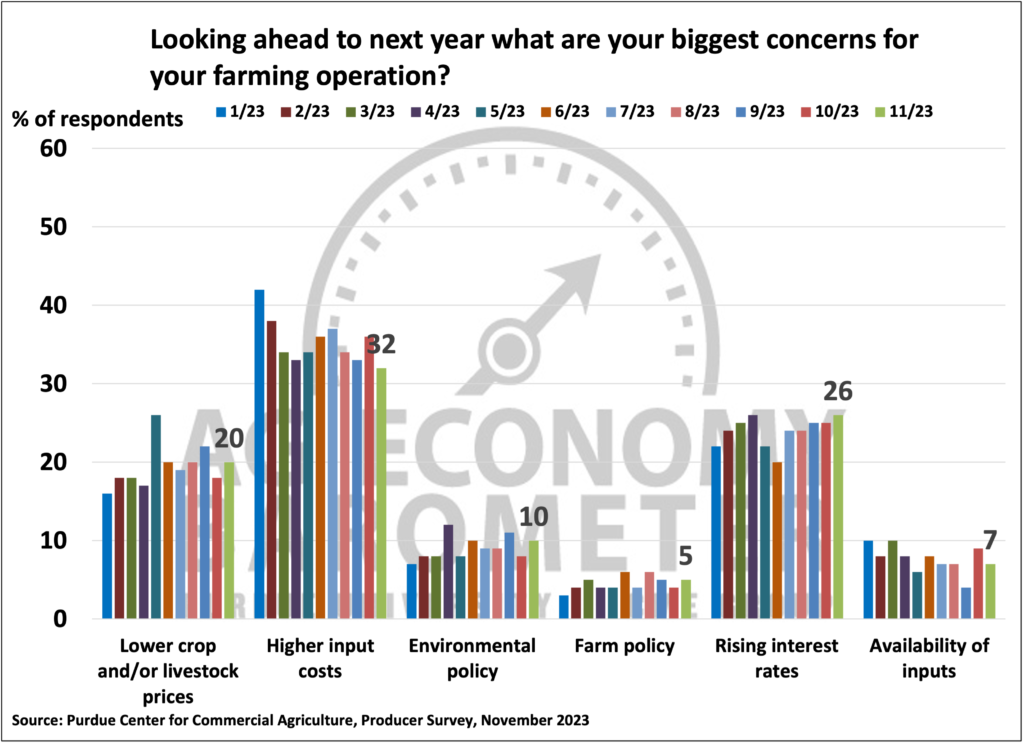
When asked what their biggest concerns are for the upcoming year, producers continue to point to “higher input costs,” with nearly one-third (32%) of respondents choosing that as a top concern, followed by “rising interest rates” (26% of respondents) and “lower crop and/or livestock prices” (20% of respondents). Compared to responses from the beginning of this year, fewer producers chose higher input costs while more respondents chose rising interest rates and lower crop/livestock prices.
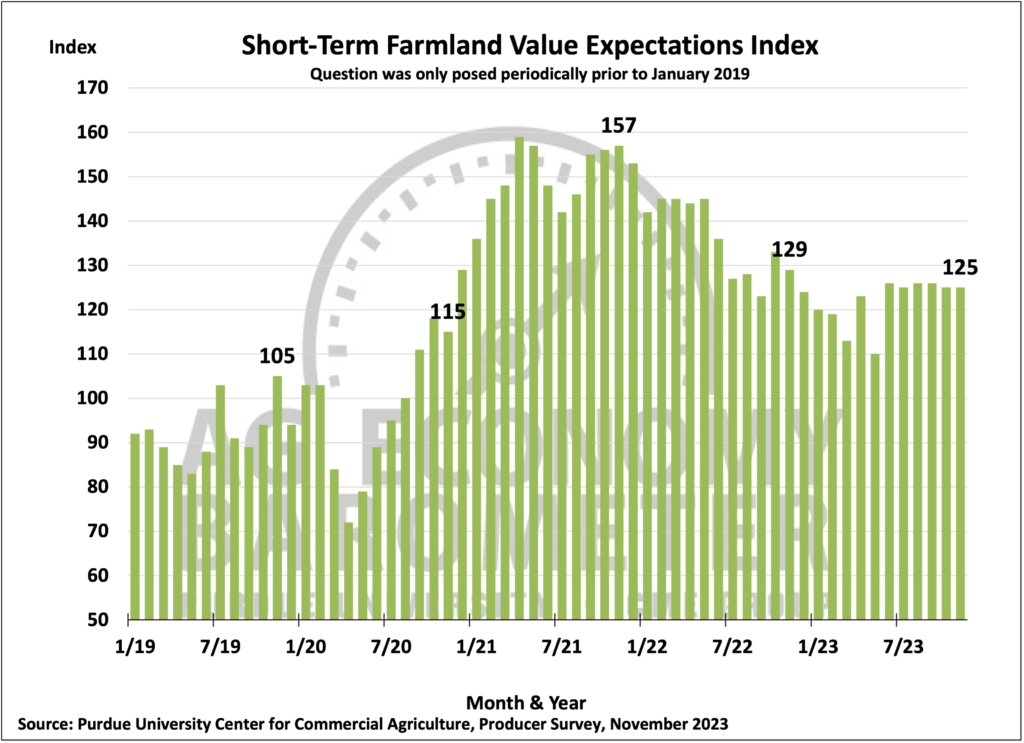
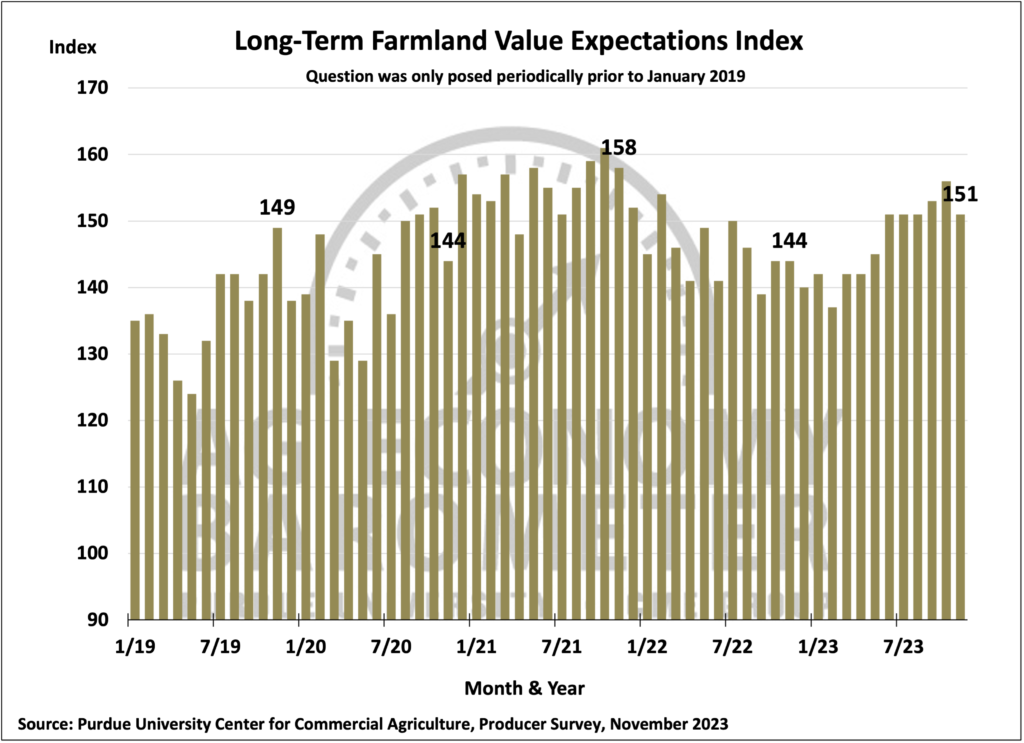
Producers’ perspective on farmland values changed very little in November compared to October. The Short-Term Farmland Values Expectation Index remained unchanged at a reading of 125, while the long-term index dropped back by 5 points to a reading of 151. The short-term index has been in a range of 125-126 since June, while the long-term index has been in a range of 151-156 over that same time frame. Over 80% of respondents who expect farmland values to rise over the next five years said the main reason for optimism is ”non-farm investor demand” (59% of respondents) or “inflation” (23% of respondents).
This month’s survey responses were collected the same week that Congress passed an extension of the 2018 Farm Bill to September 30, 2024. Anticipating the possibility that Congress would extend the current Farm Bill into 2024, the November survey asked survey respondents who have a corn and/or soybean enterprise which farm safety net program they would choose for 2024. Among those respondents who expressed a preference for one program over the other, just over two-thirds of them said they planned to sign up for the ARC farm program, with nearly one-third anticipating that they would enroll in the PLC program, assuming Congress extended the 2018 Farm Bill’s provisions to 2024. However, for both corn and soybeans, there was a lot of uncertainty among producers concerning which program they would choose in 2024. When asked to identify the program they would choose for soybeans, just over half (52%) of respondents declined to choose either program. For the corn enterprise, over four out of ten (43%) of producers declined to choose between ARC and PLC.
Wrapping Up
Farmer sentiment in November improved for the second consecutive month as the Ag Economy Barometer climbed 5 points above the prior month. The primary driver behind this month’s sentiment improvement was improved farm financial performance expectations among survey respondents. The Farm Capital Investment Index also rose during November, although respondents who said it was a good time to invest were more likely to point to rising dealer inventories of farm equipment as a reason than strong farm cash flows. Farmers continue to be relatively optimistic about future values for farmland as the short-term farmland index held steady while the long-term index drifted lower.