


Farmer Sentiment Weakens as Production Cost Concerns Mount
James Mintert and Michael Langemeier, Purdue Center for Commercial Agriculture
A breakdown on the Purdue/CME Group Ag Economy Barometer November results can be viewed at https://purdue.ag/barometervideo. Find the audio podcast discussion for insight on this month’s sentiment at https://purdue.ag/agcast.
Download report (pdf)
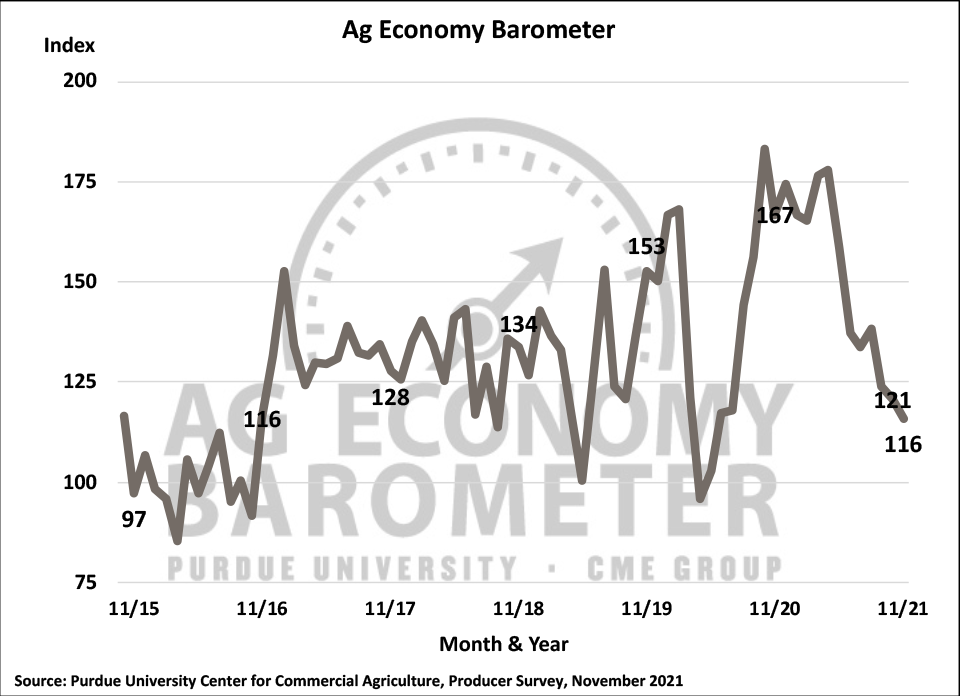
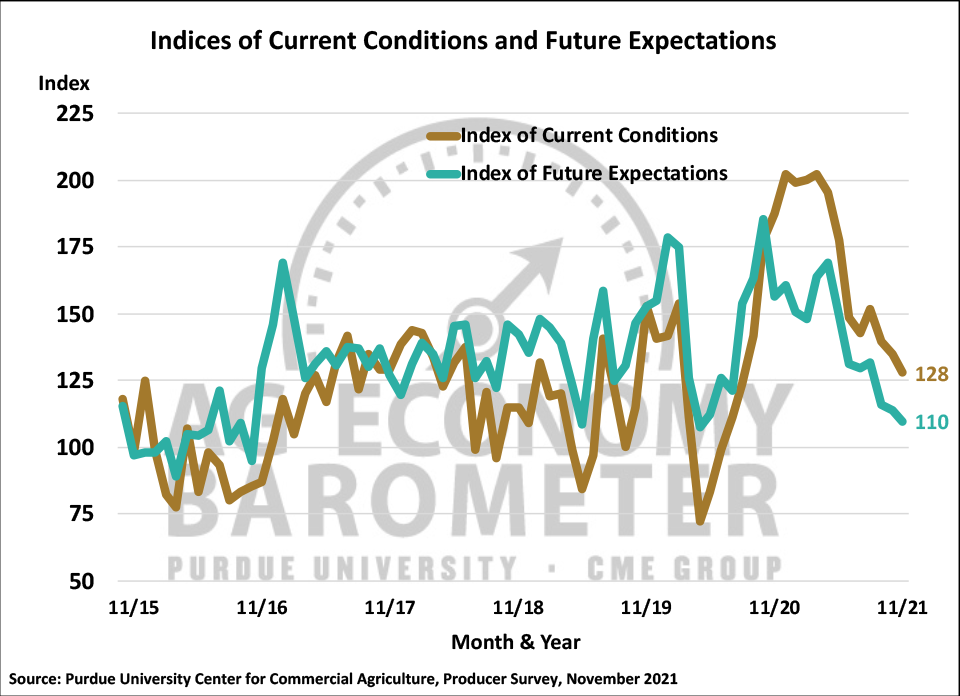
The Ag Economy Barometer slipped to a reading of 116 in November, down 5 points from October and 30% lower than in November 2020 when the barometer stood at 167. Once again, weakness in the barometer was tied to weaker sentiment regarding current conditions as well as weaker expectations for the future. The Index of Current Conditions declined 7 points in November to 128 and the Index of Future Expectations fell 4 points to 110. November marked the lowest reading of the year for all three measures of producer sentiment as concerns about sharp rises in production costs coincided with concerns about a host of other issues ranging from prices for crops and livestock to environmental and tax policy as well as COVID. The Purdue University-CME Group Ag Economy Barometer sentiment index is calculated each month from 400 U.S. agricultural producers’ responses to a telephone survey. This month’s survey was conducted from November 15 to 19, 2021.
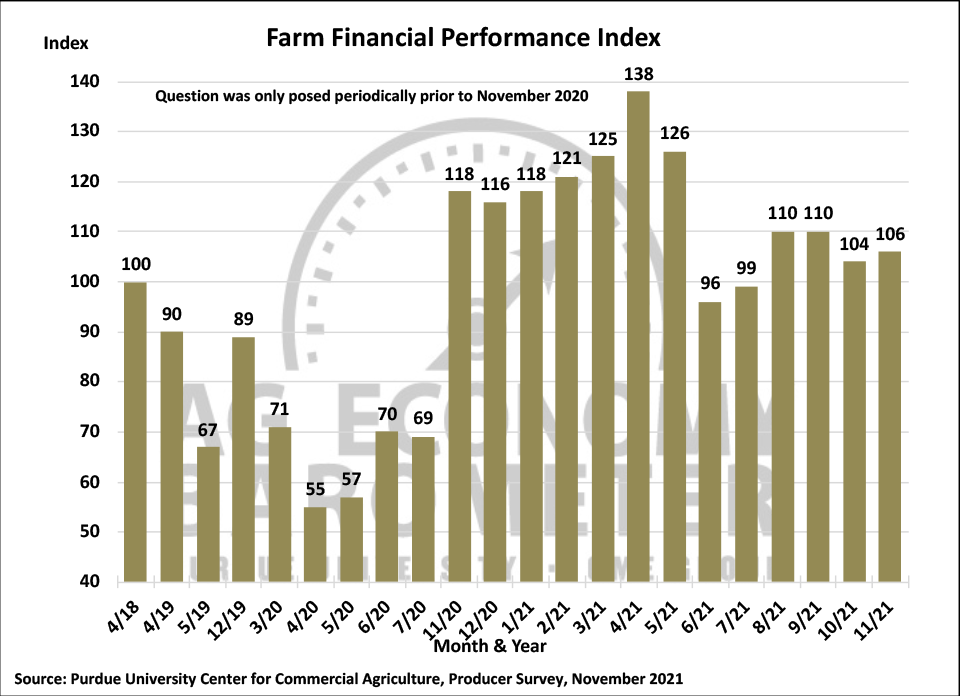
The Farm Financial Performance Index rose 2 points to 106 in November. Unlike the broader sentiment measures, the farm financial index this month was 10% above its low reading of 2021 which occurred back in June. Over the last four months the financial performance index ranged from a low of 104 to a high of 110, a noticeable improvement compared to this year’s lowest readings of 96 and 99 which occurred in June and July, respectively. Recent improvements in the farm financial index compared to late spring were tied in part to strong crop yields for fall harvested crops and strength in wheat prices which helped push crop revenue estimates well above a year earlier. However, despite the modest improvement in the farm financial index this month, it remains down over 20% compared to its peak reading back in April.
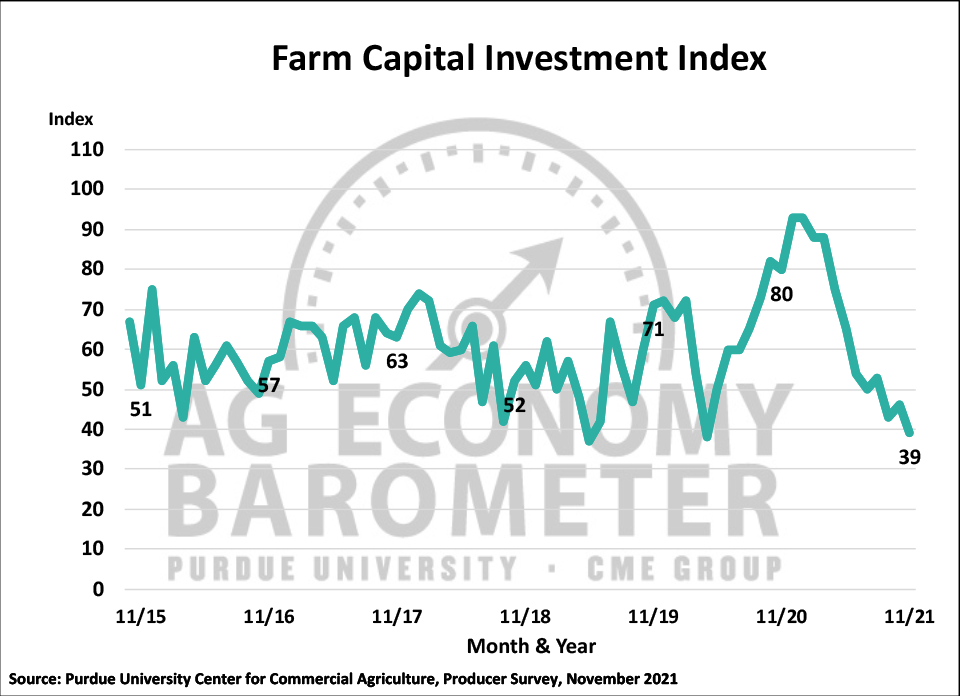
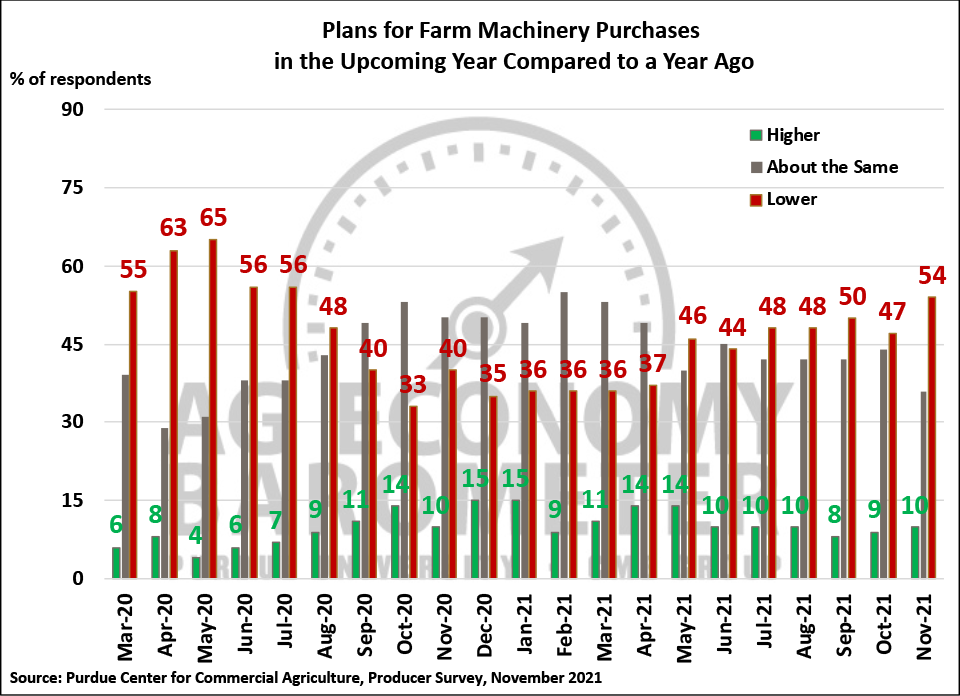
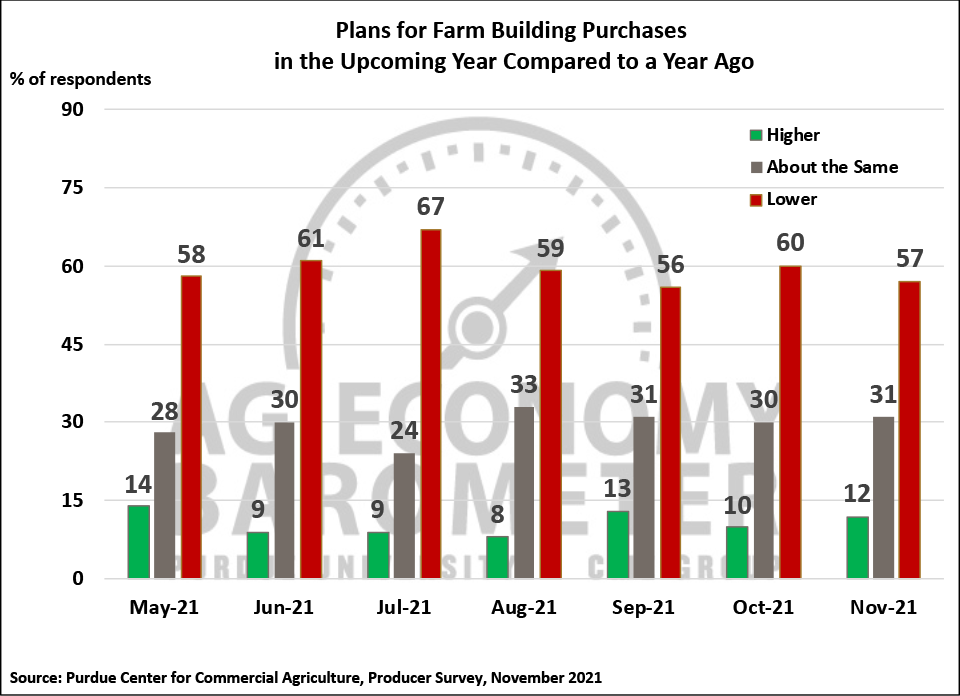
Standing in contrast to the improvement in the Farm Financial Performance Index, the Farm Capital Investment Index declined 7 points to a reading of 39, the index’s lowest reading since April of 2020. Weakness in the investment index seems to be a function of supply chain problems along with concerns about rapidly rising input costs. For example, 44% of producers in this month’s survey said their farm machinery purchase plans were impacted by low farm machinery inventories and, when asked what their biggest concerns are for their farming operation in the upcoming year, nearly half (47%) of survey respondents chose higher input costs as one of their biggest concerns. Although supply chain problems continue to impact the building industry, there was a modest uptick among producers with respect to their plans for constructing new farm buildings and grain bins with fewer producers this month saying they plan to reduce their construction plans compared to a year earlier.
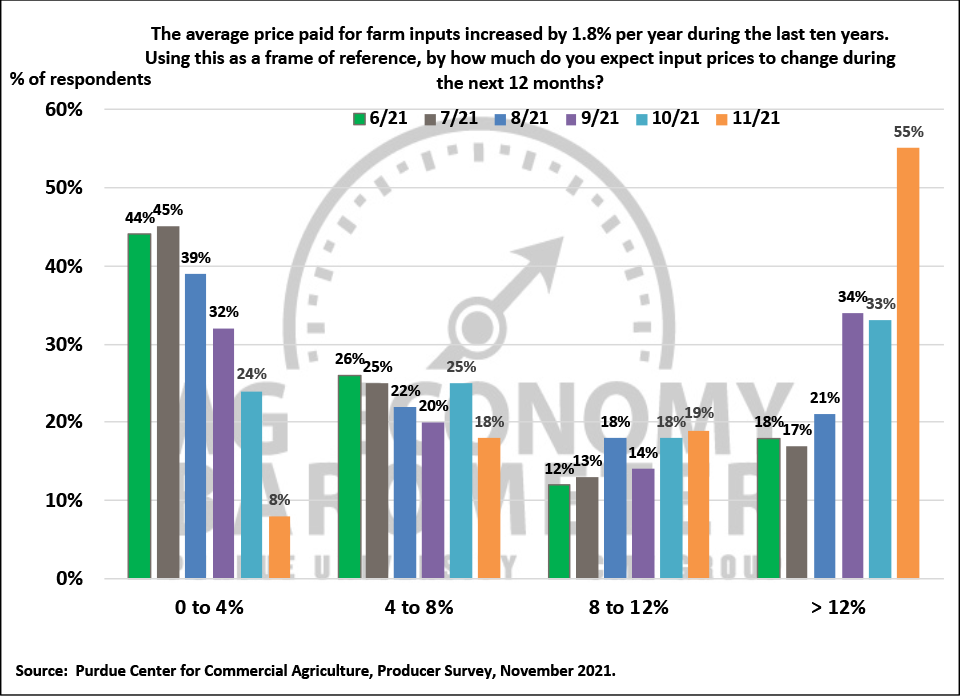
Beginning in June of this year, each monthly survey has included a question asking producers about their expectations for changes in farm input prices in the upcoming 12 months. Responses to this question have shifted markedly over the last 6 months. In June 44% of respondents said they expected input prices to rise from 0 to 4%, a rate of increase consistent with the last decade’s history. Inflation expectations started to shift in September with one-third (32%) of producers expecting input price inflation of less than 4%, followed by a marked change in November when just 8% of respondents said they look for input price inflation to stay below 4%. At the same time, the percentage of farmers expecting to see input price inflation exceed 12% rose from 18% in June to 33% in October before jumping to 55% in November. In the November survey, the question was modified to allow producers to choose even higher rates of inflation than on previous surveys. Responding to the modified question, 43% of respondents said they expect farm input prices to rise by more than 16% in the upcoming year. Although much of the attention on increasing input costs has focused on this year’s dramatic rise in fertilizer prices, virtually all other input costs ranging from farm machinery to seed and fuel are on the upswing as well. Concerns about rising production costs are contributing to weakness in farmer sentiment.
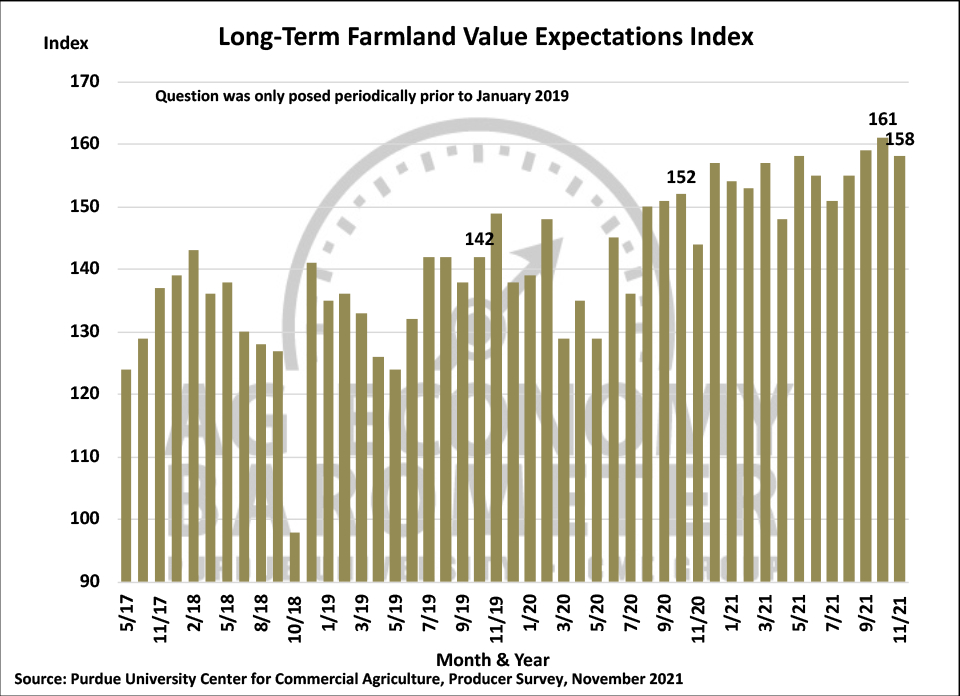
Although farmer sentiment has declined since last spring, ag producers remain very optimistic about farmland values over both the next twelve months and the next five years. Both the short-term and long-term farmland value expectations indices remain near their peaks with the short-term index rising one point this month to 157 while the long-term index declined 3 points to a reading of 158. Strong cash flows from crops in 2021, low interest rates and, possibly, rising concerns about inflation continue to propel farmland values higher. Somewhat surprisingly, given the concerns about rising input costs, the percentage of corn/soybean producers who expect cash rental rates to rise in 2022 rose this month to 52%, up from 43% last month. This was the highest percentage of producers reporting that they expect rental rates to rise since last May.
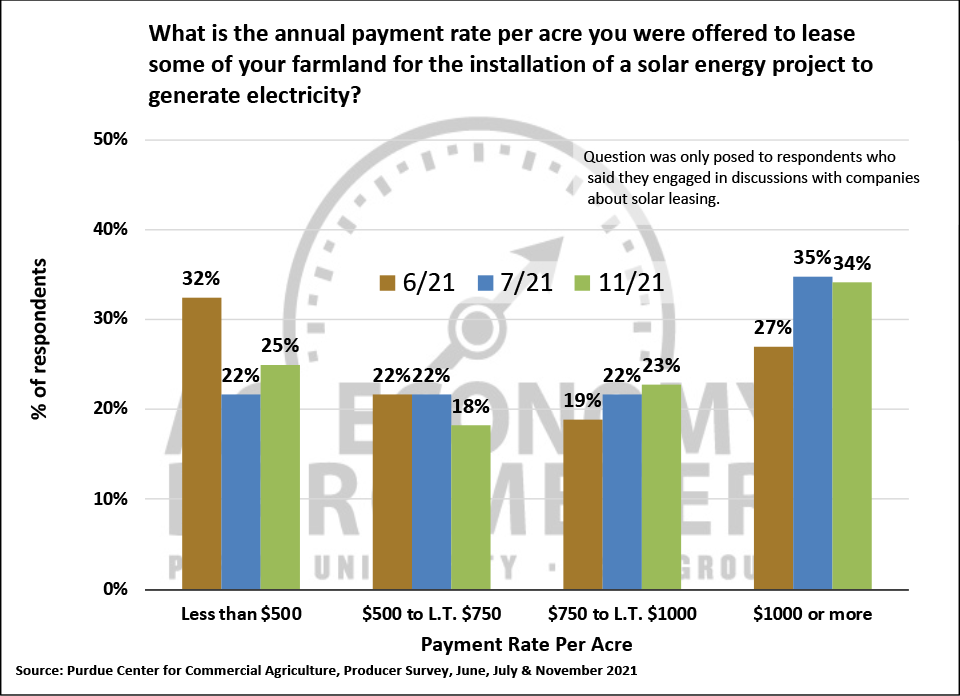
Interest in leasing farmland for installation of a solar energy project appears to be on the rise. Eleven percent of all respondents to the November survey reported having a discussion with a company(s) about leasing farmland for solar energy production. In a follow-up question, producers who reported having discussions about solar leasing were asked what lease rates they were offered. Rates offered to lease farmland for solar energy production continue to vary widely. However, when compared to responses to this question on the June and July surveys there appears to be a shift taking place in lease rates. In June, nearly one-third of respondents said they were offered a lease rate of less than $500 per acre while 27% reported being offered a lease rate of $1,000 or more per acre. In November, 25% of producers said they were offered less than $500 per acre while 34% of producers said they were offered a lease rate of $1,000 or more per acre.
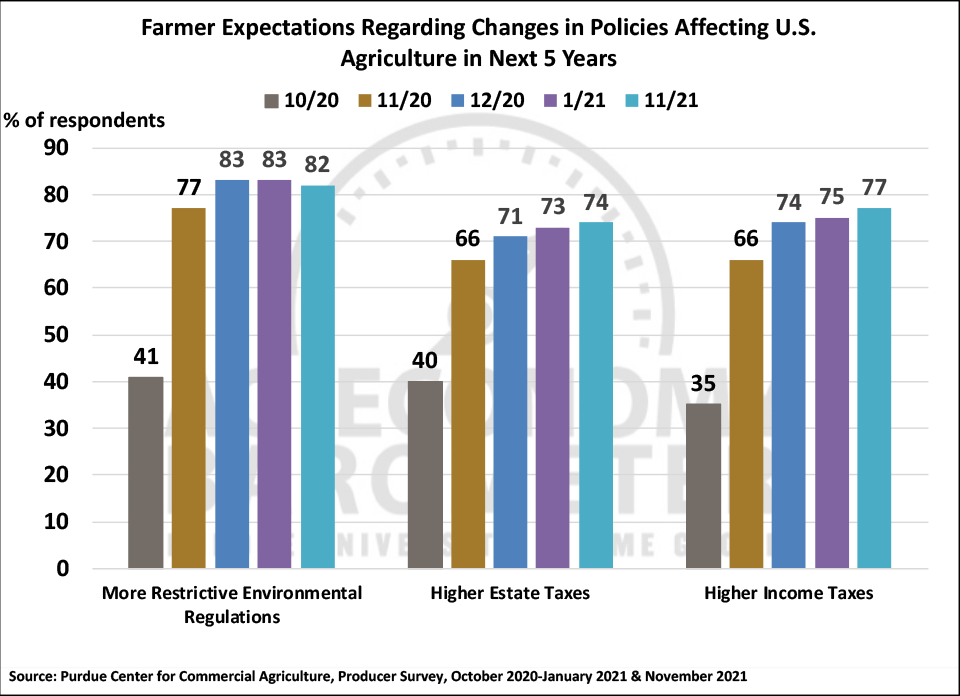
Concerns about government policies impacting agricultural producers remain elevated among farmers. Starting in October 2020, various surveys have included questions regarding expectations for environmental regulations, estate taxes and income taxes. In October 2020, the percentage of ag producers expecting more restrictive environment policies, higher estate taxes and higher income taxes ranged from just 35% (income taxes) to 41% (environmental regulations). There was a marked shift in responses to these questions immediately following the 2020 election as the percentages rose to a range of 66% (estate and income taxes) to 77% (environmental regulations). On the November 2021 survey, 82% of respondents said they expect more restrictive environmental regulations in the years ahead while 74% said they expect higher estate taxes and 77% said they expect higher income taxes.
Wrapping Up
The Ag Economy Barometer slipped 5 points to a reading of 116 in November, its lowest reading of 2021. Although farmer sentiment weakened slightly in November, the Farm Financial Performance Index rose slightly on the strength of strong crop cash flows in 2021. Looking ahead producers are concerned about rising input costs with 55% of producers saying they expect input prices to rise 12% or more in the upcoming year, up from 33% who felt that way in October. Supply chain constraints, combined with concerns about costs, continue to make this a challenging environment for large capital investments as the Farm Capital Investment Index declined 7 points to its lowest reading since April 2020. Strong cash flows in 2021 combined with low interest rates continue to make farmers optimistic about farmland values as both the short-term and long-term farmland value indices remain near their all-time highs. Just over half of corn-soybean producers in November said they expect farmland cash rental rates to rise in 2022 compared to 2021.