


Farmers Remain Cautiously Optimistic About Agricultural Economy
James Mintert and Michael Langemeier, Purdue Center for Commercial Agriculture
A breakdown on the Purdue/CME Group Ag Economy Barometer July results can be viewed at https://purdue.ag/barometervideo. Find the audio podcast discussion for insight on this month’s sentiment at https://purdue.ag/agcast.
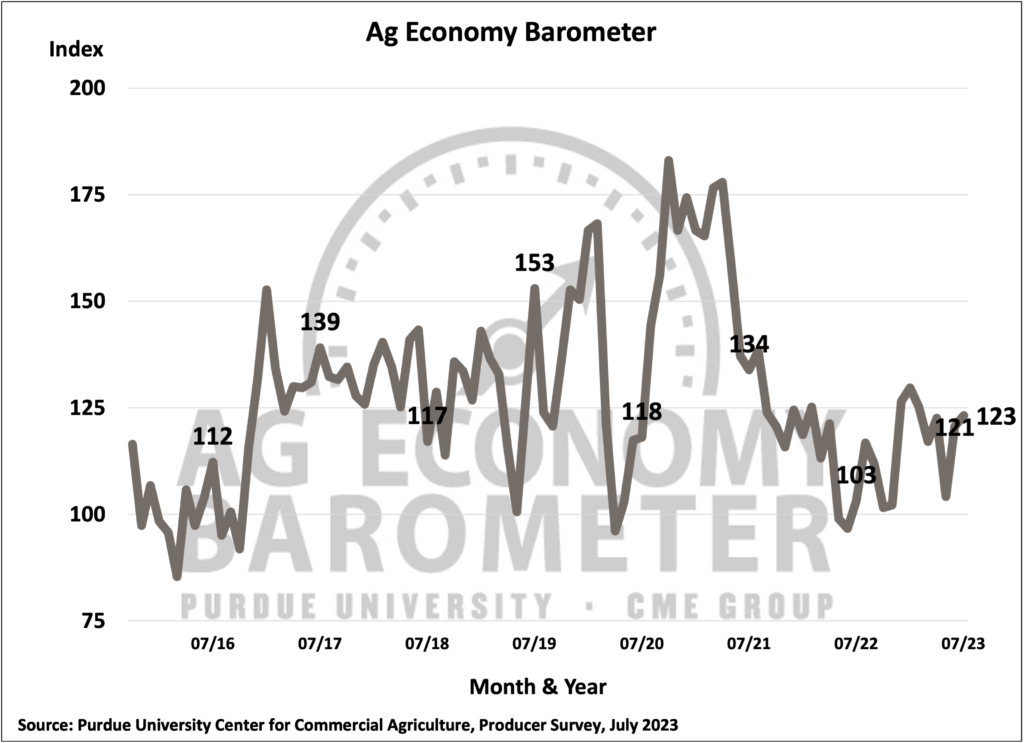
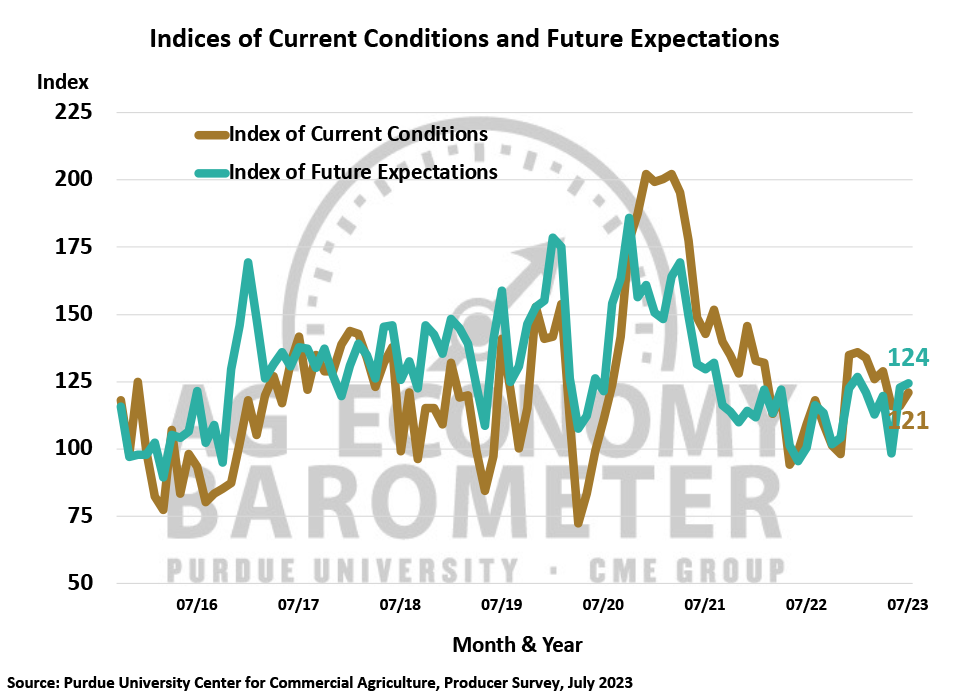
Agricultural producer sentiment improved slightly in July as the Purdue University-CME Group Ag Economy Barometer rose two points above its June reading to an index value of 123. This month’s two-percent rise in the barometer was primarily the result of farmers’ improved perception of current conditions on their farms as the Index of Current Conditions rose 5 points to a reading of 121. The Index of Future Expectations changed little compared to June, rising just one point to 124. This month’s Ag Economy Barometer survey was conducted from July 10-14, 2023.
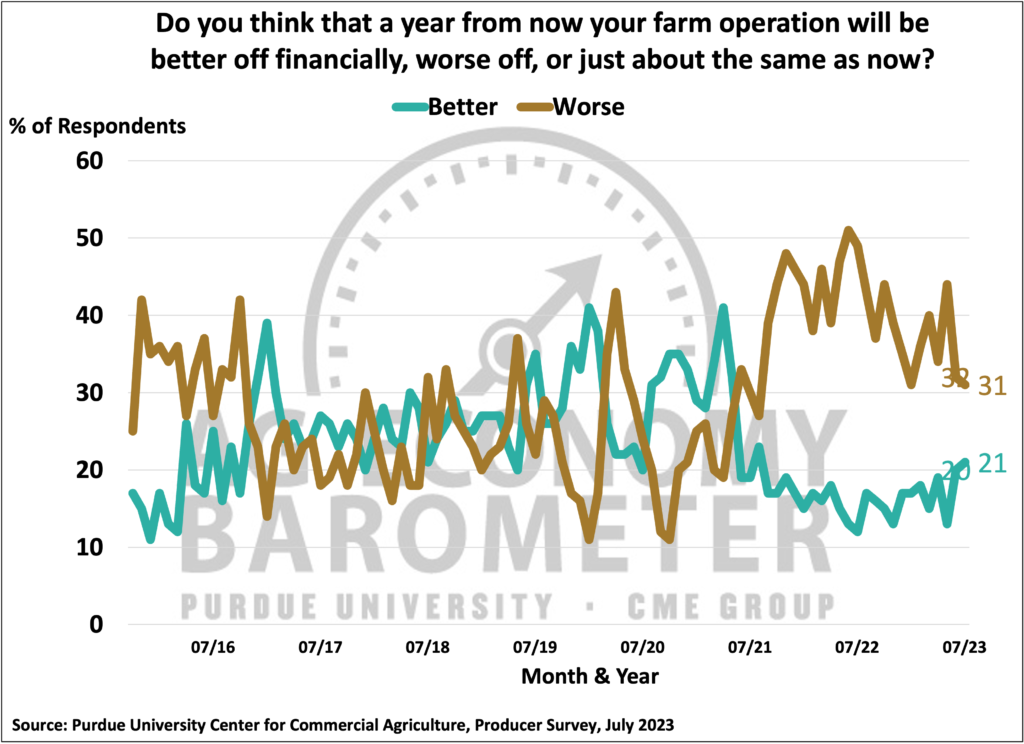
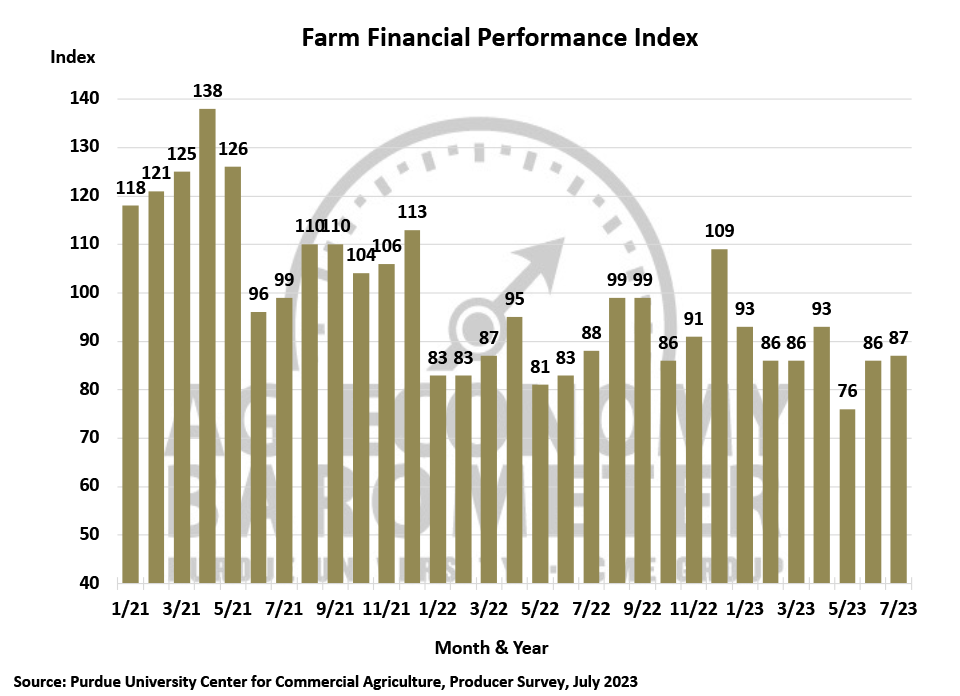
Farmers’ rating of financial conditions on their farms was virtually unchanged in July, compared to June, as the Farm Financial Conditions Index rose just one point to 87 vs. a reading of 86 in June. Looking back to May, however, the percentage of producers rating their farm’s financial performance as better than last year improved from 14% to 17%, while those rating financial performance as worse than a year ago fell from 38% to 30% of respondents. When asked to look ahead one year, there was a one percentage point increase in farmers expecting farm financial conditions to improve in July vs. June and, correspondingly, a one-point decline in the percentage of farmers expecting conditions to worsen. And farmers’ longer-term perspective on the U.S. agricultural economy improved somewhat in July, as the percentage of respondents expecting bad times in the upcoming 5 years fell from 41% in June to 39% in July.
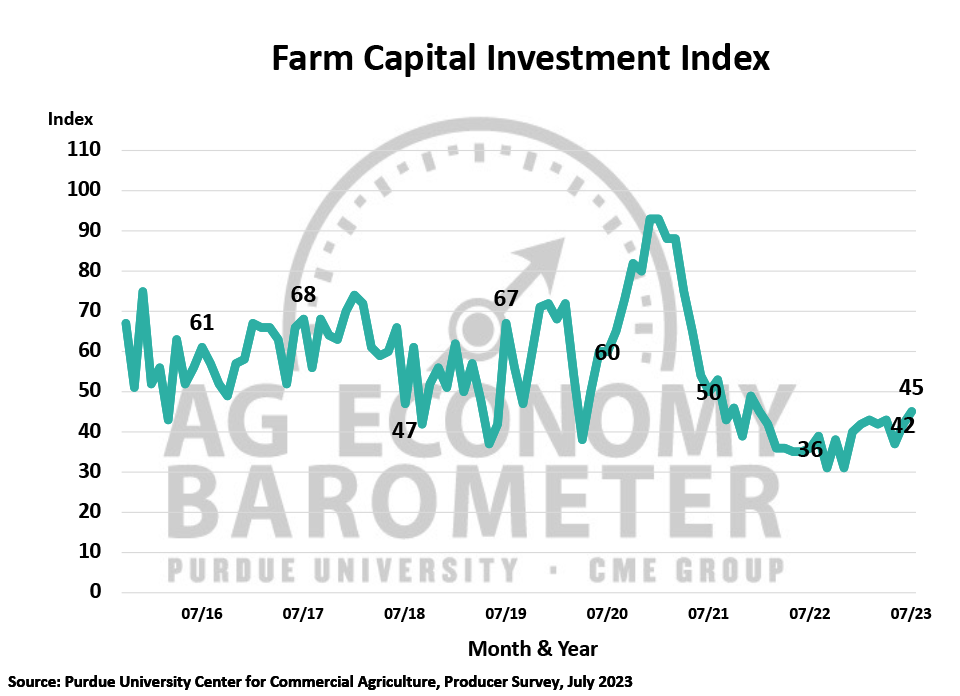
The improvement in farmers’ perspective on current conditions spilled over into a modest rise in July’s Farm Capital Investment Index of 3 points to a reading of 45. Since bottoming out at a reading of 31 in November 2022 the index has climbed 14 points and now stands 9 points above its July 2022 level. Comparing the July responses to last fall’s low point, the percentage of producers saying now is a good time for large investments has improved to 17% from just 10% and the percentage of farmers who feel it’s a bad time to invest declined to 72% vs. 79% who felt that way in November. This month’s improvement in the investment index occurred despite a rise in the percentage of producers who expect interest rates to rise over the next year. Nearly two-thirds (65%) of producers in July said they expect interest rates to increase, up from 57% who felt that way in June. Among those producers who said now is a bad time to make large investments the top reason cited for this being a bad time was concern about rising interest rates.
Farmers’ top concern for their farming operations in the upcoming year is still higher input costs, chosen by 37% of respondents in this month’s survey. The number two concern for this month’s survey respondents was rising interest rates, chosen by nearly one out of four (24%) producers followed by lower output prices chosen by 19% of farmers in the survey. Given the volatility in commodity prices, especially crop prices, this spring and early summer it’s notable that more producers expressed concern about rising interest rates than declining output prices.
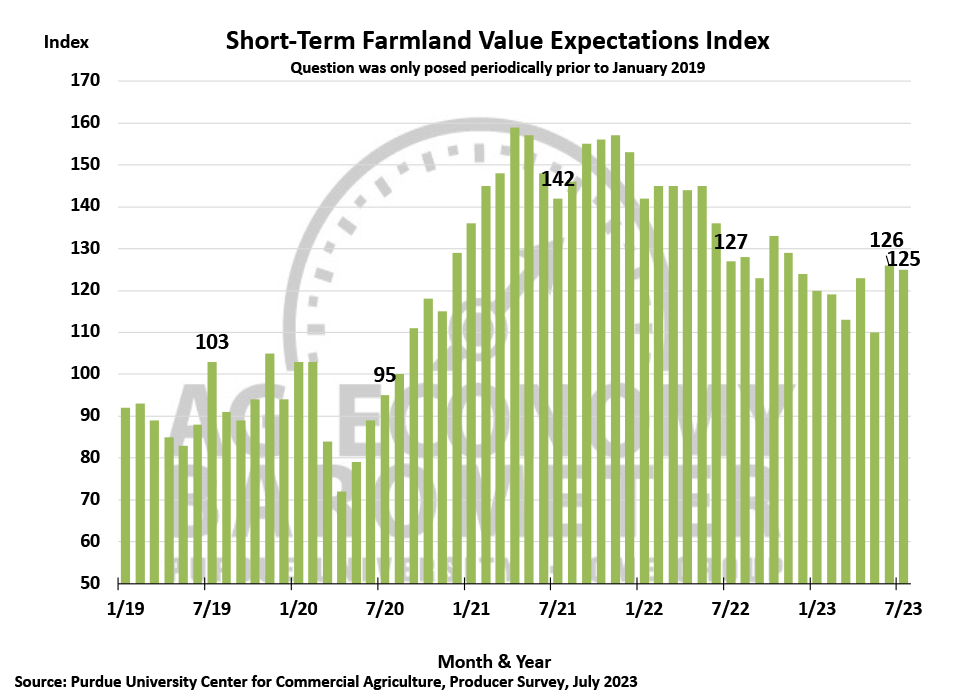
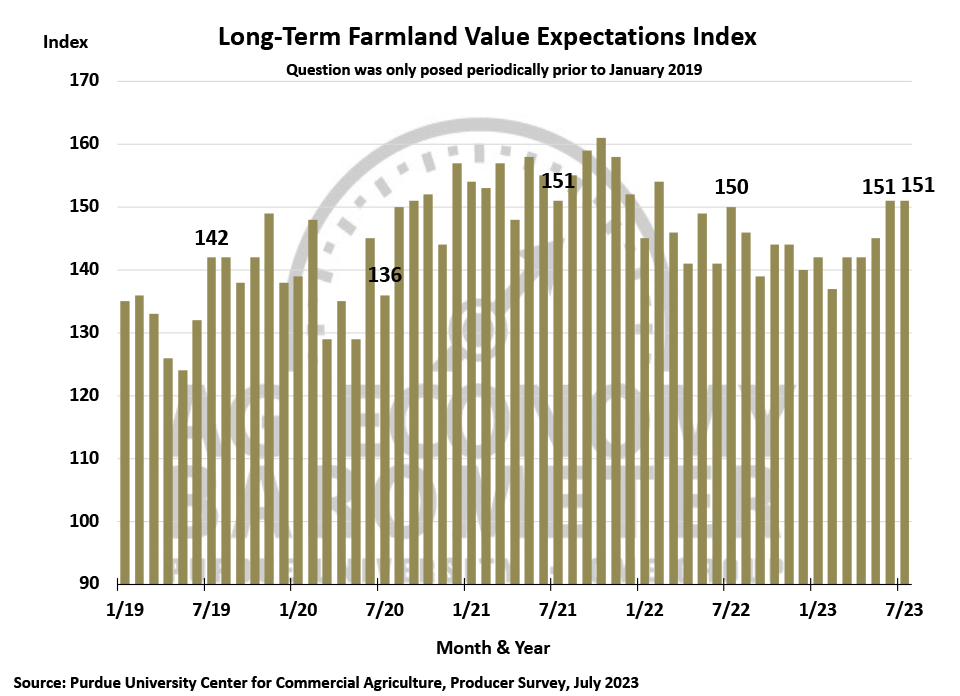
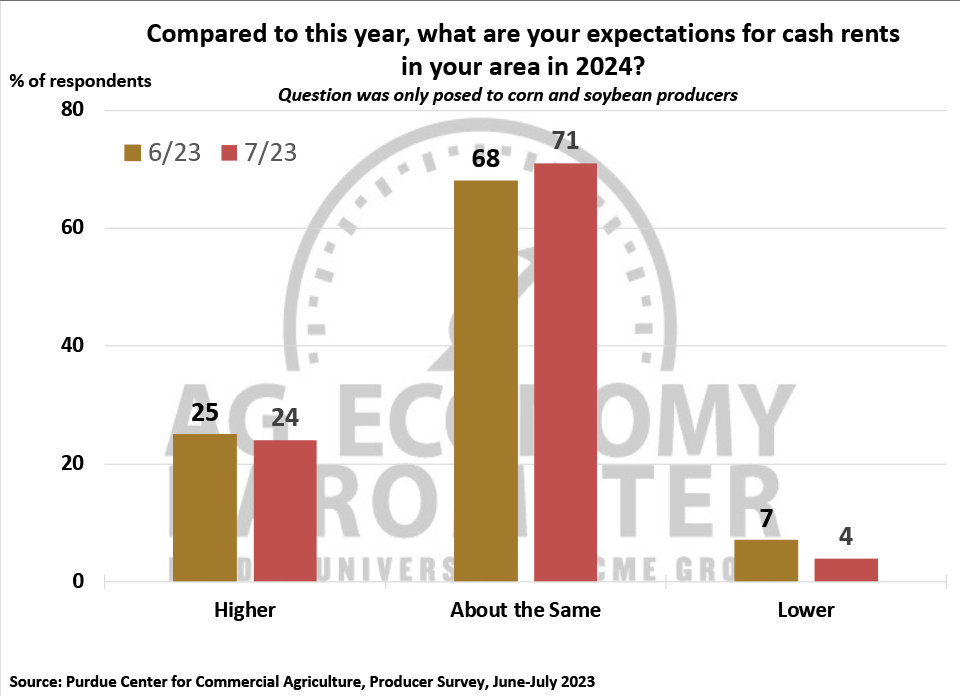
Farmers continue to be optimistic about farmland values, especially over the next 5 years. The Long-Term Farmland Value Expectations Index was unchanged in July at a reading of 151 while the short-term index was virtually unchanged, declining just one point to 125. July’s long-term index was one point higher than a year ago and unchanged compared to two years ago while the short-term index was 2 points lower than one year earlier but down 17 points compared to two years ago. Confidence among farmers regarding the future direction of farmland values continues even though nearly two-thirds of survey respondents expect interest rates to rise over the next year. Once again, corn and soybean producers were also queried about their farmland cash rental rate expectations for 2024. Similar to last month, nearly one-quarter (24%) of respondents expect rental rates to rise compared to 2023 while just over 7 out of 10 (71%) of producers look for no change in rental rates.
This month’s survey included several questions about crop farmers’ perspectives on cover crop usage. Forty-five percent of corn/soybean farmers in this month’s survey indicated they currently use cover crops. This compares to a range of 41 to 57% of respondents who reported having planted cover crops in 2021 and 2022 barometer surveys. Among cover crop users, the two most commonly cited reasons for using cover crops were to improve soil health and erosion control which were chosen by 65% of this month’s respondents. This was consistent with prior barometer surveys in 2021 and 2022 when the percentage of producers choosing soil health and erosion control as their motivation for using cover crops ranged from 58 to 70% of respondents. When asked to describe their experience using cover crops, four out of five (80%) farmers who reported using cover crops said it improved soil health and yields and 15% of respondents said cover crops improved soil health, but did not improve yields. In prior barometer surveys, a range of 74 to 84% of respondents said cover crops improved soil health and yields while 9 to 18% of respondents said it improved soil health, but not yields.
Wrapping Up
Farmer sentiment improved modestly in July as producers became more confident about the current situation on their farms and this was reflected in an improved outlook on making large investments in their farming operation. Producers also continue to be optimistic about future farmland values, especially when asked to look ahead five years. Top concerns for farmers in the upcoming year continue to be high input costs followed by rising interest rates and the risk of lower prices for crops and livestock. Nearly one-fourth of corn/soybean producers expect farmland cash rental rates to rise in 2024 compared to 2023 while 7 out of 10 producers look for no change in 2024’s rental rates.