


Strong Commodity Prices and Improved Financial Conditions Boost Ag Economy Barometer
James Mintert and Michael Langemeier, Purdue Center for Commercial Agriculture
A breakdown on the Purdue/CME Group Ag Economy Barometer March results can be viewed at https://purdue.ag/barometervideo. Find the audio podcast discussion for insight on this month’s sentiment at https://purdue.ag/agcast.
Download report (pdf)
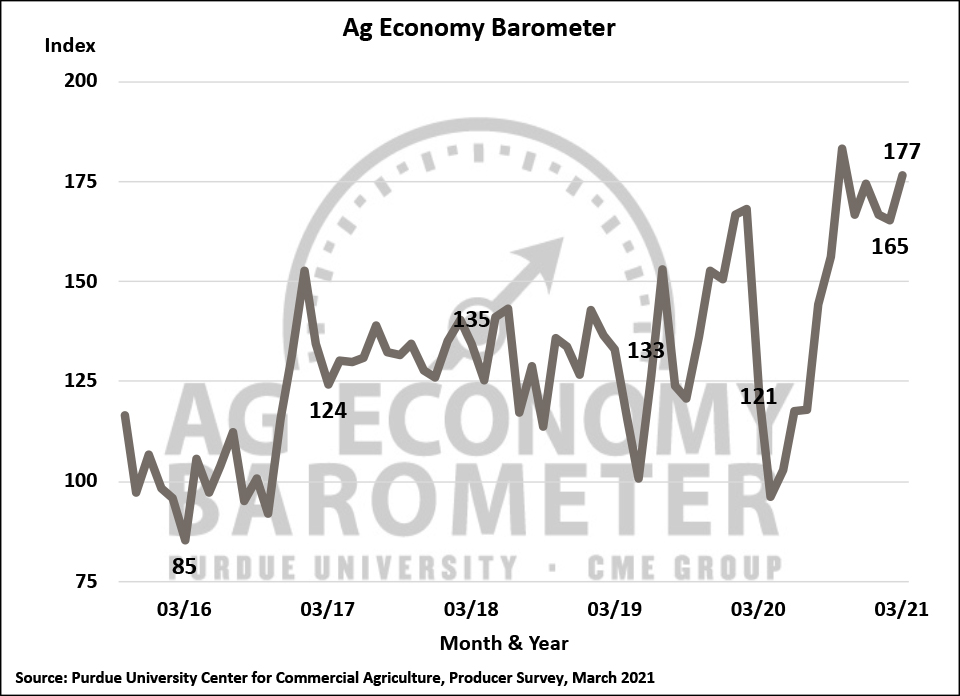
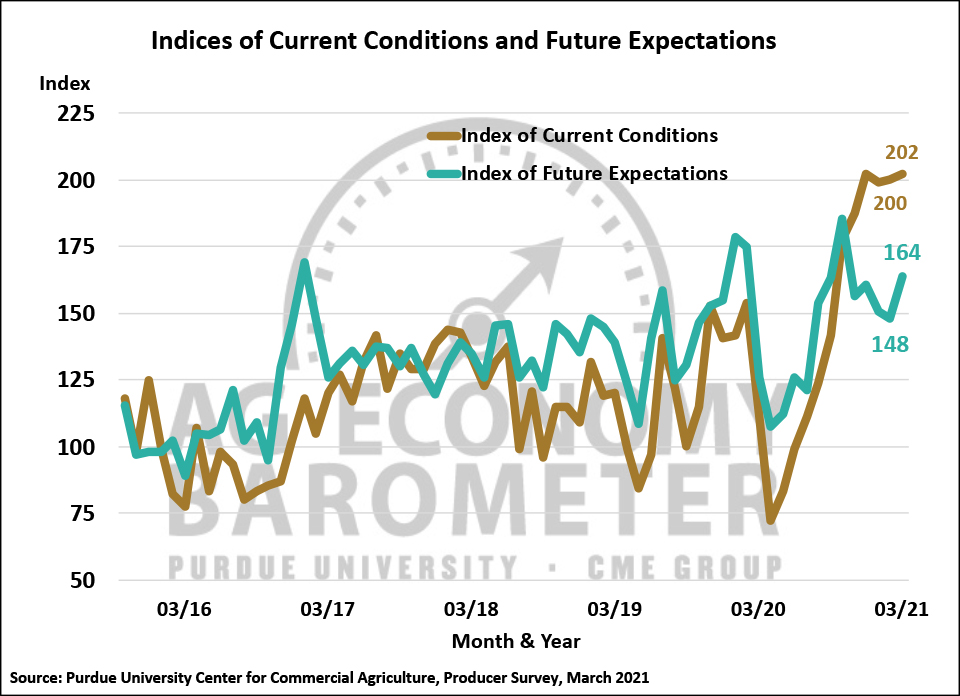
The Ag Economy Barometer rose in March to 177, the highest reading for the barometer since the record high reading of 184 in October. This month’s 12-point rise in the barometer was attributable almost entirely to ag producers’ more optimistic view of the future as the Index of Future Expectations climbed to 164, 16 points above February’s index. Although the Index of Current Conditions, at 202, changed little from a month earlier when it stood at 200, it did mark a return to the index’s record high, first reached in December. Strong ag commodity prices and improved farm financial conditions continue to support the Ag Economy Barometer readings as we head into spring. The Ag Economy Barometer is calculated each month from 400 U.S. agricultural producers’ responses to a telephone survey. This month’s survey was conducted from March 22-26, 2021.
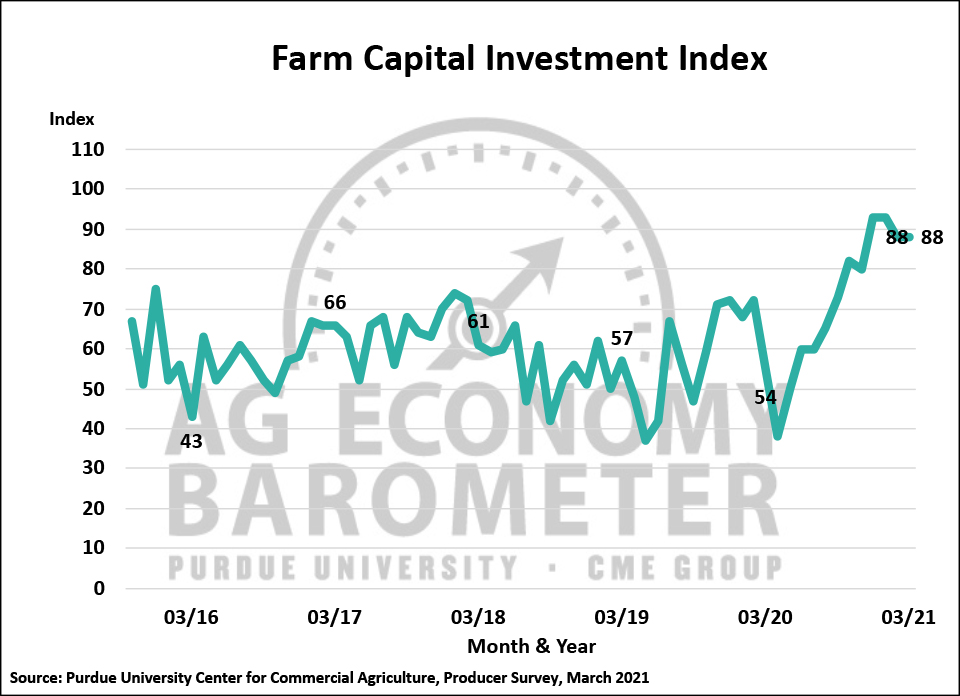
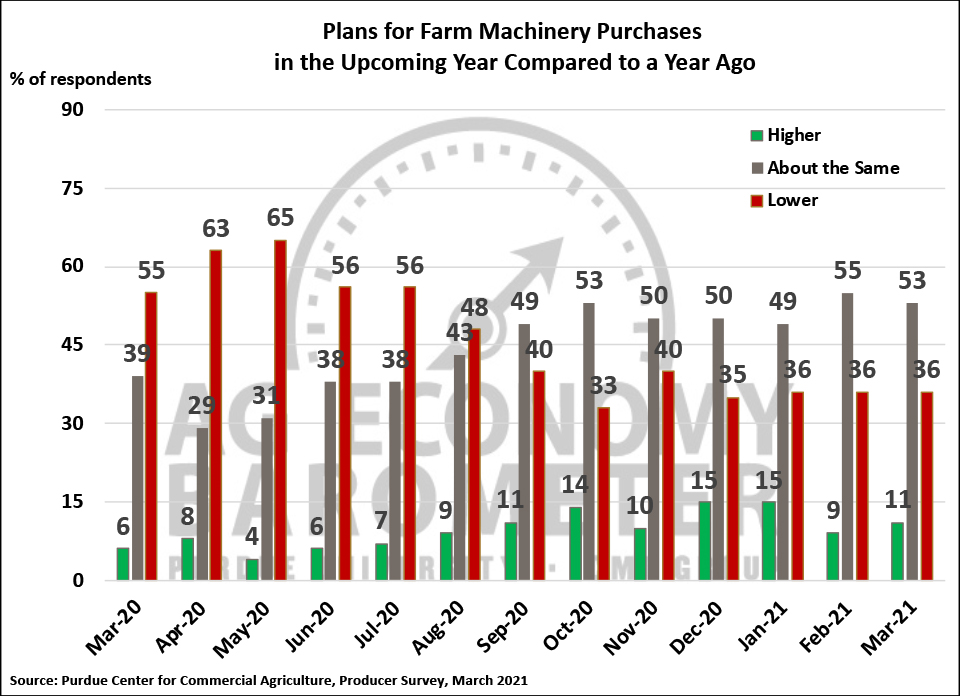
The Farm Capital Investment Index was unchanged from a month earlier at a reading of 88, remaining just 5 points below its all-time high of 93. What a difference a year can make. A year ago, farmers’ confidence in the ag economy was plummeting and the investment index stood at just 54. This month’s investment index is 63 percent higher than it was in March 2020. Producers were a bit more optimistic in March about their upcoming farm machinery purchase plans, with the percentage of farmers planning to increase purchases rising two points vs. February to 11 percent as the percentage planning to hold their purchases constant dipped two points to 53 percent.
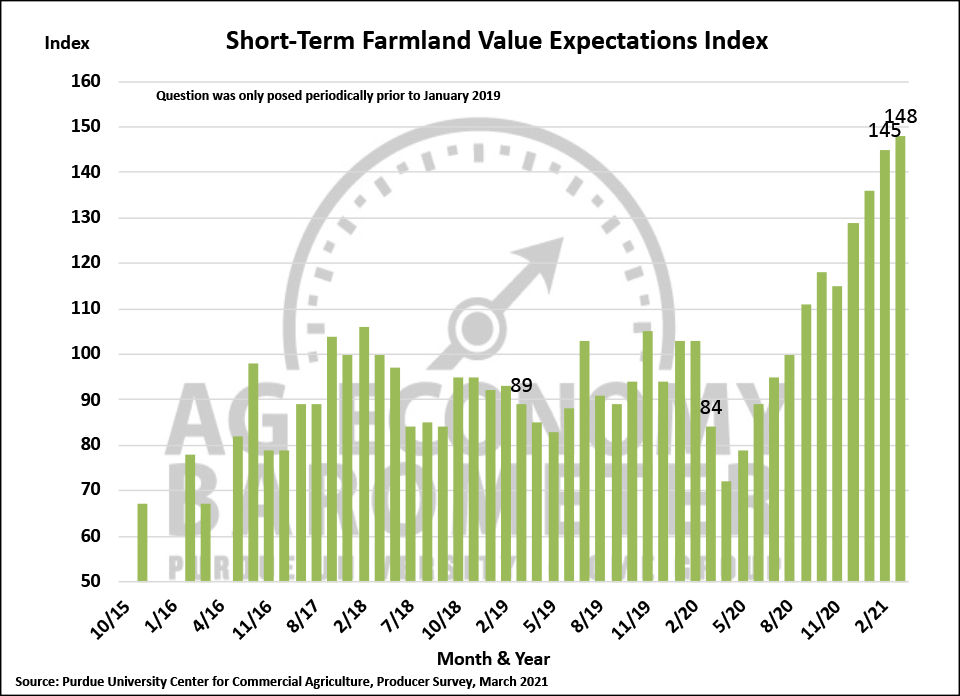
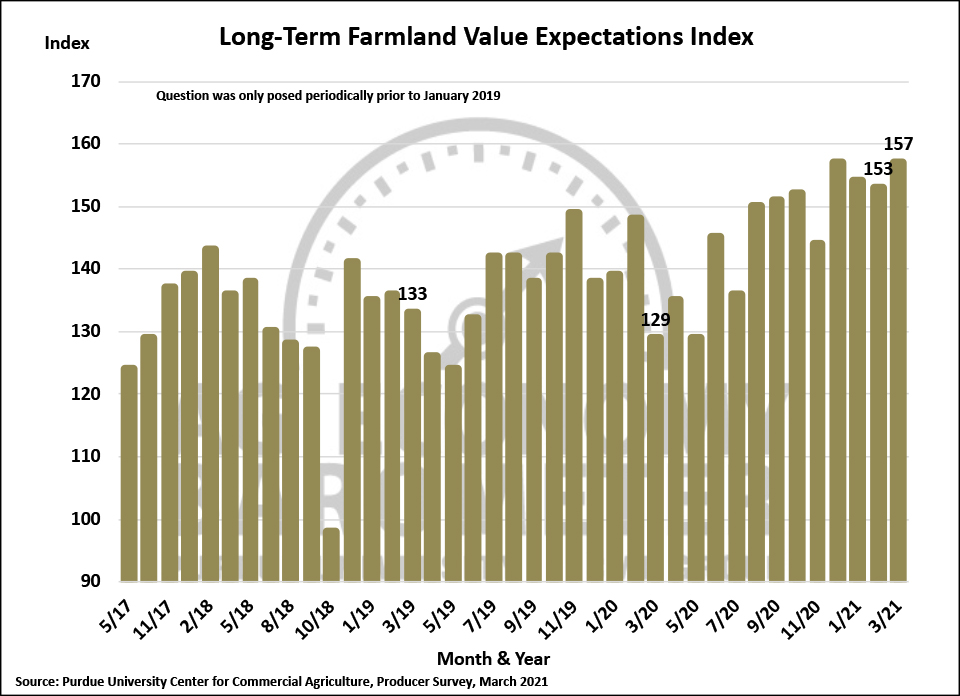
Producers’ bullish perspective on farmland values continued in March. Responses to questions asking survey respondents about their short-term (12-month ahead) and long-term (5-years ahead) farmland value expectations are used to produce both Short-Term Farmland Value Expectations and Long-Term Farmland Value Expectations indices. The short-term index rose again during March to a reading of 148, 3 points higher than in February. March’s increase marked the fourth increase in a row for the short-term index which has more than doubled since bottoming out last April at 72. Producers’ long-term farmland value expectations also rose during March to a reading of 157, up 4 points from February and matching the index’s all-time high reached in December. Compared to its May 2020 low of 129, the Long-Term Farmland Value Expectations Index is up 22 percent.
Producers’ perspective on their farms’ financial position continues to improve, which appears to be fueling some of the short-term optimism about farmland values and capital investments. The Farm Financial Performance Index is based on responses to a question that asks producers “As of today, do you expect your farm’s financial performance to be better than, worse than, or about the same as last year?”. The question was first posed in April 2018 and asked again in spring 2019. Since late 2019, the question has been posed more regularly. The index bottomed out in April 2020, at a reading of 55, and then started to climb during the summer reaching a December reading of 116. Since December, the index has increased each month and, in March, hit a record high 125, up from 121 a month earlier and 8 percent higher than in December.
Although producers became more optimistic about the future this month, as indicated by the rise in the Index of Future Expectations, they were not more optimistic concerning trade with China. The percentage of producers who expect the U.S. trade dispute with China to ultimately be resolved in a way that’s beneficial to U.S. agriculture peaked in early 2020 at 81 percent. That percentage has been declining since that time and fell again this month to just 31 percent, down 7 points from February. The decline in optimism about the outcome of the trade dispute mirrors producers’ concerns about China fulfilling its Phase One trade agreement with the U.S. Back in October, 59 percent of producers said they expected China to fulfill its Phase One obligations, but that percentage has been declining continuously since last fall. In January it fell to 40 percent, in February it fell to 37 percent, and in the March survey it declined again with only 35 percent of producers expecting China to fulfill the Phase One agreement.
In a follow-up to questions on previous barometer surveys regarding carbon sequestration, approximately 30 to 40 percent of farmers in our surveys over the last three months say they are aware of opportunities to receive payments for capturing carbon on their farms. Among the relatively small percentage of respondents who reported carbon sequestration payment rates that were offered, approximately 80% of those respondents said payment rates were $20 per acre or less, with about half of those indicating a payment rate of $10 per acre or less.
Wrapping Up
The Ag Economy Barometer rose 12 points in March to a reading of 177, its highest reading since October of last year. The barometer’s rise was virtually all attributable to farmer’s improved expectations for the future as the Index of Future Expectations rose 16 points above February’s reading. The improvement in future expectations occurred even though producers are becoming increasingly pessimistic that the trade dispute with China will be resolved in a way that’s beneficial to U.S. agriculture. Producers continue to be relatively optimistic about making capital investments in their farming operations and plans for farm machinery purchases in the upcoming year rose modestly compared to a month earlier. Producers also became more optimistic about farmland values as the Short-Term Farmland Value Expectations Index rose for the fourth month in a row and the Long-Term Farmland Value Index matched its previous high set back in December. Finally, approximately 40 percent of the respondents indicated they were aware of opportunities to receive payments for sequestering carbon on their farms. Among producers who reported payment rates available to them, approximately 80 percent indicated that rates were $20 per acre or less.