


Leverage and Financial Risk
Financial risk is incurred when a farm borrows money to purchase assets or operate the farm. Financial risk is caused by uncertainty pertaining to interest rates, lending relationships, changes in market value of assets used as collateral, and cash flow used to repay debt. Financial risk is often inter-related with other sources of risk, particularly production and technical, and price and market risk. For instance, when production and/or prices are relatively low, a farm is going to have more difficulty repaying loans and the market value of assets is likely going to soften and perhaps even decline in value.
Managing financial risk is an extremely broad topic. Sub-topics would include managing capital structure (i.e., mix of debt and equity capital), examining the relationship between leverage and risk, using credit reserves, liquidation costs or converting risky assets to cash, using self-liquidating loans, and fixed interest rates. The discussion below focuses on the relationship between leverage and financial risk.
Leverage is typically measured with the debt to asset ratio. On average, leverage on U.S. farms is likely to increase for two reasons. First, relatively low net farm income in the 2015 and 2016 will likely have a dampening impact on farm asset values. Second, the relatively low net farm income will make it more difficult to repay debt in a timely manner. Total debt on U.S. farms has increased from $278.9 billion in 2010 to $367.4 billion in 2015, a 31.7 percent increase (USDA-ERS, 2015). In the last year alone, debt has increased $21.7 billion or 6.3 percent. Debt be categories as non-real estate and real estate debt. Non-real estate debt and real estate debt increased 6.1 percent and 6.5 percent, respectively, in the last year (USDA-ERS). Though the debt to asset ratio in 2015 for U.S. farms is still relatively low (12.8 percent), farms with below average equity and above average debt could see a relatively large change in their debt to asset ratio in the next couple of years. It is worth noting that the average debt to asset ratio for U.S. farms increased from 11.7 to 12.8 percent in the last year.
Now that we have established that the debt to asset ratio for farms is likely to increase, let’s address a fundamental question. Does leverage help or hinder? Answering this question is really quite difficult and depends on two related questions. First, is a farm’s return on equity higher than return on assets? If return on equity is higher than return on assets, leverage is working for you. Conversely, if return on equity is less than return on assets, leverage is working against you. In this situation, a farm would have been better off not borrowing the money. Second, what is your tolerance for risk? Leverage increases both variability in returns and downside risk. A farmer that is risk averse will take this into account when evaluating the use of debt. A farmer that is risk neutral, on the other hand, will simply examine the relationship between return on equity and return on assets. If return on equity is higher than return on assets this farmer will borrow money. A farmer that is risk averse will take into account risk aversion and the relationship between return on equity and return on assets before borrowing money. The more risk averse the farmer is the less likely he or she will be to borrow money.
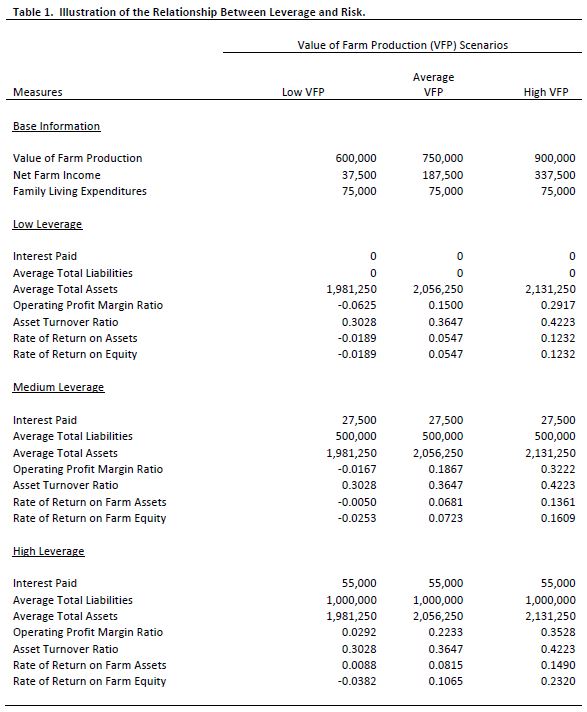
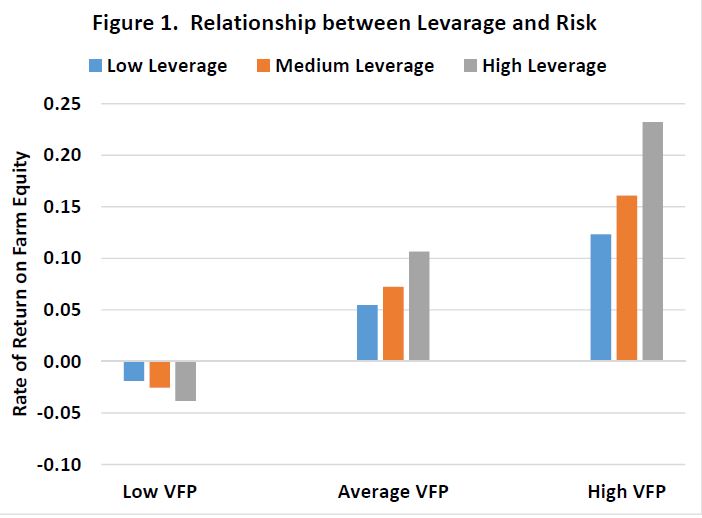
Table 1 and figure 1 illustrate the impact of leverage on the rate of return on farm equity for three value of farm production (VFP) scenarios. VFP is a commonly used measure of accrual gross income on farms. The average VFP scenario represents average profitability and financial efficiency for this case farm. The low VFP scenario assumes that revenue for the case farm is 20 percent lower than average while the high VFP scenario assumes that revenue is 20 percent higher than average. Costs were assumed to be same for each VFP scenario. Retained earnings were computed by subtracting family living expenditures from net farm income. The resulting retained earnings for each VFP scenario were then added to ending total assets, which was used to compute average total assets. Three leverage levels are illustrated: low leverage (0 percent debt to asset ratio), medium leverage (25 percent debt to asset ratio), and high leverage (50 percent debt to asset ratio). Interest paid and average total liabilities vary among the leverage levels. As shown in table 1 and figure 1, the rate of return on farm equity for the high leverage level is considerable more variable than the rate for the low and average leverage levels. The rate of return varied from -0.0189 to 0.1232 for the low leverage level, from -0.0253 to 0.1609 for the average leverage level, and from -0.0382 to 0.2320 for the high leverage level. Another important thing to note in table 1 is that for this case farm under the average and high VFP scenarios leverage had a positive impact on the rate of return on farm equity. Specifically, under these two VFP scenarios, rates of return increased as leverage increased. However, it is also important to note that under the low VFP scenario, rates of return decreased as leverage increased.
This article described financial risk and illustrated the impact of leverage on financial performance. Leverage was found to increase the variability of the rate of return on farm equity. For the case farm, leverage had a positive impact on the rate of return on farm equity for a high VFP scenario. The impact of leverage was negative for a low VFP scenario. As margins remain tight in production agriculture, it is important for farms to carefully assess their use of debt as well as changes in debt levels resulting from lower asset values and increased difficulty repaying loans.
Reference
United States Department of Agriculture, Economic Research Service. U.S. Farm Sector Financial Indicators, November 24, 2015.