


Leverage and Interest Rate Risk
Financial risk is incurred when a farm borrows money to purchase assets or operate the farm. Financial risk is caused by uncertainty pertaining to interest rates, lending relationships, changes in market value of assets used as collateral, and cash flow used to repay debt. Financial risk is often inter-related with other sources of risk, particularly production and technical, and price and market risk. For instance, when production and/or prices are relatively low, a farm is going to have more difficulty repaying loans and the market value of assets is likely going to soften and perhaps even decline in value.
Managing financial risk is an extremely broad topic. Sub-topics would include managing capital structure (i.e., mix of debt and equity capital), examining the relationship between financial leverage and risk, using credit reserves, liquidation costs or converting risky assets to cash, using self-liquidating loans, and managing changes in interest rates. The discussion below focuses on the relationship between leverage and interest rate risk. A previous article (farmdoc daily February 12, 2016) discussed a related topic, the relationship between leverage and financial risk.
Changes in interest rates impact the expected rate of growth of equity. Two case farms (Farmer A and Farmer B) are used to illustrate the sensitivity of the growth rate of equity to changes in net returns and interest rates. Both farms have total assets of $2,000,000; family living expenses of $75,000; and face a 25 percent tax rate on farm income (income tax and social security tax). The farms differ by their debt structure. Farmer A has a debt to asset ratio of 25 percent while Farmer B has a debt to asset ratio of 50 percent.
Before examining the sensitivity of the growth rate of equity to changes in net returns and interest rates, we first need to illustrate how the growth rate of equity is computed. Table 1 illustrates the computation of the growth rate of equity for Farmer A under a scenario in which the net income on assets (net income divided by total assets) is 10 percent and the interest rate is 5 percent. Under these conditions, net income on assets is $200,000; after-tax income is $131,250; addition to retained earnings (i.e., the growth in equity measured in dollars) is $56,250; and the growth rate of equity is 3.75 percent.
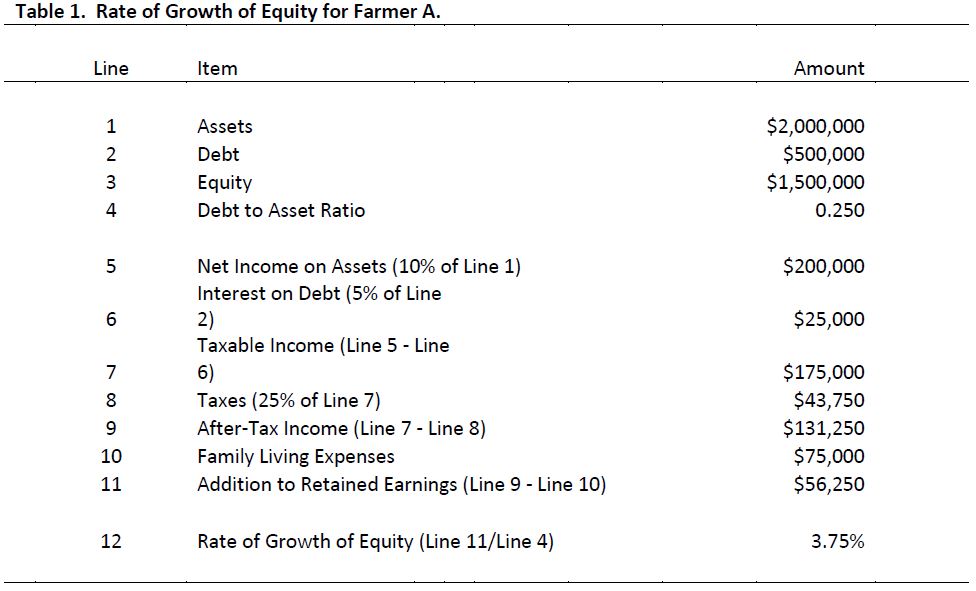
Table 2 illustrates the sensitivity of the growth rate of equity to changes in net income on assets and interest rates. In this table, r is net income divided by total assets and i is the interest rate. A relatively large increase in interest rates is used for illustrative purposes. Three levels of net income on assets are presented. The highest rate (r = 0.15) represents rates earned by farms in the top quartile in terms of financial performance. The median rate (r = 0.10) represents an average long-term rate of return. The lowest rate (r = 0.05) represents a below average long-term rate of return. The lowest rate was typical of rates of return from 2000 to 2006, while the median rate is typical of the period from 2007 to 2013. The lowest rate also conveys typical rates of return from 2014 on. The conceptual framework in table 1 was used to compute the growth rate of equity. It is important to note that the debt to asset ratio varied between the two farms. Asset levels, tax rates, and family living expenses were assumed to be the same for each farm.
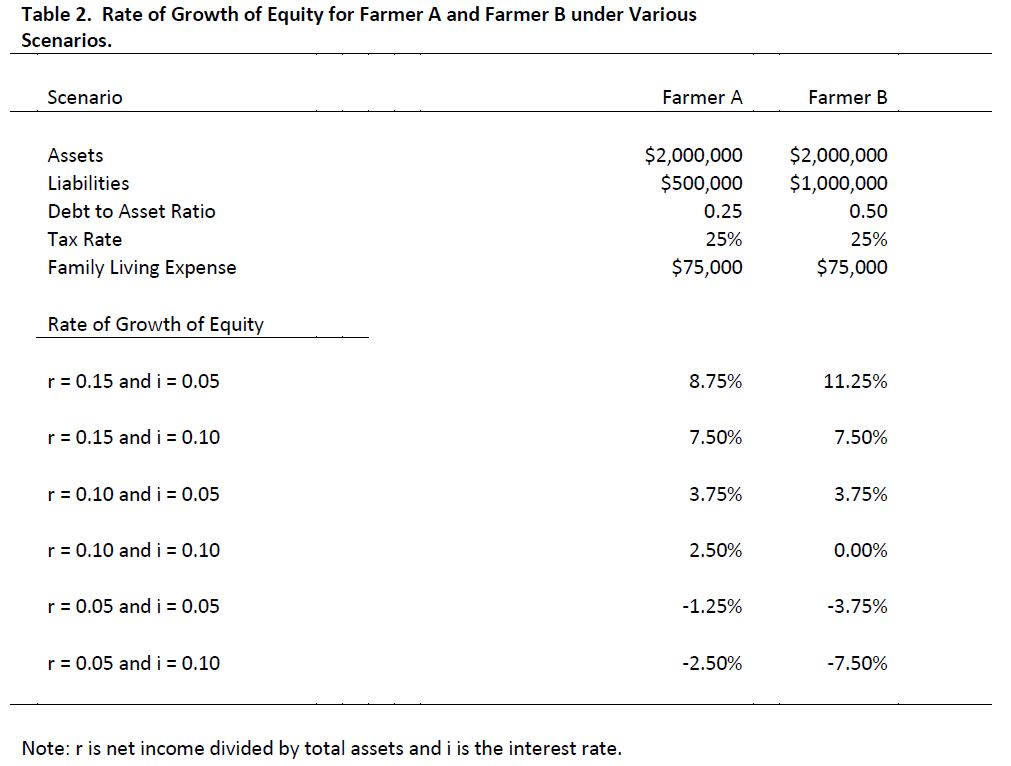
The increase in interest rates caused the growth rate of equity to drop 1.25 percent for Farmer A, and 3.75 percent for Farmer B under each scenario for r. The larger drop in the growth rate for Farmer B is directly related to its higher degree of leverage. As was illustrated in a previous article (farmdoc daily February 12, 2016), leverage has a positive impact on additions to equity when rates of return are larger than the interest rate, and a negative impact when rates of return are smaller than the interest rate. For instance, under the r = 0.15 and i = 0.05 scenario, Farmer B had a larger growth rate of equity. Conversely, under the r = 0.05 and i = 0.05 scenario, Farmer A had a smaller decline in the growth rate of equity. Note that the growth rate of equity was negative for all of the r = 0.05 scenarios indicating that equity declined under these scenarios. Obviously, if returns were lower than 0.05, equity would decline even more than that depicted for the r = 0.05 scenario.
This article described financial risk and illustrated the impact of a change in interest rates on the growth rate of equity. An increase in the interest rate has a large adverse impact on the growth rate of equity. The impact is particularly harmful for farms with more leverage and under a scenario where rates of return are relatively low, which has been the case in the last couple of years. Obviously, it is very important to carefully monitor capital structure (i.e., solvency), particularly in the current economic environment.
References
Langemeier, M. “Leverage and Financial Risk.” farmdoc daily (6):28, Department of Agricultural and Consumer Economics, University of Illinois at Urbana-Champaign, February 12, 2016.