School Referenda for Operating Costs and Capital Projects in Indiana, 2008-2018
December 19, 2019
PAER-2019-14
Larry DeBoer, professor of agricultural economics
![]()
![]()
![]()
![]()
![]()
Indiana school districts can ask their voters to approve referenda to raise property tax rates for capital projects or added operating expenditures. Since 2008, we’ve seen an average of 18 school referenda per year. Referenda have become a regular part of the electoral landscape.
Prior to November 2008 operating referenda were rare and capital projects referenda were not required. The Indiana General Assembly passed the capital projects referendum requirement in 2008, as part of the big property tax reform. Indiana joined 47 other states with a referendum requirement. All local governments must ask voters to approve property tax rates to repay borrowing for most big infrastructure projects. The law has been amended since 2008, and now capital projects go to a vote if their cost is more than $15.5 million and if 500 property owners or registered voters sign a petition asking for a referendum.
Prior to 2008, Indiana used a unique petition-remonstrance system. Proponents and opponents of a bond issue competed to acquire signatures on petitions, and the side with the most signatures prevailed. Most capital projects were never challenged, however, so the referendum requirement was seen as a property tax control measure. It was an added barrier to imposing taxes for debt service. There have been a few capital projects referenda for non-school projects (for example, a jail in Jay County, a hospital in Indianapolis), but almost all of the capital projects referenda have been proposed by school districts.
School districts are the only local governments in Indiana that can propose referenda to raise property tax rates for school operating costs. Prior to 2008, this option was seldom used. If fact, between 2002 and 2008 there were six tax referenda and only three passed. After 2008, tax referenda became much more common.
From Fall 2008 through November 2018 there were 188 referenda proposed by Indiana school districts, and 118 passed, which is 63%. Of those referenda, 76 were to authorize tax rates to pay debt service on borrowing for capital projects, and 42 passed (55%). The other 112 were tax referenda for operating costs, and 75 passed (67%). By the 2018 budget year, school districts levied $315 million in property taxes passed by referendum, which was 4% of total property tax levies. Debt service accounted for $138.4 million and general operating costs for $176.3 million. Referenda levies rose by $66 million from 2017 to 2018, which was 23% of the total property tax levy increase of $291 million.
The 188 referenda were proposed by 114 school districts. There are 289 public school districts in Indiana, so 39% have proposed referenda and 61% have not. Seventy-five different school districts have passed referenda, which is 26% of all districts; 29 districts have passed more than one referenda, and 85 have passed just one.
Taxes passed by referenda are exempt from the circuit breaker tax caps. If a referendum passes, even taxpayers whose tax bills are otherwise capped must pay the added tax rate. This also means that taxes passed by referendum cannot subtract revenue from other local government units that overlap the school district.
Has the referendum requirement for capital projects slowed the growth of school debt service?
From 2000 to 2008, property tax levies for school debt service increased an average of 8.4% per year. From 2008 through 2018, the average has been 2.3% per year. The referendum requirement probably played a role in this slower growth.
However, school property tax and budget growth slowed across the board. Non-debt levies, not including the general fund, increased 7.0% per year from 2000 to 2008, and just 1.8% per year since then. Several other trends were at work. The Great Recession and slow recovery may have discouraged school corporations from raising the burden on their taxpayers. This could have happened under the petition-remonstrance system as well.
The new market value-in-use assessment system includes assessed value trending, which captures property value declines that result from recessions. The old true tax value system did not reflect such property value declines. Lower assessed values increase the tax rate required to raise any particular levy.
State and local government bond interest rates were near record lows throughout the 2008-18 period, meaning that any borrowing required less debt service (though lower interest rates also could have encouraged schools to issue more debt).
It seems likely that the referendum requirement helped to cause slower growth in school debt, but it was one of several factors.
Why has the use of operating referenda increased?
The capital project referenda requirement was new in 2008, but school corporations could propose operating referenda before that. As of 2008, there were four school corporations with operating referenda funds; by 2018, the number was 46.
One possible reason for the increased use of operating referenda was the slow growth in other revenues. The 2008 reforms replaced general fund property taxes with added state aid, but the recession and subsequent tax cuts have slowed the growth of revenues to fund this aid. In addition, the circuit breaker property tax caps have reduced the property taxes that schools collect. School tax cap losses were $3 million in 2008 and $253 million in 2018. All told, total appropriations from all revenues, after tax cap losses and not including referenda funds, increased 3.1% per year from 2000 to 2008, but only 0.8% per year from 2008 to 2018.
It seems likely that the slower growth of other revenue sources helped cause the increase in proposed operating referenda.
Which school corporations propose referenda?
Referenda are proposed in every election, yet only 39% of public school districts have proposed at least one referendum since November 2008. Most school corporations have never tried.
We can look for evidence by comparing the characteristics of schools that have and have not proposed referenda. The table shows some school district characteristics that seem to matter.
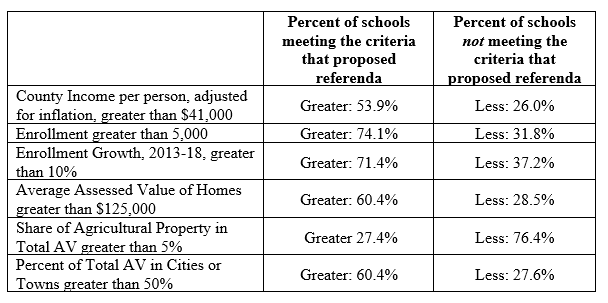
Table 1. the percentage of districts that proposed referenda, under six characteristics.
The table shows the percentage of districts that proposed referenda, under six characteristics. For example, 53.9% of districts in counties with per person incomes greater than $41,000 proposed referenda. Only 26% of districts in lower income counties tried.
The table illustrates the characteristics of school districts that tend to propose referenda. They tend to have higher incomes, bigger enrollment, more rapid enrollment growth, higher valued homes, less agricultural property, and more property in cities or towns. Clearly, there is a rural/urban divide. Suburban or urban districts with higher incomes, higher home values and more rapid enrollment growth have proposed more referenda. Rural districts with lower incomes, more farmland and more property outside of cities or towns have proposed fewer referenda.
What factors affect whether a referendum passes or fails?
Since November 2008, 62.8% of referenda have passed. Again, we can compare the characteristics of school districts and referenda for evidence about why they pass or fail. The table shows some characteristics that seem to matter.
The first three characteristics in the table are under the control of the proposing school district. Districts can choose the year and election to propose a referendum, and can choose to try again, after passing or failing. These choices appear to matter. Before 2014 less than half of all referenda passed. In 2014 and since more than three-quarters have passed. Referenda proposed in the May primary elections have passed more frequently than those proposed in the November general election. And referenda are more likely to pass when school districts have tried before, compared to the first try.
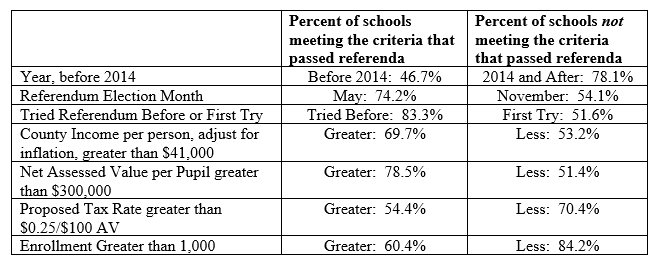
Table 2. the percentage of districts that proposed referenda, under six characteristics (before and after 2014).
November general elections attract voters interested in national or statewide races. They may be unaware of the referendum on the ballot. In May primary elections turnout is lower, so voters motivated to vote for the referendum may predominate. Referenda have passed more frequently in May. Referenda also pass more frequently after the first try. School leaders appear to learn from experience, win or lose, and apply the knowledge to campaigns the next time around.
Referenda proposed by school districts in counties with higher incomes per person are more likely to pass. Referenda proposed in districts with more net assessed value per pupil also are more likely to pass. Net assessed value is property value available to tax, after deductions are subtracted. The proposed tax rate matters as well. Referenda are more likely to pass when the proposed tax rate is $0.25 per $100 assessed value or less.
It seems that a greater ability to pay, measured by income or wealth, encourages voters to support referenda. A lower tax rate means lower cost to the taxpayer, which also seems to appeal to voters.
School districts with total enrollments of 1,000 or less have proposed 19 referenda, and 16 have passed, many by large margins. Very small school districts sometimes claim that without the revenue from the referendum, the district will have to merge with another, bigger district. Voters appear to value their small local districts, even at a higher cost.
Why have referenda been passing more frequently?
Referenda have been passing more frequently in recent years, as shown in the figure. Four out of five passed in November 2008, the very first election with capital projects referenda. After that, passage rates dropped to under 50% of referenda in 2009 and 2010. The percentage of referenda passed rose in 2012 through 2015. In 2016 and since, more than 80% of referenda have passed each year.
The economy was emerging from a deep recession in 2009 and 2010. We’ve seen a slow but steady expansion since then. Perhaps voters become more willing to vote for higher taxes as their abilities to pay have increased with growing employment and income.
Let’s test that hypothesis. Unemployment rates measure the business cycle. Before November 2011 all county unemployment rates were above 6%. Since December 2016 all have been below 6%. Let’s look at only those years when some county unemployment rates were high, and others were low—from November 2011 to November 2016. Let’s also look only at first-time referenda, to eliminate the influence of experience. There were 45 first-time referenda proposed during that period. Where the unemployment rate was above 6 percent, 59% passed. Where the unemployment rate was below 6 percent, 65% percent passed. That’s a small difference. The economy may not be an important explanation for the increase in referenda passage. We can test this conclusion only when the next recession arrives.
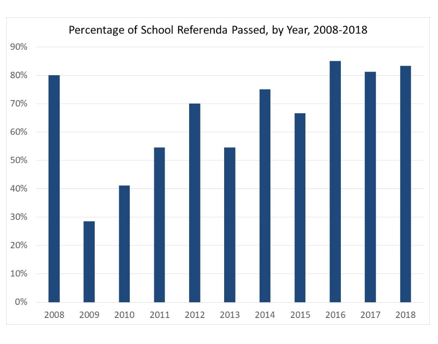
Figure 1. Percentage of School Referenda Passed, by Year, 2008-2018
School districts gain experience in their first referendum campaigns that may help them win passage in subsequent campaigns. Let’s look at school districts that tried again after losing, to eliminate other characteristics that contribute to passage. And let’s pick only the second tries that were two years or less after the first, to lessen the effect of changing conditions in the district. There have been 16 such second referenda, and 9 passed. That’s a high passage rate after starting 0 for 16. Experience from the first try may have increased the overall passage rate.
There is evidence that school referenda are passing more often because of school district experience. Evidence is not strong that the improving economy is increasing passage rates.
Do operating cost referenda lessen school spending equalization?
Incomes and wealth vary considerably among school districts. But since general fund spending per pupil is largely funded by state aid and distributed by formula, it varies much less. School spending is equalized if it does not vary much with income and wealth.
School districts with lower incomes and lower property values are less likely to propose referenda, and less likely to pass referenda when they try. This could result in higher spending per pupil in wealthier districts, so that spending would be less equalized.
As a test, we can sort school districts by net assessed value per pupil, as a measure of taxable wealth. General fund appropriations measure spending per pupil. Appropriations are the legal authority to spend in the annual budget. The table averages the data by quartiles of net assessed value per pupil. A quartile is one-quarter of the school districts.
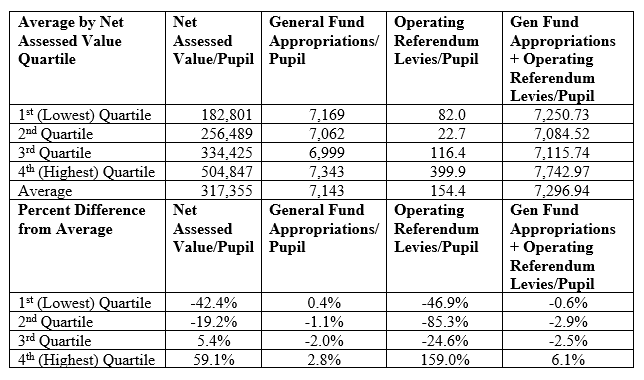
Table 3. Averages of the data by quartiles of net assessed value per pupil. A quartile is one-quarter of the school district
For example, the school districts with net assessed values per pupil in the lowest 25th percentile had average net assessed value of $182,801 per pupil. The average for all districts was $317,355 per pupil, so the lowest quartile’s figure was 42.4% below average. This is shown in the lower part of the table. The highest quartile had net assessed value per pupil 59.1% above average. The other measures are sorted by these net assessed value quartiles.
Those lowest-wealth districts had average general fund appropriations per pupil of $7,169, which was 0.4% above average, while the highest-wealth districts had appropriations 2.8% above average. These differences are far smaller than the differences in wealth. Wealthier school districts do not spend substantially more per pupil than less-wealthy districts. Appropriations are largely equalized.
Differences in referenda levies for operating costs per pupil are greater. The lowest wealth quartile levies average $82.0 per pupil, 46.9% less than average. The highest wealth quartile levies average $399.9 per pupil, 159.0% more than average. When these levies are added to general fund appropriations, the highest wealth quartile is 6.1% above average. The other three quartiles are below average.
The referenda process provides a channel for districts that want to spend more than the state aid formula provides. But because wealthier districts propose and pass more referenda, the process works against spending equalization.
References
Center for Evaluation and Education Policy, Indiana University. “Database of Indiana School Referenda.” http://ceep.indiana.edu/policy/tools_resources/DISR.html
DeBoer, Larry. “School Referenda,” Capital Comments, Agricultural Communication, Purdue College of Agriculture, December 2007. https://www.agriculture.purdue.edu/agcomm/newscolumns/archives/CC/2007/December/071227CC.htm#.XF4RW6BOmM8
Hiller, Stephen C. and Terry E. Spradlin. “School Referenda in Indiana,” Education Policy Brief, Center for Evaluation and Education Policy, Indiana University, Summer 2010. http://ceep.indiana.edu/pdf/PB_V8N2_Summer_2010_EPB.pdf
Indiana Department of Local Government Finance. “Petition/Remonstrance and Referenda Information.” https://www.in.gov/dlgf/8789.htm
![]()
![]()
![]()
![]()
![]()