What To Watch in Dairy Markets in 2024?
January 16, 2024
PAER-2024-08
Nicole Olynk Widmar, Interim Department Head and Professor of Agricultural Economics


While the supply (milk production) and demand for milk and dairy products are clearly the fundamentals of the dairy marketplace, there are a number of other economic and socioeconomic factors impacting milk markets. Inflation is front of mind for U.S. households and volatility in energy prices alongside uncertainty in housing and other necessity costs has put increasing pressure on household budgets, potentially prompting changes in buying behavior surrounding grocery store item purchases, decisions for eating at-home versus away-from-home, and challenging purchasing power of U.S. households for both consumables and durable goods.
Spending on food away from home has long been part of the conversation surrounding demand for various dairy products. Cheese is a significant component of pizza, for example. And, many of us routinely consume more butter and cheese in meals away from home than those we cook ourselves. The USDA, Economic Research Service (ERS) released in July 2023 the graphic showing food away from home versus at home since 1960 (See https://www.ers.usda.gov/data-products/chart-gallery/gallery/chart-detail/?chartId=58364) . The impacts of COVID-19 are readily visible with a sharp decline in eating out during the initial impacts of the pandemic, although by 2022 food away from home comprised 56% of total food expenditures. Inflationary pressures were lightening, but still present, as we closed 2023. How spending on food at home versus away from home changes (or doesn’t change) in 2024, especially in light of inflationary pressures increasing the costs of the food baskets purchased by households, remains to be seen.
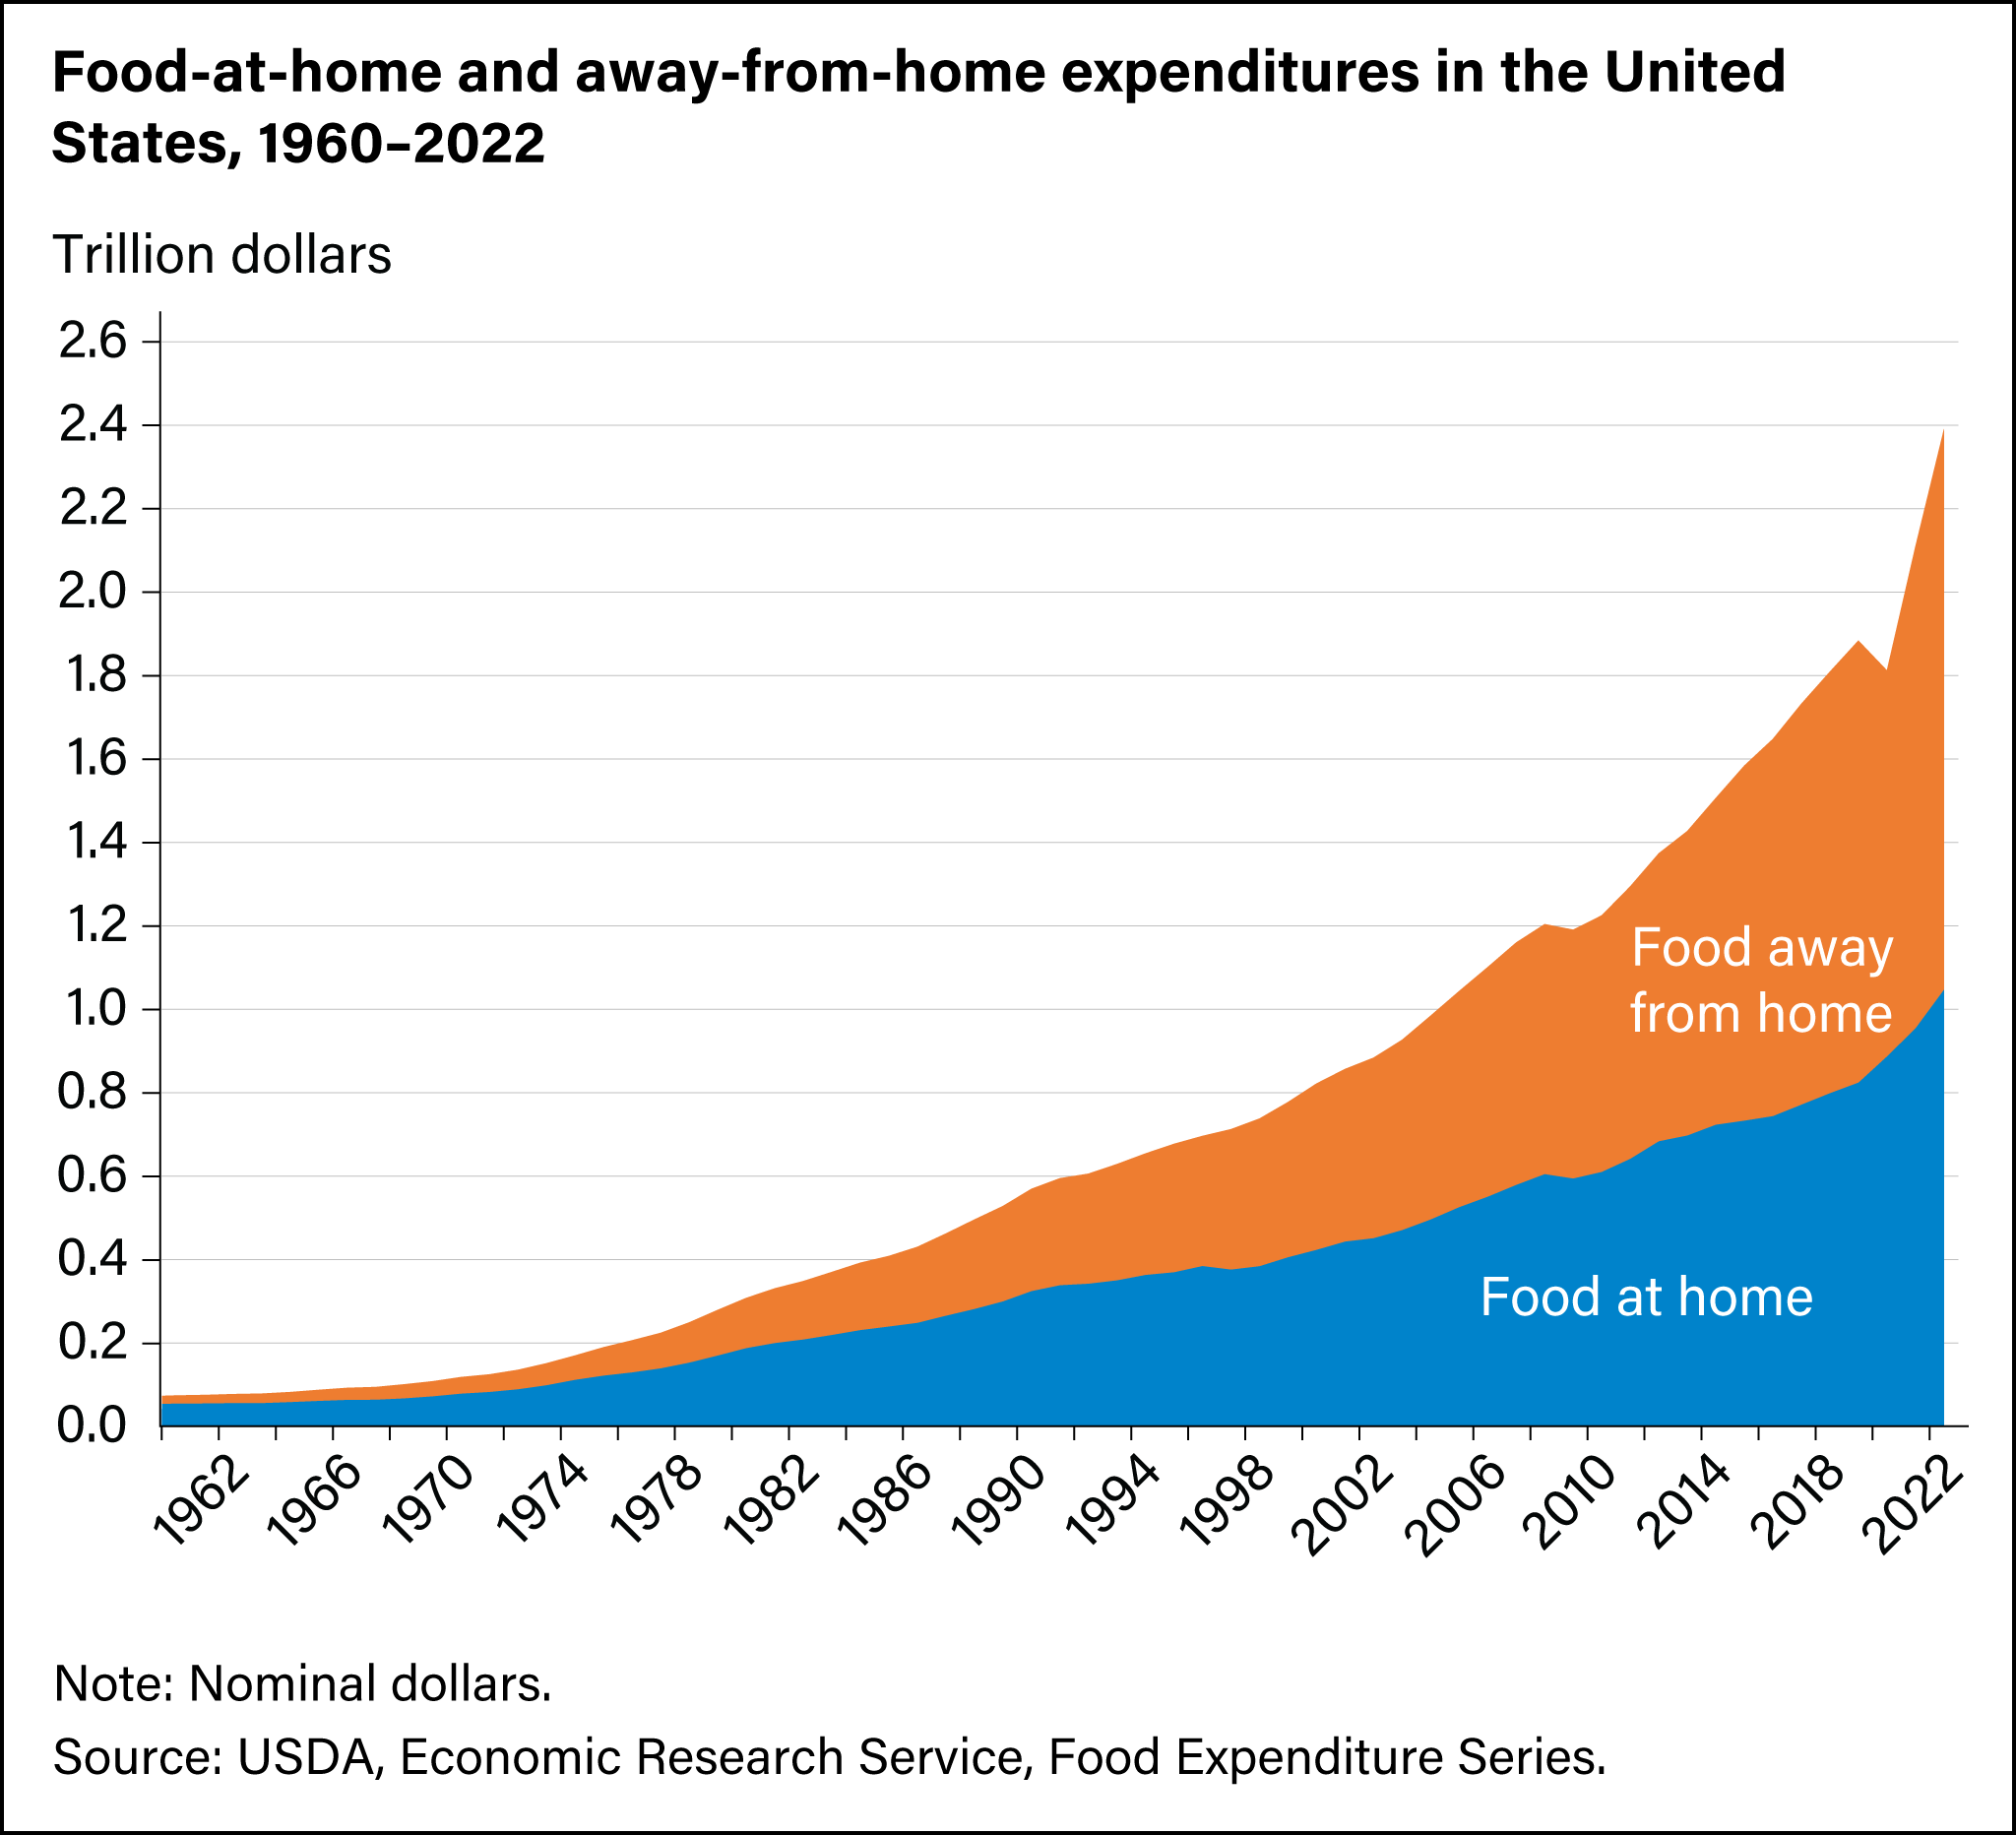
Figure 1. Food-at-home and away-from-home expenditures in the U.S., 1980-2022
Image from USDA, Economic Research Service (ERS) graphic
The end of 2023 saw downward trends in both butter and cheese prices (See USDA, ERS Livestock, Dairy, and Poultry Outlook from December 2023). Nonfat dry milk was adjusted higher, but the Class IV 2023 overall was lower to close out 2023 as the decrease in butter prices outweighed the increase in nonfat dry milk.
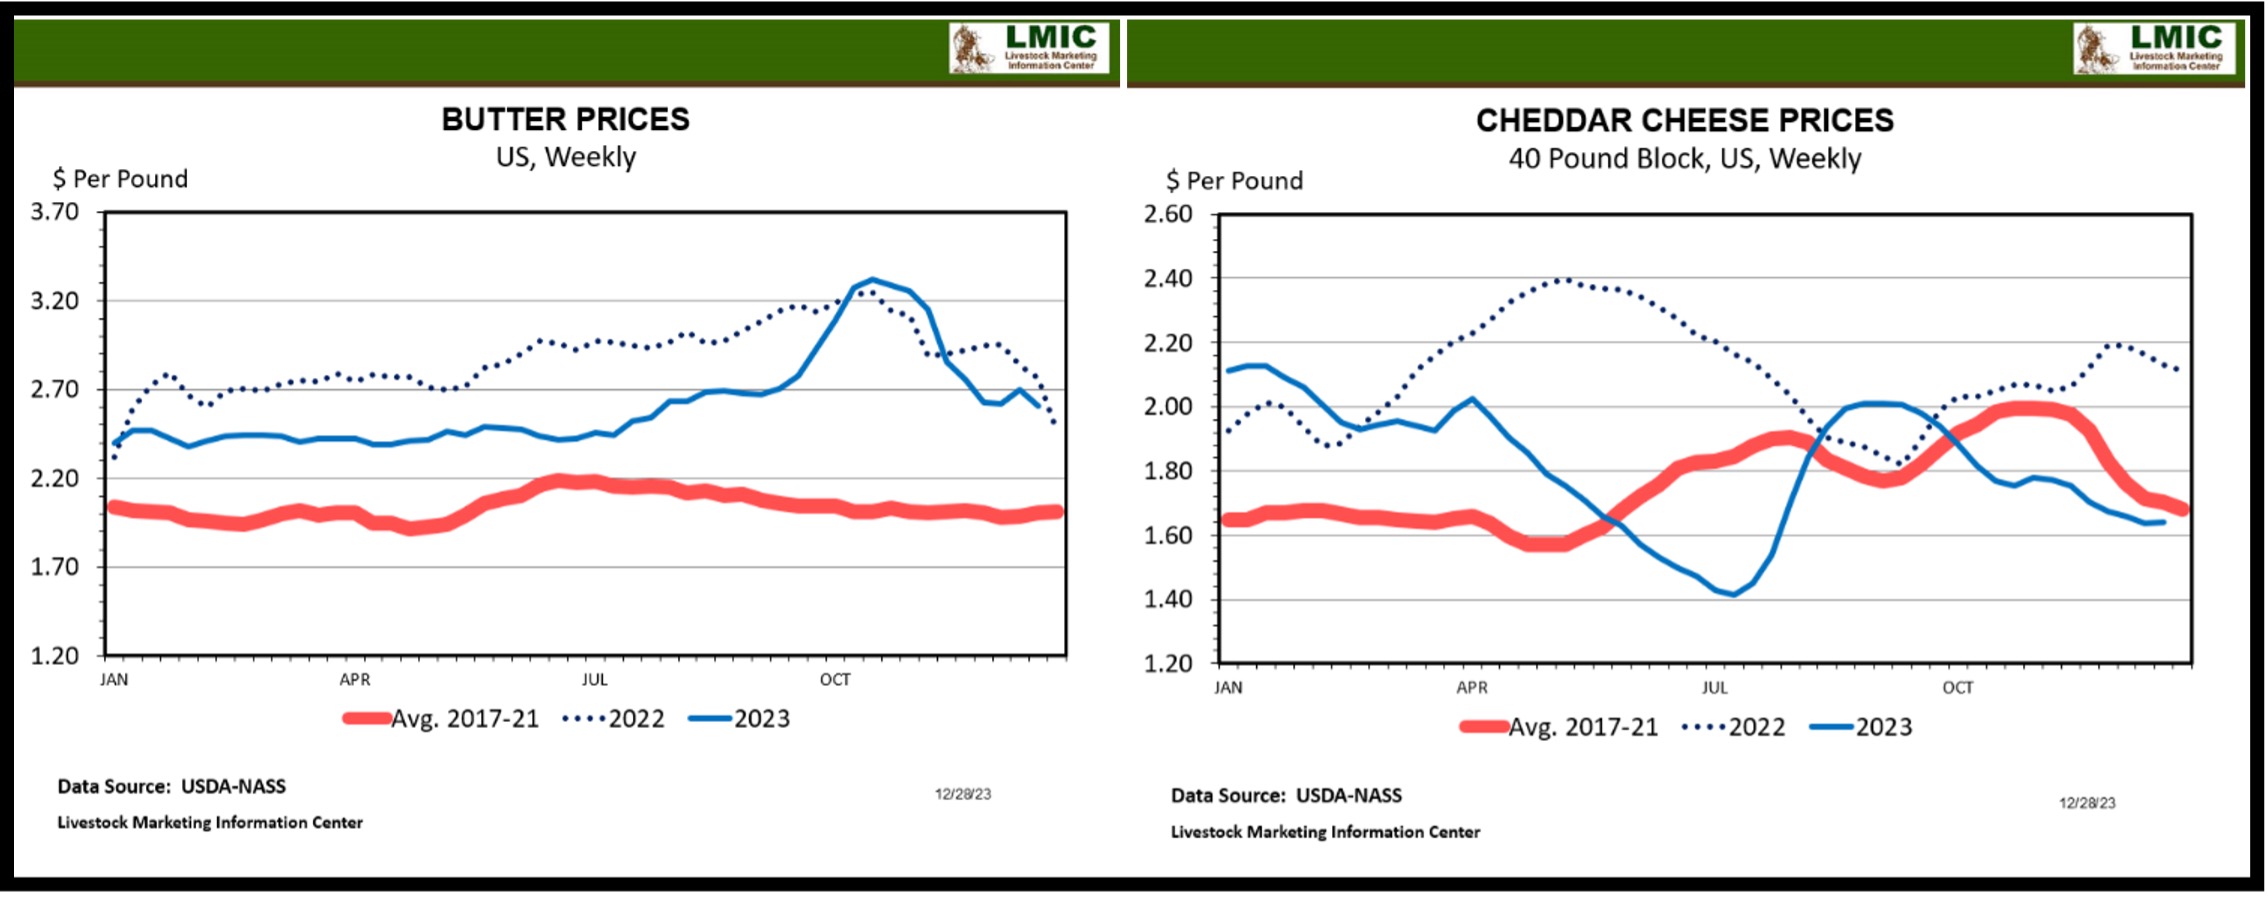
Figure 2. Butter & Cheddar Cheese Prices, per pound
Image from Livestock Marketing Information Center
The end of 2023 was marked with softening prices for many dairy products and overall lowered expectations of milk prices. Lower cheese prices are expected to persist in 2024, while butter prices are expected to be consistent to slightly higher. Following those expectations, the Class IV projection for 2024 (released by ERS in December 2023) was adjusted higher to $18.90 while the Class III price forecast for 2024 was lowered to $16.85 per cwt. Yet, the all milk price forecast for 2024 was lowered $0.55 cents from the November forecast to $20.25 per cwt.
Ultimately dairy demand remains an open-ended question on multiple fronts, both domestically and globally. Global milk supply is expected to increase very modestly, but unrest in various regions and strained trade relationships potentially hinder growth in demand for our dairy products. Taken all together we have a relatively tight supply but rather limited expectations of growth in demand; essentially the global markets sit in a somewhat precarious balance. Feed costs, labor availability and costs, and weather remain as key “factors to watch” for U.S. dairy markets in 2024. Additionally, geopolitical instability, inflationary pressures, and macroeconomic concerns broadly should be part of the 2024 watch list as they are expected to impact demand, and especially the prospects of “new” demand for dairy products.