Is farmland a good investment? Comparing risk and returns to other asset classes
August 19, 2025
PAER-2025-13
Author: Dewey J. Robertson, MS Agricultural Economics Student & Todd Kuethe, Professor of Agricultural Economics
![]()
![]()
![]()
![]()
![]()
Farmland is more than a production input; it is the largest asset in the agricultural sector. Farm real estate accounts for 83% of total U.S. farm assets and is valued at more than $3.5 trillion (USDA ERS, 2024). Farmland’s predictable, stable returns as well as its ability to appreciate over time makes it an attractive investment. Given the high commitment of owning and operating farmland, it is worth comparing how farmland as an asset compares to alternative investments. In a previous article, farmland was found to offer stable returns across most investment horizons, providing total returns comparable to equities but with far lower risk. Given recent changes in political and macroeconomic conditions, it is worth revisiting the topic to see how Indiana farmland as an asset compares to alternative investments in today’s economy.
Table 1 provides a summary of several major investment over four investment horizons (1980 – 2024, 1990 – 2024, 2000 – 2024, 2010 – 2024). Investments are evaluated primarily by their promise of return and their risk of loss. Expected returns and risks can be captured by three common measures. First, the mean represents the expected return, as a percentage, over an investment horizon. For example, ten-year treasury bonds had a mean return of 3% between 1980 and 2024, but had much higher returns (11.4%) when considering a more recent investment horizon (2010-2024). Second, the standard deviation (St.D.) represents the variation in returns over an investment horizon. The standard deviation can be considered a measure of the variability or riskiness of an investment—the higher the variation the riskier the investment. Third, the coefficient of variation (CV) is a ratio calculated as the standard deviation divided by the mean return (St.D./Mean). This ratio expresses the relationship between expected returns and riskiness of an investment. Economic theory suggests that risk averse investors are only willing to take on additional risk if they are compensated by a higher expected return. As a result, risk averse investors prefer investments with lower coefficient of variation.
Major investments in table 1 include equities, bonds, and other popular asset classes. Equities investments are comprised of two common stock indices: the Dow Jones Industrial Average (DJIA) and the Standard and Poor’s 500 (S&P500) indices. Returns for each index is calculated as the percent change in index value from the last trading day of June in one year to the last trading day of June the year prior ([((P_t-P_(t-1) ))⁄P_(t-1) ]×100). Bond investments include ten-year U.S. treasury bond (Treasury (10)) and AAA-rated corporate bonds (AAA). Bond yields are likewise calculated as the percent change of end of June trading values. Other investments analyzed are the Federal Housing Finance Agency all-transactions U.S. residential housing price index (Housing) and gold spot multi-contributor, the London Stock Exchange spot price of gold (Gold). Included at the bottom of Table 1 is the Consumer Price Index (CPI) inflation measure. As a general rule, investments should have expected returns that at least keep up with rate of inflation so as to preserve the nominal value of an investment over time.
Table 1 shows that asset classes generally follow the same patterns of return and risk. Equities (DJIA and S&P500) offer the greatest mean returns across investment horizons. However, equities are also the riskiest investments with the highest standard deviations. Bonds, on the other hand, are generally safer while yielding smaller returns.
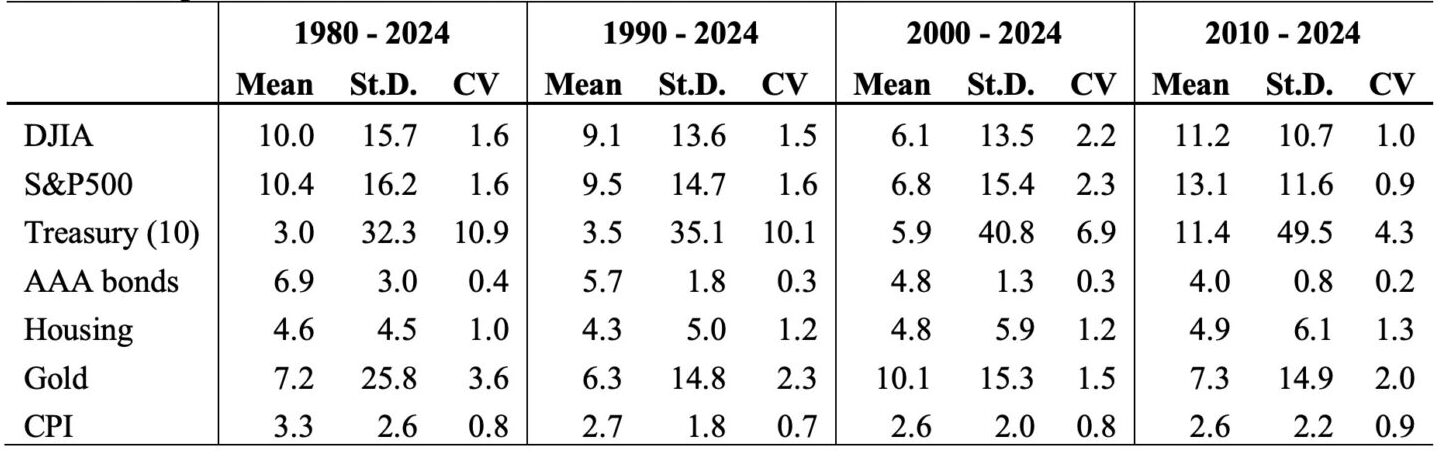
Table 1. Expected returns and risk of alternative investments
So, how does Indiana farmland compare to high-risk, high-return equities and low-risk, low-return bonds? Table 2 reports returns to Indiana farmland as captured by appreciation—that is the percent changes in farmland values obtained from the Purdue Land Values and Cash Rents Survey—for three quality grades of land (top, average, poor). Across all investment horizons, Indiana farmland values appreciate at rates below the mean returns of equities but above the returns of bonds. Indiana farmland appreciation were, in general, less risky and volatile than equities yet were considerably riskier than bonds. Interestingly, returns and risk to investing in Indiana farmland varies little by land quality. When compared to other investments, farmland is more consistent at appreciating year to year.
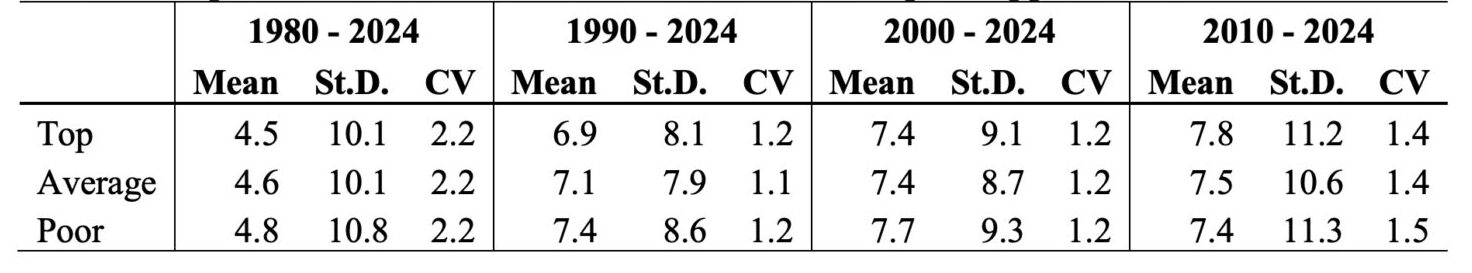
Table 2. Expected returns and risk of farmland based on price appreciation
Returns on farmland investments may be captured by land value appreciation, as discussed above, as well as by the additional gains from agricultural production that happens on the land. Table 3 reports the returns and riskiness of farmland investment that includes appreciation and production gains, captured by cash rents. Returns from cash rents, like those from farmland appreciation, tend to increase steadily over time—though they generally yield lower returns than land appreciation.
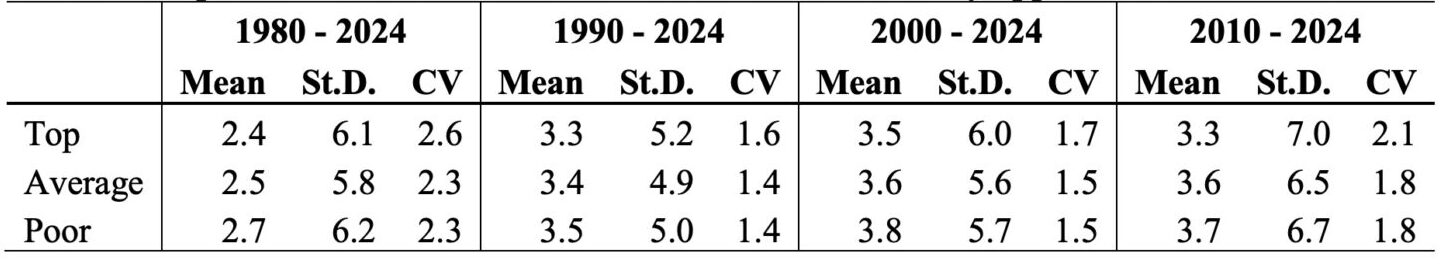
Table 3. Expected returns and risk of farmland as measured by appreciation and cash rents
Farmland as an investment is attractive not only for its returns but for the diversification it brings to an investment portfolio. Well diversified portfolios include investments whose returns are independent to the returns of other investments. It could thus be said that a diverse portfolio is one in which investment returns are uncorrelated. Assets can also prove to be a beneficial inclusion in an investment portfolio if returns are inversely correlated with other investments. In other words, if an investment increases in returns while others decrease, it helps to offset losses. Table 4 shows the correlation between farmland price appreciation and the returns of other investments. Table 4 suggests that farmland is weakly correlated with many investments, particularly equities. Moreover, farmland is inversely correlated with bond yields.
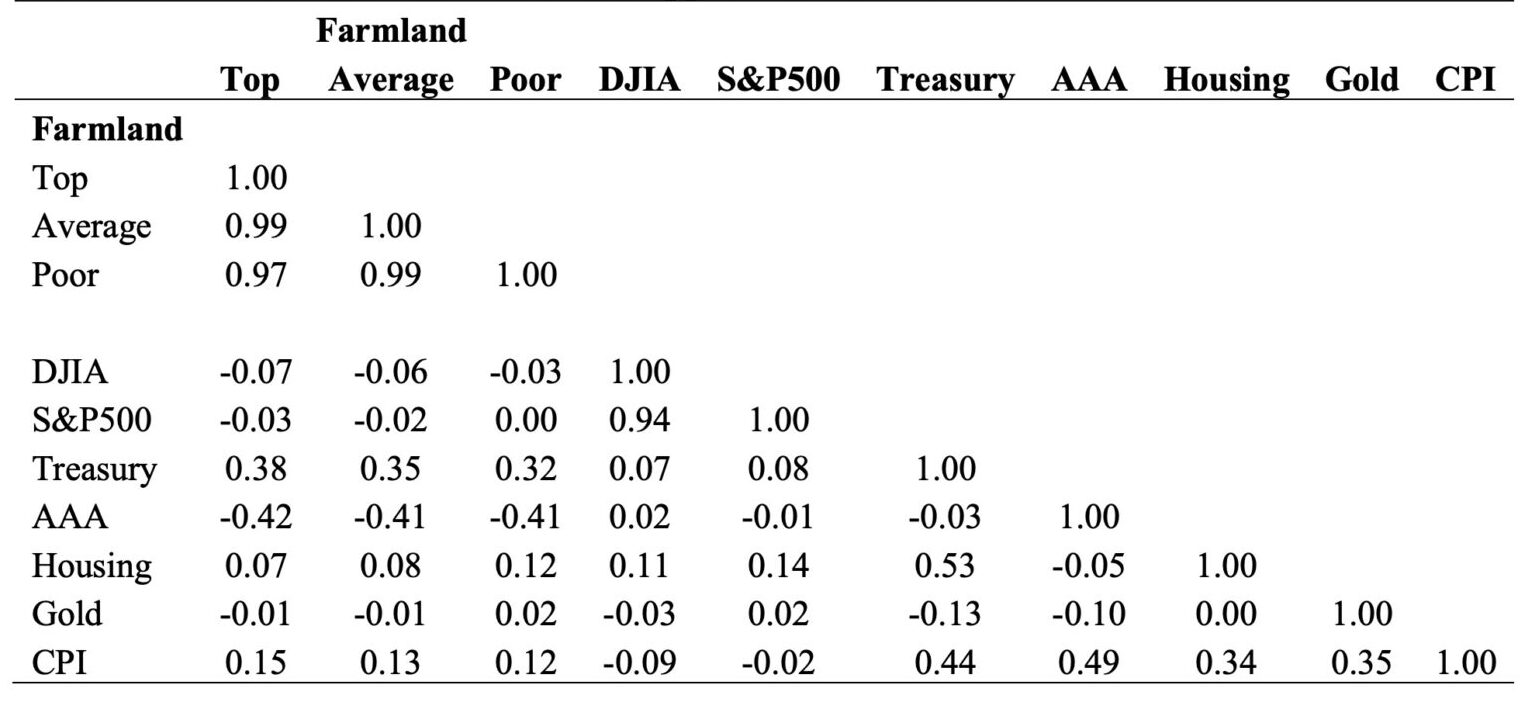
Table 4. Correlations between farmland appreciation and returns of other investments
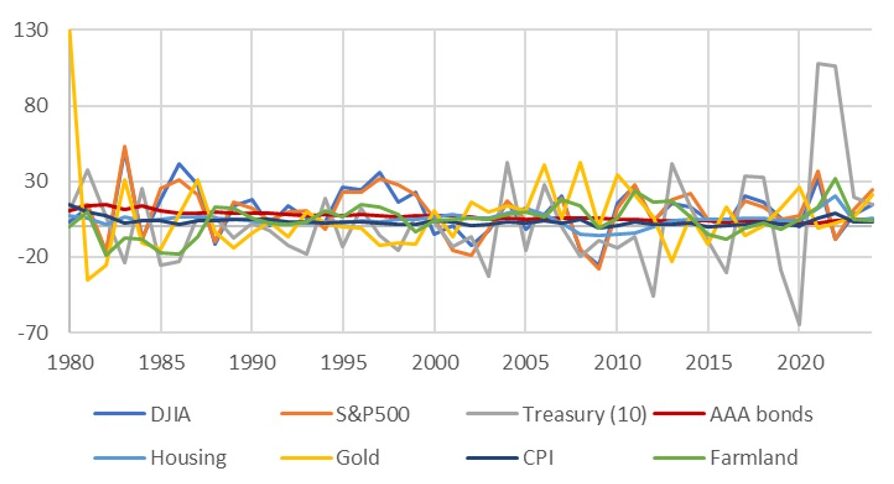
Figure 1. Farmland and Alternative Investment Returns (%)
![]()
![]()
![]()
![]()
![]()
