100 Years of Indiana Agriculture: 1895 – 1995
August 18, 1997
PAER-1997-03
Stephen B. Lovejoy, Professor
![]()
![]()
![]()
![]()
![]()
I was recently given a fascinating old book.* It was the forty-fifth annual report of the Indiana State Board of Agriculture, covering the crop years1895-96. It contains a multitude of interesting facts describing agricultural production systems in 1895. While minutes of various agricultural organizations and state-fair results are presented, the most interesting were the tables on crops produced, yields, animal numbers, and reports on experiments at the then infant Agricultural Experiment Station at Purdue University.
Hoosier farmers in 1895 produced a wide variety of crops, including corn, wheat, oats, barley, rye, flax-seed, buckwheat, sweet potatoes, Irish potatoes, and tobacco. In addition, there was a diverse orchard industry producing apples, peaches, pears, plums, cherries, quinces, and grapes.
In the late 1890s, Indiana had approximately 22 million acres classified as farmland, of which only 7.5 million were actually cropped. In contrast, in the 1990s, Indiana had 16 million acres of farmland with nearly 11 million cropped.
So while farmland acres dropped 36% in the hundred years, actual acres cropped increased from 7.5 mil-lion to 11 million, an increase of 47%. At the same time, the number of farms dropped substantially from 222,000 in 1900 down to 62,000 in 1995, a decrease of 72%. Since the decrease in number of farms was even more substantial than the decline in acres in farms, the average-size farm rose from 98 acres to 256 acres, an increase of 160%. The increase in the average cropped acres per farm was even more dramatic, going from 34 acres to 180, a 449% increase.
Table 1 illustrates the diversity of crops produced in 1895 and some of the similarities with 1995. Corn was the dominant crop in both 1895 and 1995, accounting for 48 to 49% of the cropped acres in Indiana. However, other crops show marked differences over the 100 years. Wheat acreage went from 2.7 million acres (36% of cropped acres) down to 660,000 (6%of cropped acres), and acreage in oats went from 1 million acres to 30,000. Acreage in many other crops (e.g., barley, rye, flaxseed, buckwheat, potatoes, and tobacco) was too insignificant to even report in 1995.
The two crops for which acreage increased over the 100 years were corn and soybeans. Corn acreage increased from 3.7 million to 5.3 million, and soybeans increased from 0 to 5 million acres.
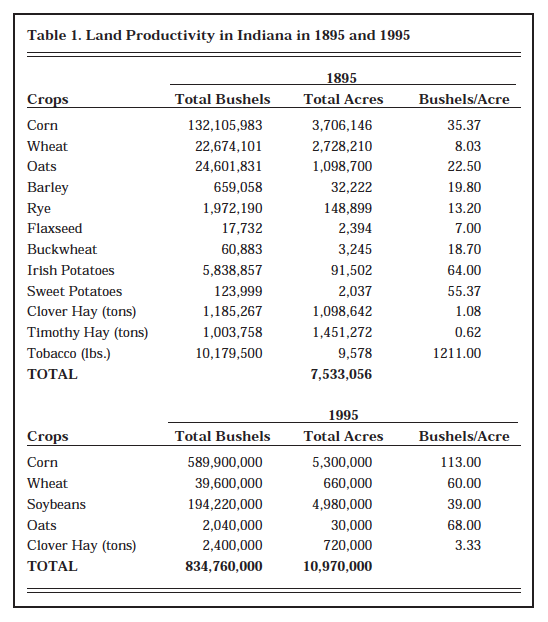
Table 1. Land Productivity in Indiana in 1895 and 1995
Table 1 also indicates the tremendous growth in land productivity. In 1895, the average corn yield was 35 bushes per acre while a hundred years later it had tripled to 113. As a result, while Indiana farmers increased corn acreage 43%, they increased total bushels produced 354%. Even more dramatic has been the increase of small grains: wheat went from 8 bu/A to 60 bu/A and oats from 22 bu/A to 68 bu/A.
In the agricultural statistics of today, we measure fruit crops by the millions of pounds produced and utilized; since the production is so small and dispersed, county figures are not provided. However, back in 1895, fruit crops were reported by the number of trees in each county. As seen in Table 2, there were more than 5 million apple trees in Indi-ana, with Harrison County having the most. Harrison County also had the greatest number of pear trees, with 4% of the state’s total of 407,000. Clark County had the largest number of peach trees and grape vines. Fruit production was clearly centered in the southern part of the state, except for cherries which were more likely to be grown in the northern counties.
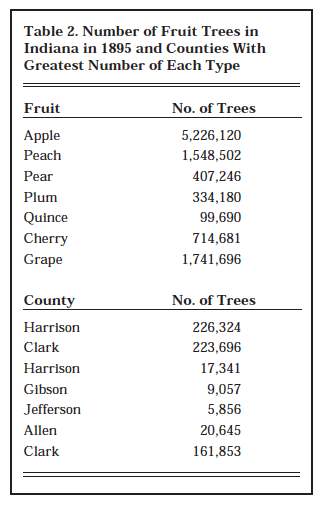
Table 2. Number of Fruit Trees in Indiana in 1895 and Counties With Greatest Number of Each Type
Livestock was a major production category in 1895, as it is today. In 1895, the report listed 1.2 million hogs under three months old and 1.5 million over three months old, with 278,000 hogs having died during the year. This contrasts with the inventory of hogs on December 1, 1995 of 4.1 million. It is difficult to compare these hog numbers since the time from birth to market has been altered substantially.
Cattle were and remain another major livestock enterprise in Indiana agriculture. In 1895, numbers of cattle were reported by breed. Table 3 indicates that Jersey and Shorthorn were the predominant pure breeds, but that the majority were classified as “other” or “milch” cows. The 1.4 million cattle inventoried in 1895 was actually larger than the 1.2 million in 1995.
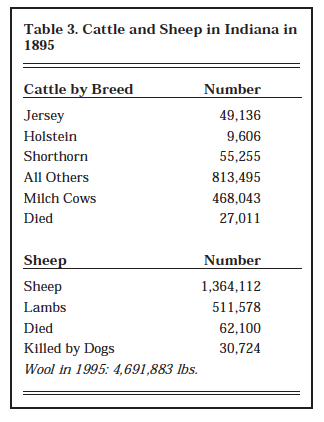
Table 3. Cattle and Sheep in Indiana in 1895
Even more dramatic was the decline in sheep and lamb numbers, from 1.4 million in 1895 to 75,000 in 1995. The 1895 report also indicated that 30,724 sheep and lambs had been killed by dogs.
Poultry enterprises were also numerous in 1895 and the number of birds was reported in terms of dozens of chickens, turkeys, geese, and ducks. There were reportedly 838,979 dozen chickens in the state in 1895 (approximately 10,080,000 birds) while in 1995 we had nearly 26 million birds. While the 1895 report did not classify chickens as layers and broilers, it did report that 30,860,797 dozen eggs were produced, or approximately 370 million eggs. In 1995, Indiana layers produced well over 5 billion eggs.
Many crops of today, as in 1895, require assistance in pollination, often through domesticated bees. In 1895, there were, reportedly, 69,998 bee colonies in Indiana while in the middle 1990s, that number had fallen to 12,000 to 13,000 colonies.
Of course, the most dramatic change in livestock over the past 100 years has been the change from ani-mal power to machine power. In 1895, there were more than 800,000 horses and mules in Indiana. Table 4 indicates that the overwhelming majority were listed as other breeds, probably mixed and undistinguishable, although about 3% were apparently purebreds. Most of these horses and mules were work animals.
The state report of 1895 indicates that Hoosier farmers owned the following types of machinery: 64,218 binders, 66,087 mowers 3,413 threshers, and 1,502 clover hullers. While the state statistician does not report the quantity of machinery in recent compilations, we can safely assume that Hoosier farmers have more self-propelled combines than binders or threshers and have more tractors than draft animals.
In 1895, while Indiana agriculture was more self-sufficient in terms of producing its own seed and fuel for the draft animals, it did purchase some inputs. Purchase of commercial fertilizer in 1895 totaled 45,000 tons, of which 15,000 tons were raw or steamed bone. In 1995, commercial fertilizer purchases in Indiana totaled well over 2 million tons, of which probably very little was raw or steamed bone.
Another interesting figure pro-vided in 1895 that is not computed today is the rods of drainage tile. The 1895 report states that 2,097,356 rods of drain tile were laid that year, bringing the total of drain tile laid in Indiana to 43,069,978 rods. So, as early as 1895, Indiana had nearly 135,000 miles of laid tile.
In addition to providing reports from the various commodity and livestock-breed associations, this 1895 book provides reports from the farmers’ reading circle and lists all the Farmers’ Institutes (county educational meetings) scheduled for 1895-96 by month (they were held in December, January, and February) along with the assigned speakers, place of meeting, and chairmen of the institutes. In December 1895, 53 two-day institutes were scheduled, and 39 in January and February. Therefore, each county in the state had an institute in that three-month period and each expected an average of 274 farmers. This meant that more than 25,000 farmers (or over 10% of all farmers) attended institutes.
These institutes contained presentations based on reports on a variety of topics, from hog cholera to hay substitutes to nutrition information to public roads.
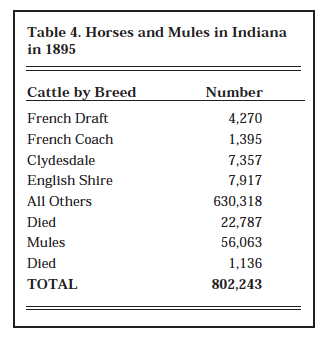
Table 4. Horses and Mules in Indiana in 1895
The 1895 report ends with Bulletins 55, 56, and 57 from the agricultural Experiment Station at Purdue University. No. 55 reports on experiments with small fruits, corn, oats, and sugar beets. These experiments included varietal research, planting-date-yield comparisons, and some limited profitability analysis.
Bulletin No. 56 reported on wheat experiments and various attempts to prevent potato scab. Bulletin No. 57 was devoted to the improvement of unproductive black soils found in central and northern Indiana. After four years of experience, the research concluded that drainage problems were the cause of the low productivity. The research report suggests some temporary methods but focuses on placement of tile drains, ditches, and wells to ensure that water-table levels were lowered to at least 42 inches below the surface.
This has been a short tour of Indiana agriculture in 1895. The changes in land use, livestock, and institutions over the past 100 years is striking. It makes us wonder how our production methods will be viewed by agriculturalists at the dawn of the 22nd century.
* The book originally belonged B. D. Latimer who was born in 1860 and died in 1900 of typhoid fever. He was a farmer and land owner in Monroe County Indiana. He owned and farmed the land which is now the site of College Mall in Bloomington Indiana. His sister, Belle Latimer Kelly was one of the first female graduates of Indiana University. B. D. Latimer’s son, Clarence was the father
of Margaret Latimer Prugh. Mrs. Prugh, who gave me this book, still lives in Bloomington near the site of the “home place”.
![]()
![]()
![]()
![]()
![]()
