2017 Indiana Crop Cost and Expected Returns
March 12, 2016
PAER-2016-04
MICHAEL LANGEMEIER, PROFESSOR OF AGRICULTURAL ECONOMICS; CRAIG DOBBINS, PROFESSOR OF AGRICULTURAL ECONOMICS
![]()
![]()
![]()
![]()
![]()
The 2017 Purdue Crop Cost and Return Guide, which is available free by downloading from the Center for Commercial Agriculture website, gives estimated costs for planting, growing and harvesting a variety of crops, as well as estimated contribution margins and earnings. The guide is updated frequently as grain futures prices change and the costs of inputs, such as seed, fertilizer, pesticides and fuel, fluctuate. This paper discusses estimates made in October 2016.
The guide presents cost and return information for low, average, and high productivity soils. The discussion in this article will focus on the estimates for average productivity soil only. Table 1 presents crop budget information for continuous corn, rotation corn, rotation soybeans, wheat, and double-crop soybeans for average productivity soil. Double-crop soybeans are typically planted after wheat so it is typical to combine the contribution margin for these two crops when comparing to continuous corn, rotation corn, and rotation soybeans. It is important to note that crop yields have been modified in this year’s guide. The current yield estimates reflect trend yields for Indiana for each crop. The contribution margin, obtained by subtracting total variable cost from market revenue, ranges from $156 per acre for continuous corn to $293 per acre for wheat plus double-crop soybeans. The contribution margins for rotation corn and rotation soybeans on average productivity soil are $211 and $261 per acre, respectively. It is important to note that the contribution margin is used to cover overhead costs such as machinery costs, family and hired labor, and land rent. Failure to cover these overhead costs typically puts downward pressure on cash rents.
From 2010 to 2013, the contribution margin for rotation corn was higher than the contribution margin for rotation soybeans. The average difference in the contribution margin was approximately $50 per acre during this period. However, since 2014, the average difference in the contribution margin has been an advantage to soybeans of about $80 per acre. The higher contribution margin for rotation soybeans in 2017 versus rotation corn as shown in Table 1, is expected to encourage some shifting of acres from corn to soybeans.
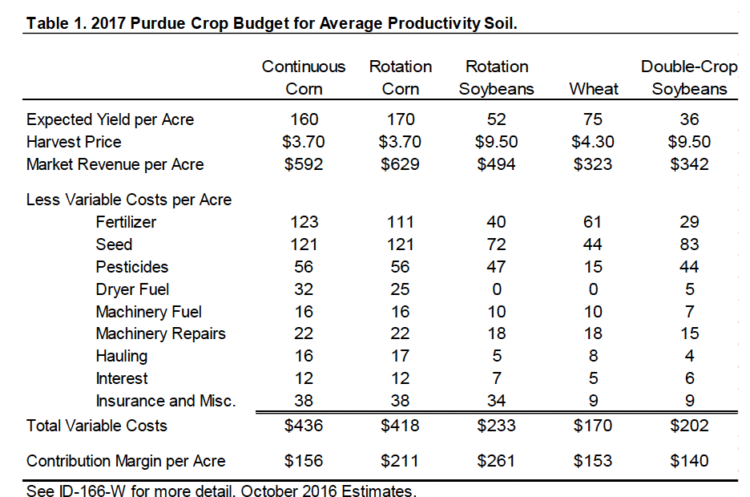
Table 1. 2017 Purdue Crop Budget for Average Productivity Soil.
Figure 1 illustrates the trends in fertilizer, seed, pesticide, and cash rent costs for rotation corn on average productivity soil from 2007 to 2017. Fertilizer cost peaked in 2013 at $176 per acre. In 2017, fertilizer cost per acre is projected to be $111 per acre. Cash rent per acre peaked in 2014 at $232 per acre at $194 per acre, 2017 projected cash rent is approximately $40 per acre lower than it was at the peak in 2014. Pesticide cost per acre in 2017 are expected to be higher than in 2013 and 2014, this is partially due to resistant weed problems.
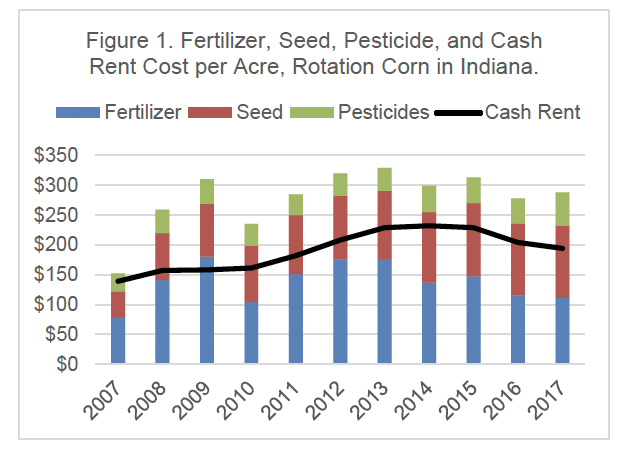
Figure 1. Fertilizer, Seed, Pesticide, and Cash Rent Cost per Acre, Rotation Corn in Indiana.
Gross revenue (market revenue plus government payments), variable cost, and fixed cost per acre for rotation corn on average productivity soil is illustrated in Figure 2. Variable cost per acre peaked in 2013 at $462 per acre, and is projected to be $418 per acre in 2017. Fixed cost (overhead cost) per acre peaked in 2015 at $375, and is projected to be $337 per acre in 2017.
The breakeven price needed to cover variable and fixed costs varied from $4.89 to $4.98 per bushel from 2013 to 2015. In 2016, the breakeven price declined to $4.56 per bushel. The projected breakeven price for 2017 is $4.44 per bushel. Gross revenue for rotation corn has declined from $945 per acre in 2013 to $629 per acre in 2017. The expected loss per acre for rotation corn in 2017 is $126 per acre.
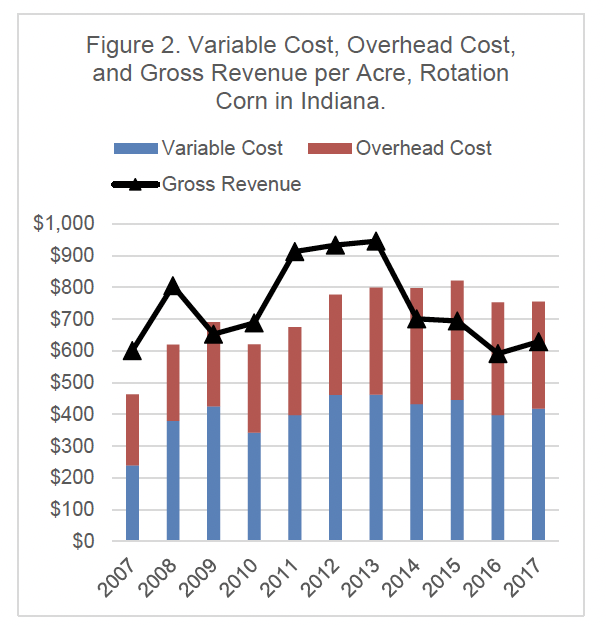
Figure 2. Variable Cost, Overhead Cost, and Gross Revenue per Acre, Rotation Corn in Indiana.
Figure 3 illustrates the trends in fertilizer, seed, pesticide, and cash rent costs for rotation soybeans from 2007 to 2017. Fertilizer cost and cash rent have declined since their peaks in 2013 and 2014. Resistant weed problems have put upward pressure on pesticide cost for rotation soybeans.
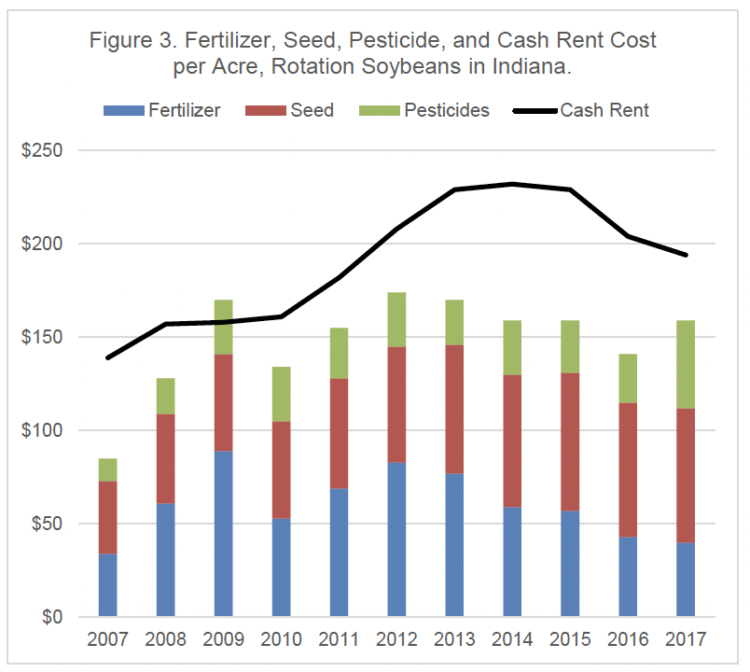
Figure 3. Fertilizer, Seed, Pesticide, and Cash Rent Cost per Acre, Rotation Soybeans in Indiana.
Gross revenue (market revenue plus government payments), variable cost, and fixed cost per acre for rotation soybeans on average productivity land is illustrated in Figure 4. Variable cost per acre peaked in 2013 at $239 per acre, dropped to $201 in 2016, and is projected to be $233 per acre in 2017. Like corn, fixed cost per acre peaked in 2015 at $375, and is projected to be $337 per acre in 2017.
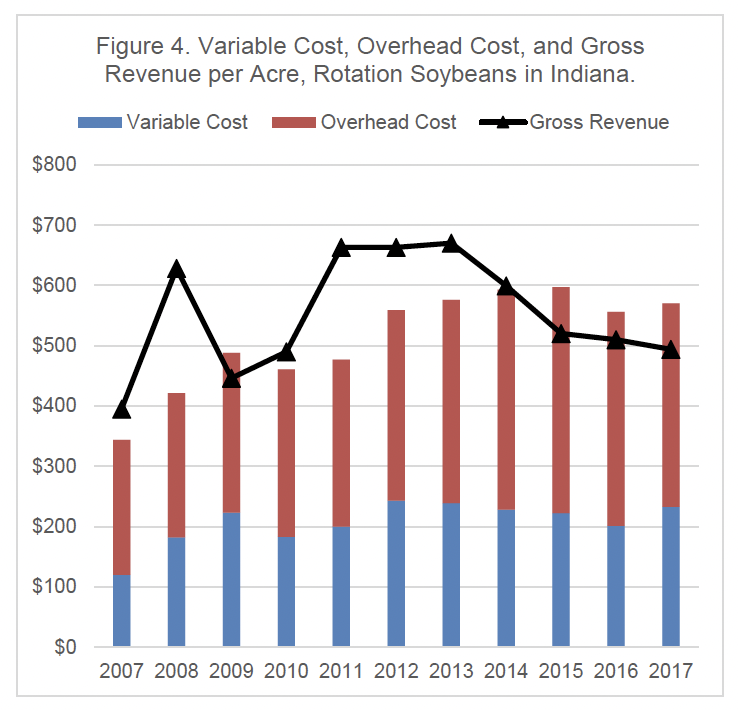
Figure 4. Variable Cost, Overhead Cost, and Gross Revenue per Acre, Rotation Soybeans in Indiana.
The breakeven price needed to cover variable and fixed costs declined from $11.94 per bushel in 2015 to $10.96 in 2017. Gross revenue for rotation soybeans has declined from $670 per acre in 2013 to $494 per acre in 2017. The expected loss in 2017 for rotation soybeans is $76 per acre.
The breakeven prices for rotation corn and rotation soybeans discussed above were for average productivity land. For high productivity land, the breakeven prices for rotation corn and rotation soybeans are expected to be $4.01 and $10.06 per bushel, respectively. Unless prices rise above $4.00 per bushel for corn and $10.00 per bushel for soybeans, expected earnings per acre will be negative for all three land qualities.
In summary, margins are expected to be tight again in 2017. This increases the importance of carefully scrutinizing input and crop decisions. Producers are encouraged to create crop budgets and in general improve their record keeping. Low crop margins will adversely impact a farm’s liquidity position and financial performance.
![]()
![]()
![]()
![]()
![]()