2020 Corn Price Outlook
December 18, 2019
PAER-2019-20
Authors: James Mintert, Professor of Agricultural Economics & Director of the Center for Commercial Agriculture and Mindy Mallory, Associate Professor, Clearing Corporation Charitable Foundation Endowed Chair of Food & Agricultural Marketing
![]()
![]()
![]()
![]()
![]()
After enduring innumerable planting and harvest headaches, U.S. corn and soybean farmers were at least rewarded with a modest improvement in crop prices. After a historically difficult planting and harvest season for 2019, the season average corn price is now expected to average $3.85/bushel, its highest level since 2013 and 7% higher than in 2018. The national average corn yield for 2019 is expected to be 5% off from last year and 2% below trend at 167 bushels per acre, according to the USDA’s November Crop Production report. The result is a 2019 corn crop projected to total 13.7 billion bushels, which will be the smallest U.S. corn crop since 2015. It’s possible that the 2019 crop estimate will be revised down further, depending on yield reductions and acreage abandonment attributable to delayed harvest and early snow on late-to-mature crops in the Northern Corn Belt.
Although corn production declined 800 million bushels, the production decline is likely to be partially offset by an anticipated usage decline of over 500 million bushels, both compared to the 2018/2019 crop year. The combination of smaller production and usage is expected to produce a modest draw down in the corn carryover into the 2020 marketing year of about 200 million bushels, helping to support this year’s prices. Although corn used for ethanol in the upcoming year is expected to hold steady, reductions in feed usage and smaller exports are expected to push total usage down by nearly 560 million bushels. Recent weeks have shown signs of strength in exports and prospects for feed demand based on livestock placements, however, according to USDA reports. Watch these key usage categories in the coming weeks; strength here will help keep prices strong compared to recent years.
Ethanol margins have improved to at least breakeven levels in recent months, which should keep existing capacity online. This coupled with the E10 blend wall will keep corn demand for ethanol linked to gasoline demand. Rulemaking for the 2020 and 2021 blending requirements, as well as the judicial review of the Small Refinery Exemption of the Renewable Fuel Standard could impact prospects for the ethanol use category in 2020 and 2021.
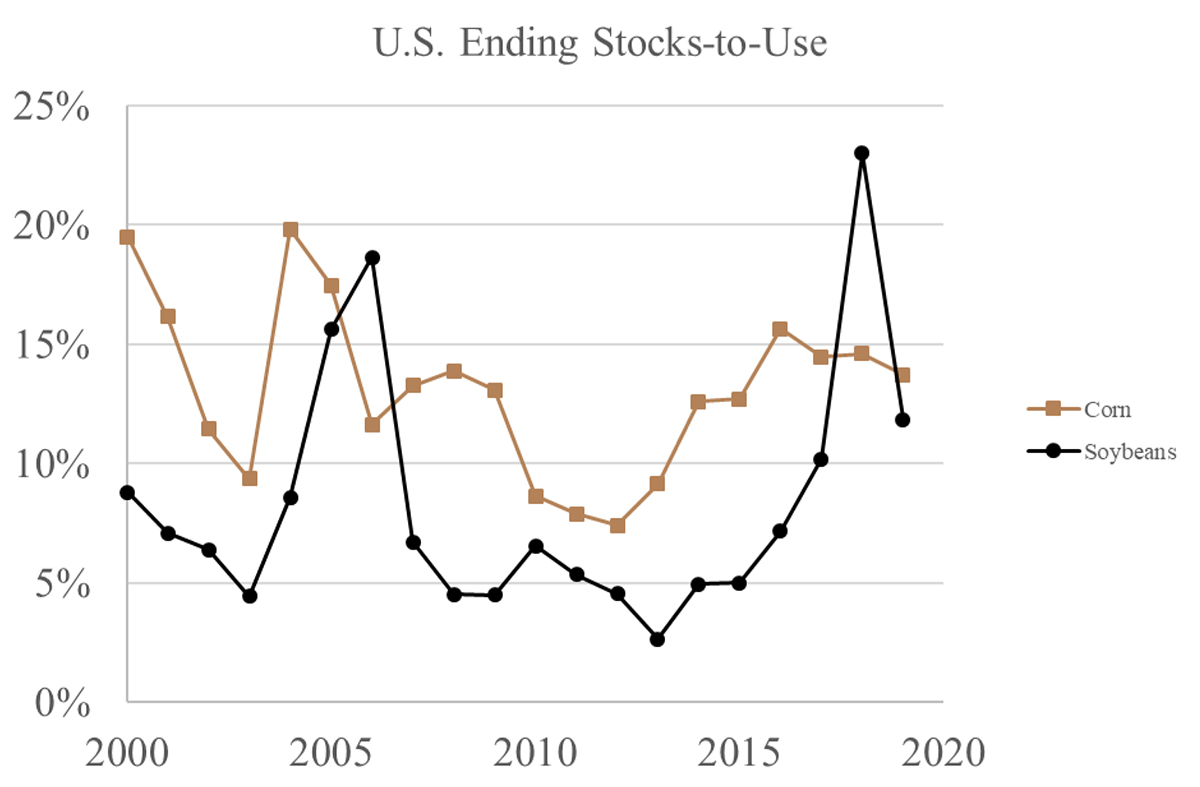
Figure 1. U.S. Ending Stocks-to-Use
The anticipated decline in U.S. corn ending stocks by the end of the 2019/2020 marketing year marks the third consecutive reduction in U.S. ending stocks. The U.S. stocks-to-use ratio is expected to come in at 13.7%, down from 14.6% last year. The stocks situation is somewhat encouraging for price prospects. As recently as 2016 we had a stocks-to- use ratio of nearly 16%, which contributed to the lowest prices in recent history. Importantly, the world corn supply/demand balance is expected to continue tightening, a trend that’s also been under- way since 2016. World stocks are projected to decline to 26% of total usage, down from 28% last year and well below the 33% stocks/usage ratio recorded in 2016. In the next few months, weather in South America will reset expectations for global stocks. The tightening stocks situation means additional acreage/yield losses in the U.S. and any weather worries in South America could provide a boost to prices.
Corn basis has been especially strong in the Eastern Corn Belt this year. Strong local corn demand from livestock feeders and ethanol plants in the face of historically large prevented plantings of corn pushed corn basis up this past summer and it has remained strong through harvest. The Center for Commercial Agriculture’s Crop Basis Tool (available at purdue.edu/commercialag) indicates early December corn basis bids were running $0.20 to as much as $0.32 per bushel above the most recent 3-year aver- age across Indiana. The strongest Indiana basis bids have been in the northwest, northeast and central regions of the state. Producers will want to keep a close eye on basis bids this winter and spring as the basis improvement that typically takes place from fall to late spring could be smaller than usual, especially if early prospects for the 2020 crop are good.
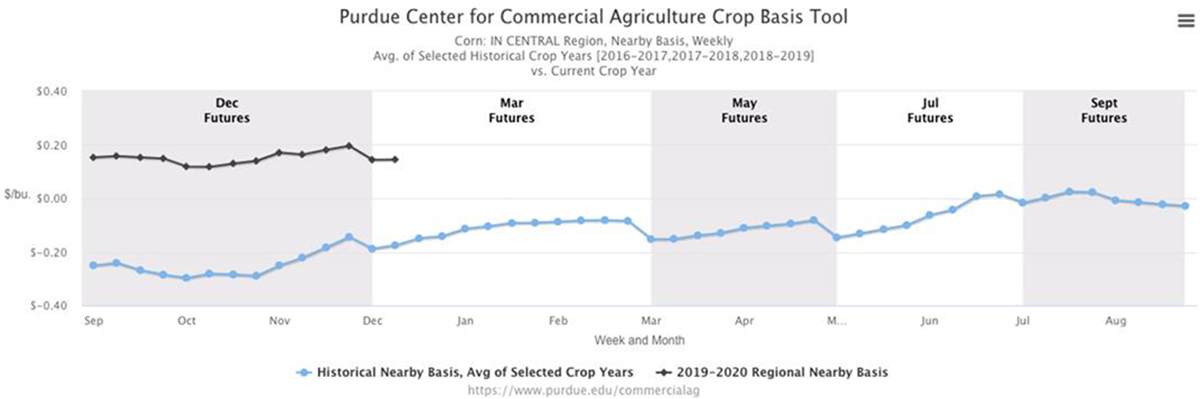
Figure 2. Purdue Center for Commercial Agriculture Crop Basis Tool. Average of selected historical crop years (2016-2017, 2017- 2018, 2018-2019) versus current crop year for corn.
An early look at crop budgets for 2020 indicate a shift back towards corn is likely, suggesting that we will push U.S. corn acreage back above 90 million acres. Combined with a return to trend line yields for 2020 this implies a substantial boost to U.S. and world corn supplies is likely, pushing the corn carryover up substantially and putting pressure on prices. However, there is a quite a bit that can happen between now and when planters could start rolling in early spring. Uncertainty about final 2019 U.S. corn production, weather in South America and uncertain trade prospects impacting both corn and soybean demand could still alter the economics for corn versus soybean plantings significantly between now and planting time.
![]()
![]()
![]()
![]()
![]()