2020 Indiana Pastureland, Hay Ground, and On-Farm Grain Storage Rent

July 23, 2020

PAER-2020-09

Author: Craig Dobbins, Professor

Estimates for the current rental value of pastureland, hay ground, irrigated land, and on-farm grain storage in Indiana are often difficult to locate. For the past several years, questions about these items have been included in the Purdue Farmland Value Survey. These tables report the values from the June 2020 survey.

Table 1 reports averages and the number of responses for pasture rent. The number of acres required to support a cow, animal unit, is also presented.

Table 1. Pastureland: Number of responses, annual cash rent, and carrying capacity, June 2020

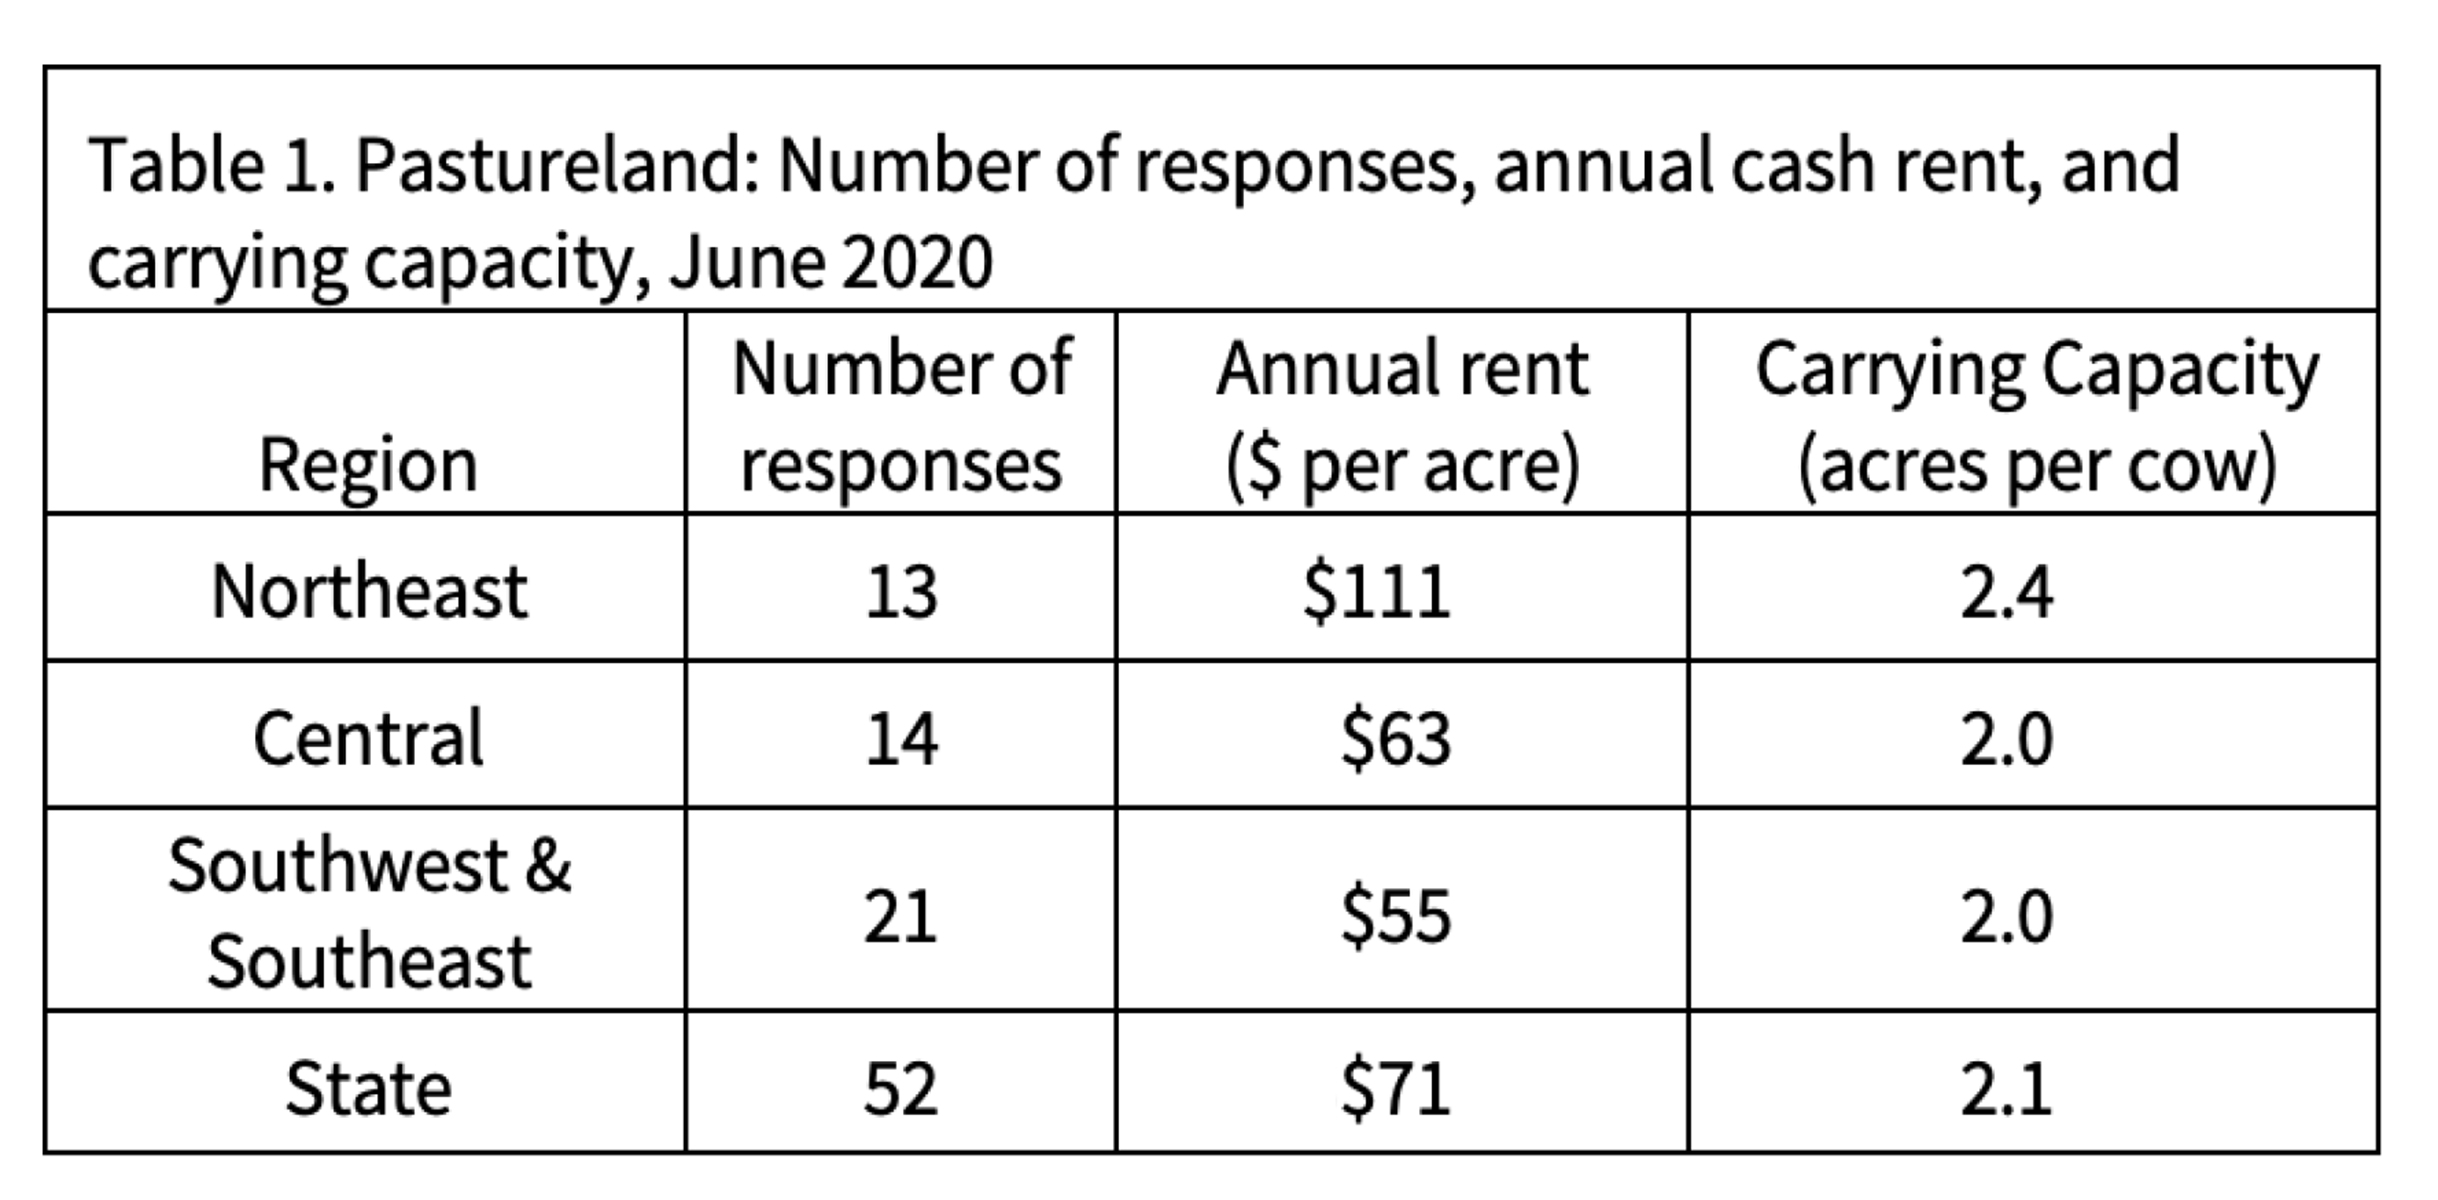
Table 2 reports the average per acre rental rates and the number of responses for established alfalfa/grass hay and grass hay.

Table 2. Rental of established alfalfa hay and grass hay ground, June 2020

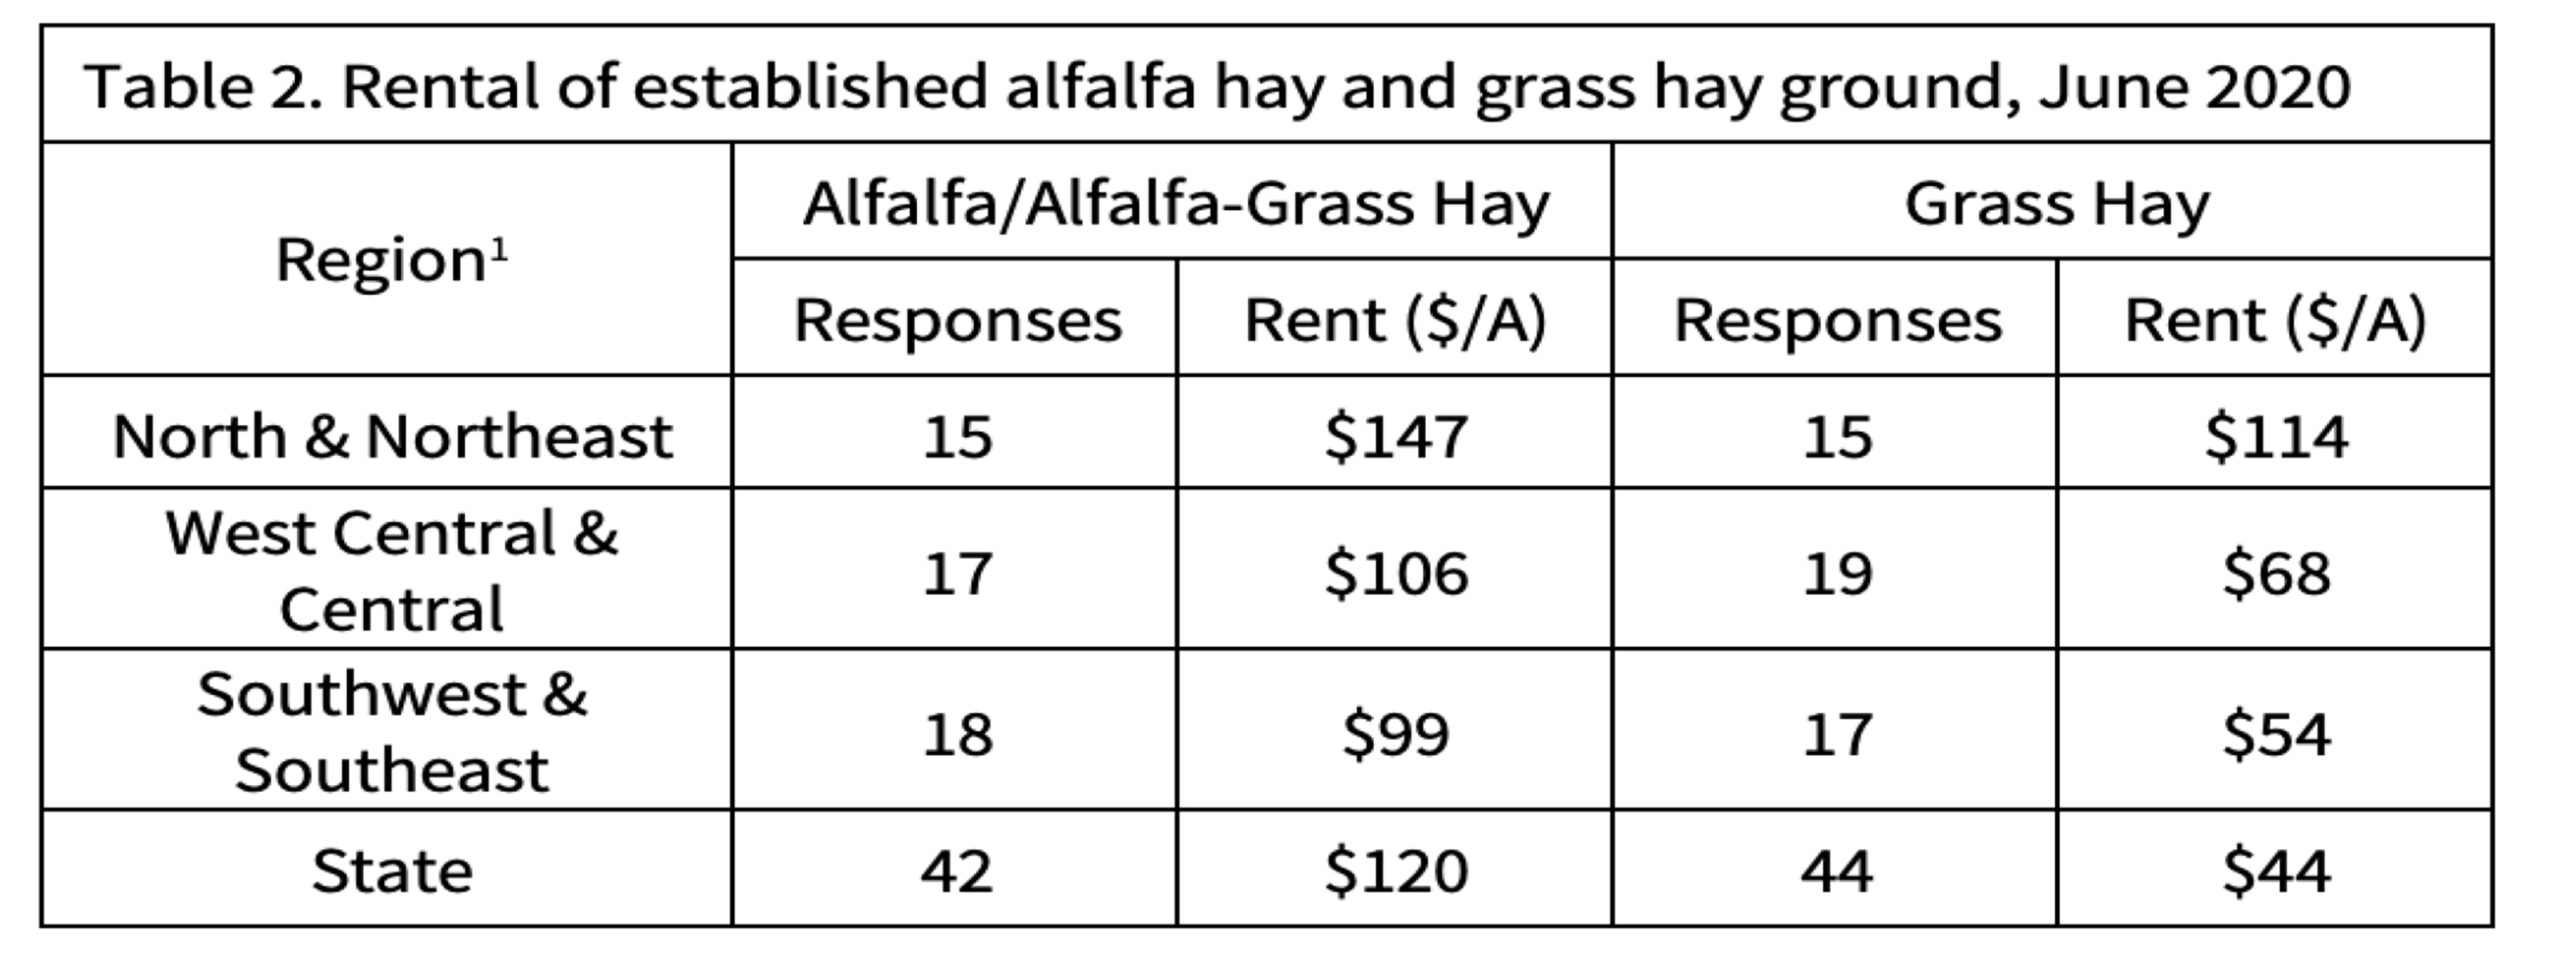
Table 3 provides information about the value and rental rate for irrigated farmland. These rates are for the associated with the production of corn and soy- beans. When producing specialty crops such as seed corn or tomatoes, rent is frequently higher.

Table 3. Irrigated Indiana farmland: Number of responses, long-term corn yields, estimated market value, annual cash rent, and rent as a percent of farmland value, June 2020

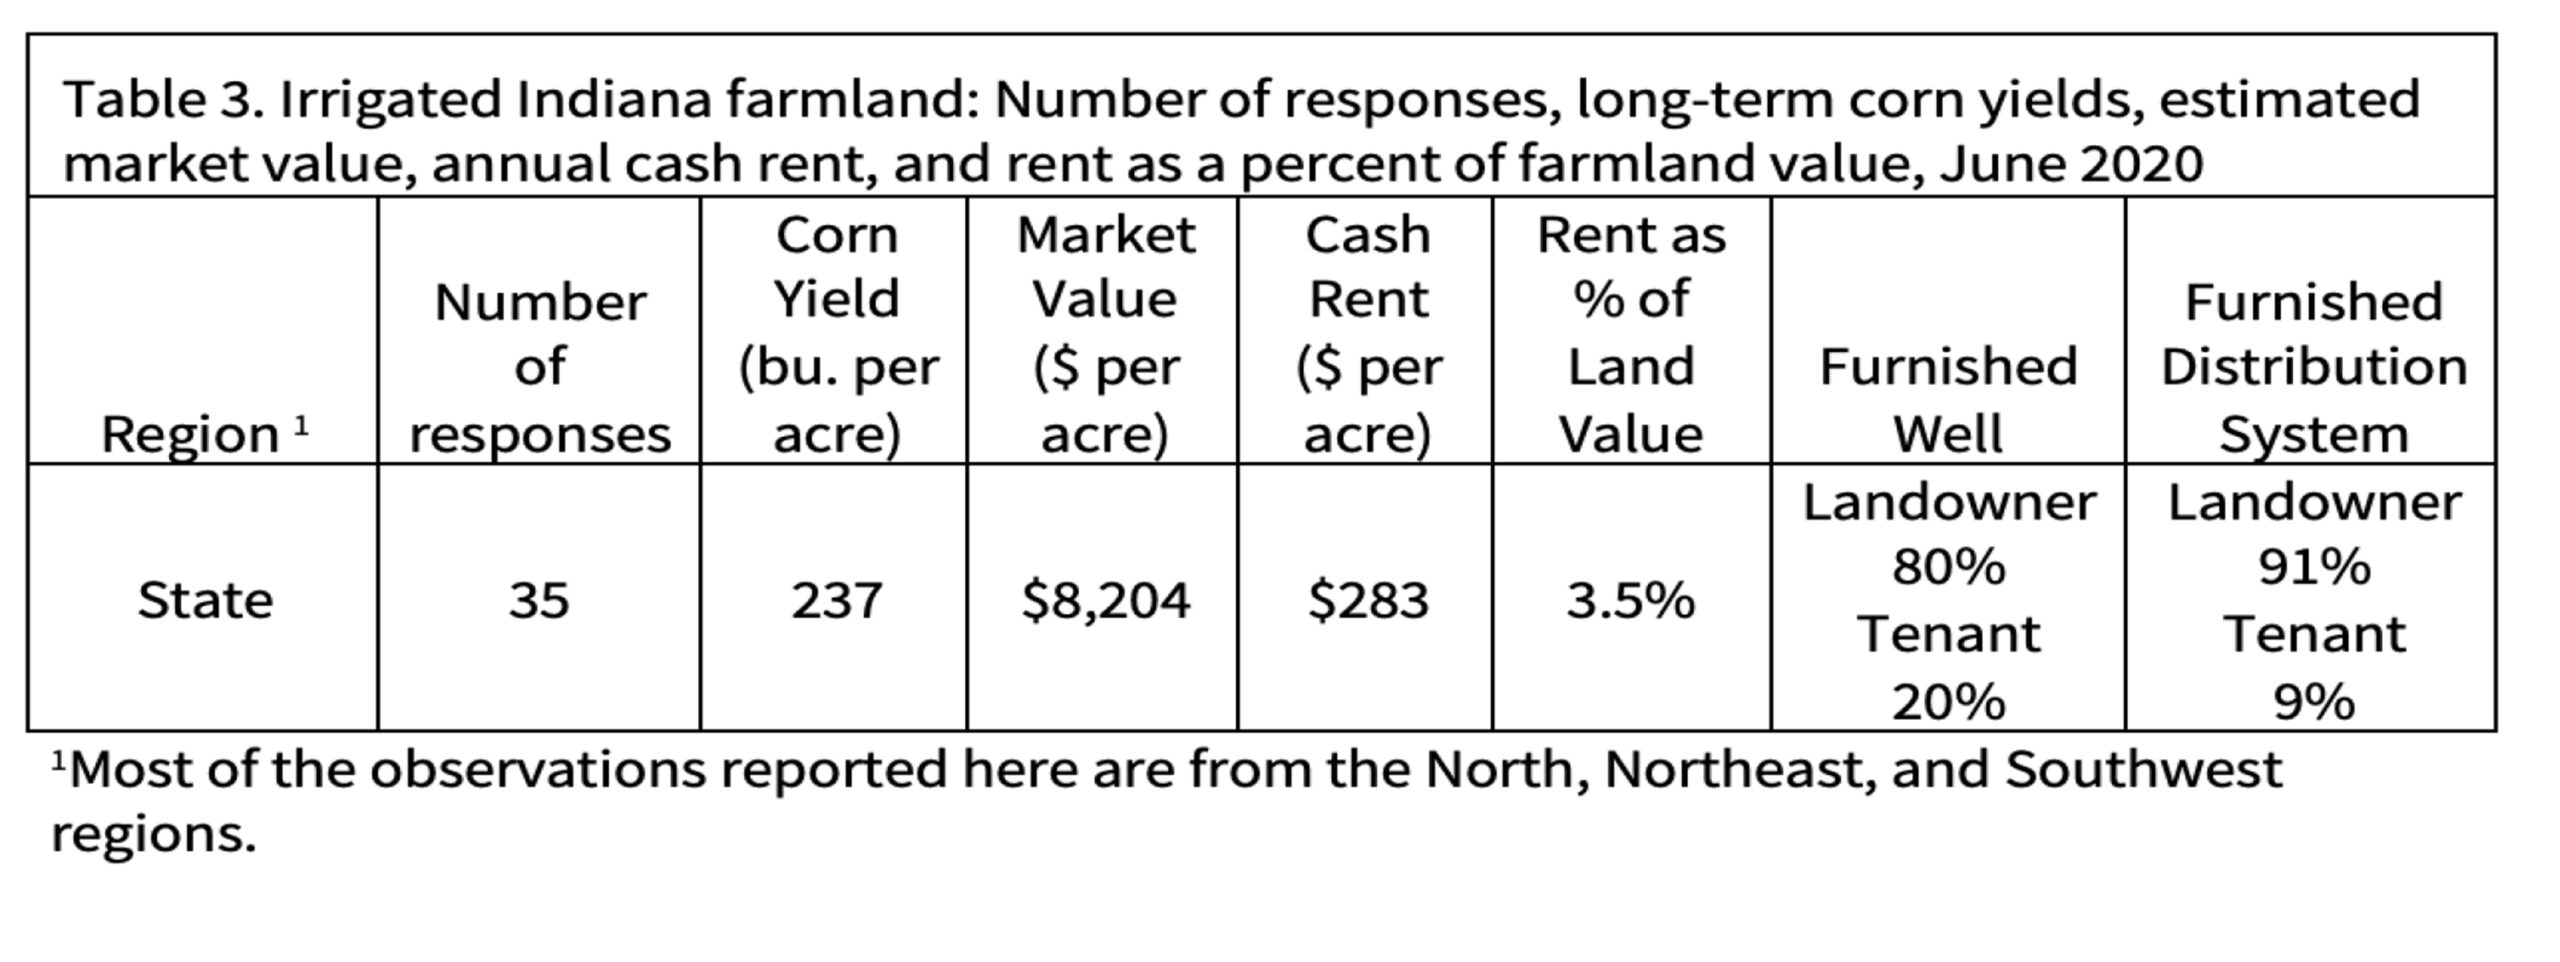
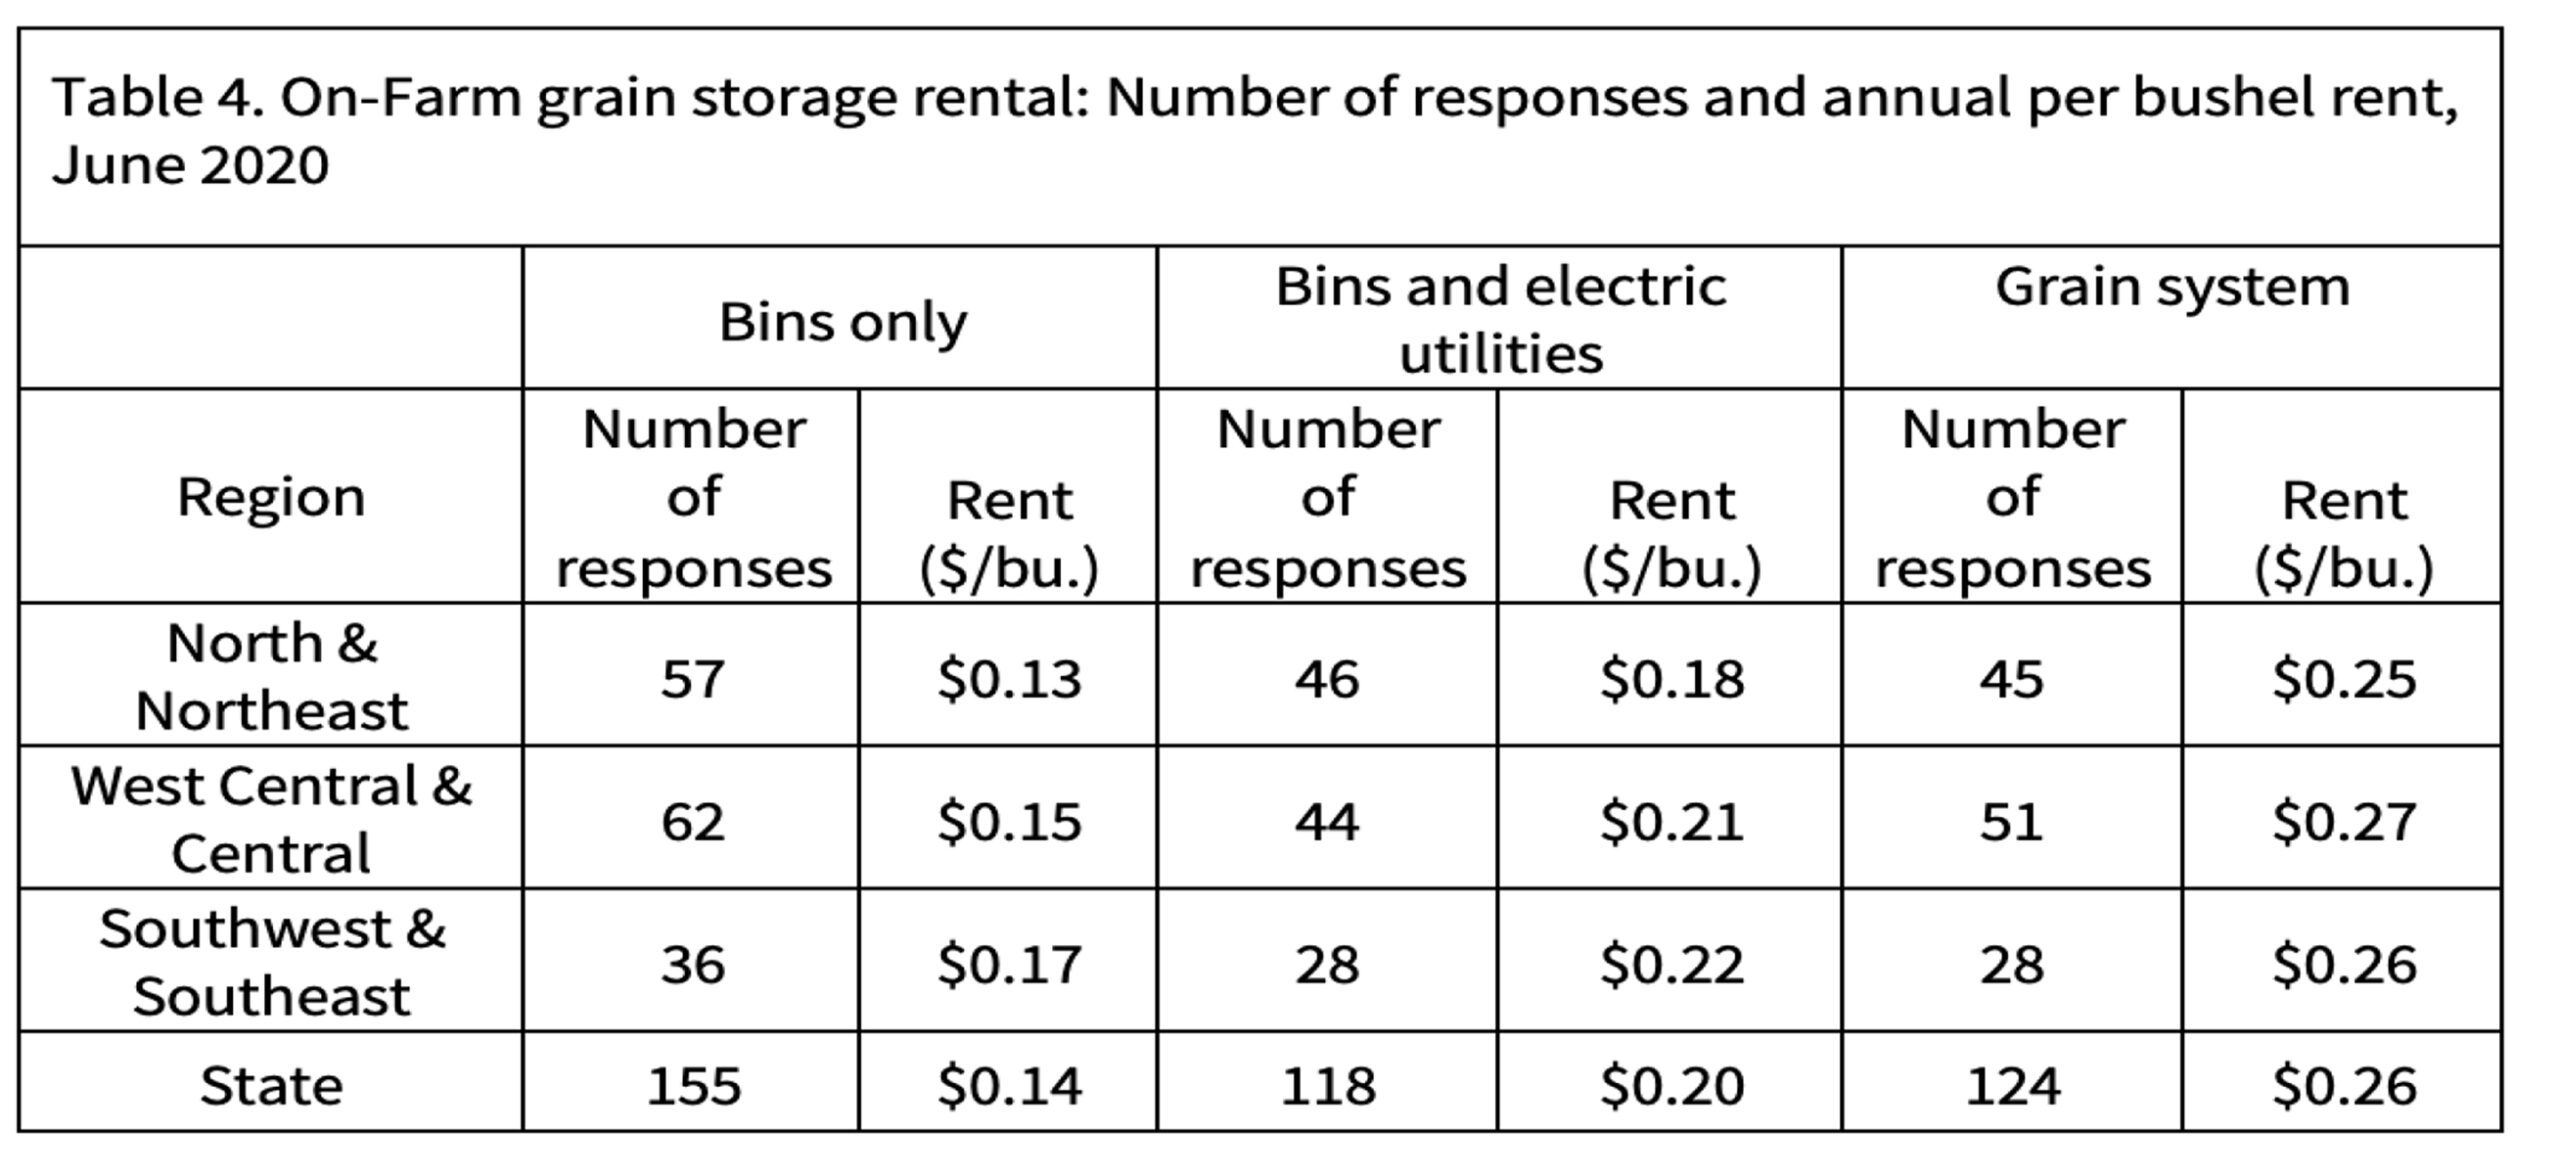
Table 4 provides information about on-farm grain storage rental rates. The rental rate for grain bins includes the situation where there the bin is rented and the person renting the bin pays utility expense, where the bin is rented and the bin owner pays the utility bills, where the producer rents a system that includes dryer, leg, and bins. These rates are annual rates.

Table 4. On-Farm grain storage rental: Number of responses and annual per bushel rent, June 2020


The first year for reporting this information was 2006. Past reports are in the Purdue Agricultural Economics Report Archive, https://purdue.ag/paer. This information Is typically found in the August issue of the specified year. However, 2016 results for are in the February 2017 issue and the 2017 results are in the April 2018 issue.

Publication Appeared Within:

Latest Articles:

The March 2026 Producer Price Index: Reading the Food Price Pipeline

April 16, 2026

The Bureau of Labor Statistics collects Producer Price Index (PPI) prices on the Tuesday of the week containing the 13th of each month. The March survey date was March 10. The Iran conflict began on February 28, making March 10 exactly ten days post-onset. The February survey date was February 10 — eighteen days before the conflict began – but well within the window of pre-conflict rhetoric and US troop buildup in the region.

READ MORE

The March 2026 CPI Report: What It Tells Us About the Iran Conflict’s Inflation Footprint — And What Is Still Coming

April 13, 2026

The March 2026 CPI report confirms what the structural analysis predicted: the Iran Conflict’s initial consumer price impact is concentrated in motor fuels, which respond to crude oil prices with almost no lag. The 0.9 percent monthly CPI increase is large by recent standards — the largest monthly increase since mid-2022, but it is not yet the broad-based food and goods inflation that a prolonged Strait of Hormuz disruption will eventually produce.

READ MORE

The Iran Conflict and Global Food Security: Why the Burden Falls Hardest on the World’s Most Vulnerable

March 31, 2026

When an energy shock ripples out from the Persian Gulf, the headlines focus on oil prices, gasoline costs, implications for value chains and the profit margins of U.S. producers.

READ MORE