Indiana Labor Market Trends Pre- and Post-COVID-19
July 9, 2024
PAER-2024-21
Laura Montenovo, Assistant Professor in the Department of Agricultural Economics
![]()
![]()
![]()
![]()
![]()
In March 2020, the COVID-19 pandemic caused a large and sudden negative impact on the national labor market. In the United States, within a year from the beginning of the pandemic, most economic activities returned to and exceeded their pre-COVID-19 levels, signaling a swift and sustained recovery, but recently experienced a slight slowdown. Indiana is no exception to this overall national trend. This report describes how labor market outcomes evolved in Indiana in the last decade (2014-2023) and their trends in the post-pandemic years. The evidence shows a drop in labor demand in 2020, at least partly due to the COVID-19-related social distancing policies that restricted business activity. Since 2021, the economy expanded, and the labor market experienced a growth in labor demand that remained largely unmet, a consistent labor shortage, which generated very low unemployment rates, and an increase in worker quit rates. However, starting in 2023, the situation has reverted back and curiously mirrors pre-pandemic trends.
Considering the evolution of key labor market indicators in the last decade helps us understand what labor market trends looked like before the pandemic, how they evolved during the year of the COVID-19 outbreak, and their changes in the following years. Many metrics are used to evaluate the strength of the labor force. The next several sections will analyze the last decade of labor market trends from several angles: unemployment, employment levels, employment churn, and earnings.1
Unemployment
Unemployed workers are jobless individuals actively looking for a job. Workers who are of working age and able to work but not actively searching for employment are not considered unemployed, nor in the labor force, because they are not willing to supply work. The unemployment rate is the total number of unemployed individuals divided by the size of the labor force, which is the sum of employed and unemployed individuals. Figure 1 shows Indiana’s seasonally adjusted unemployment rate between 2014:1 and 2024:1. After peaking at over 13% in the second quarter of 2020 and reaching almost 17% in April 2020, the 2022 unemployment rate dropped to an average of 2.9%, touching the lowest in March 2022, at 2.8%. In 2023 and 2024, the Indiana unemployment rate slightly increased up to 3.5% in the last quarter of 2023 and the first of 2024, matching 2018 (pre-pandemic) unemployment levels. At the beginning of 2024, the metropolitan areas with the lowest unemployment rates were Columbus, IN, Lafayette-West Lafayette, IN, and Indianapolis-Carmel-Anderson, IN. The highest unemployment rates among metropolitan areas in the state were in Kokomo, IN, Michigan City-La Porte, IN, and Elkhart-Goshen, IN.
Figure 1: Indiana Quarterly Unemployment Rate, January 2014 to January 2024
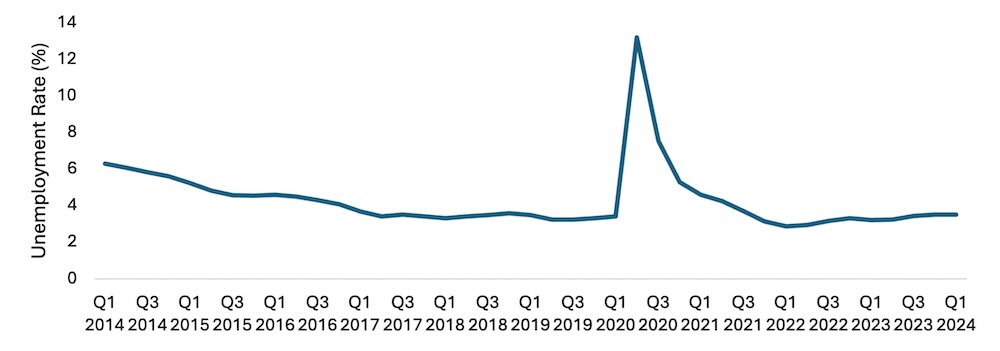
Source: Bureau of Labor Statistics
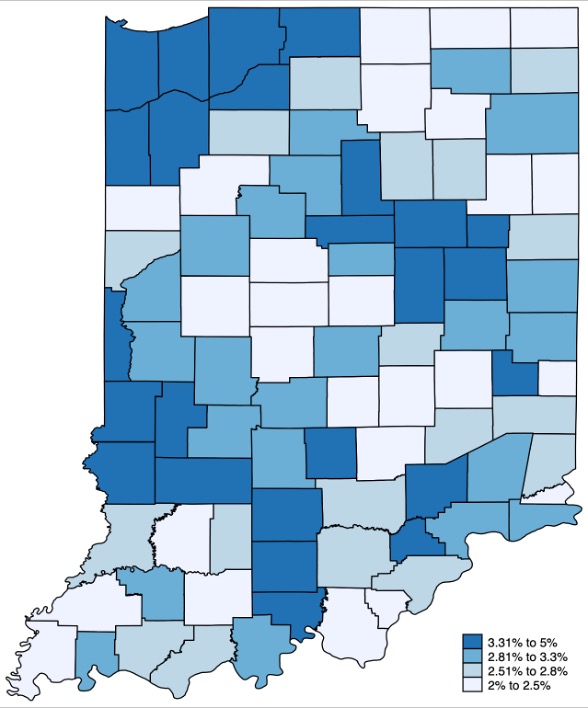
Figure 2 plots the 2022 unemployment rates by county, with darker shades of blue reflecting higher rates of unemployment. The highest unemployment rates were in Northwest Indiana and some counties in South-West Indiana, except those closest to Evansville. High unemployment rates also affect some counties in the North and East of the Indianapolis metropolitan area. Given the definition of unemployment and employment rate, high unemployment simultaneously corresponds to low employment. This implies that lighter shades of blue on the map, representing low employment rates, also correspond to the counties with higher employment rates. Moreover, the map suggests that low-unemployment and, especially, high-unemployment counties tend to be grouped together, potentially reflecting the structure of the local economies and/or the socio-demographics of the resident population.
Figure 2: Indiana Unemployment Rates, 2022
Employment Trends
Figure 3 plots the seasonally adjusted number (in thousands) of total nonfarm employees in the United States (in orange, left y-axis) and Indiana (in blue, right y-axis) between the first quarter of 2014 and the first quarter of 2024. Overall, the trends of the number of employees in Indiana and the U.S. mirrored each other despite differences in scales. They both exhibit a gradual upward trend between 2014 and pre-pandemic months, a strong contraction in the second quarter of 2020, and a quick correction and a steady increase in the total number of employees. A key difference is that Indiana began contracting a quarter earlier than the nation; a similar pattern emerged before the Great Recession as well.
In the past decade, Indiana employment numbers peaked in the fourth quarter of 2019, with over 3,164,000 Hoosiers employed in the nonfarm sectors (see Figure 3). In 2020, nonfarm employees dipped down to 2,795,000 in the second quarter and began rebounding, albeit initially slowly, in the third quarter of the same year. Two years later (2022:2), the number of Indiana nonfarm employees surpassed the pre-pandemic employment figures at 3,180,400 million working individuals. In the first quarter of 2024, almost 3.3 million workers were formally employed in the state.
Figure 3: Indiana Number of Nonfarm Employees (1000s), January 2014 to January 2024
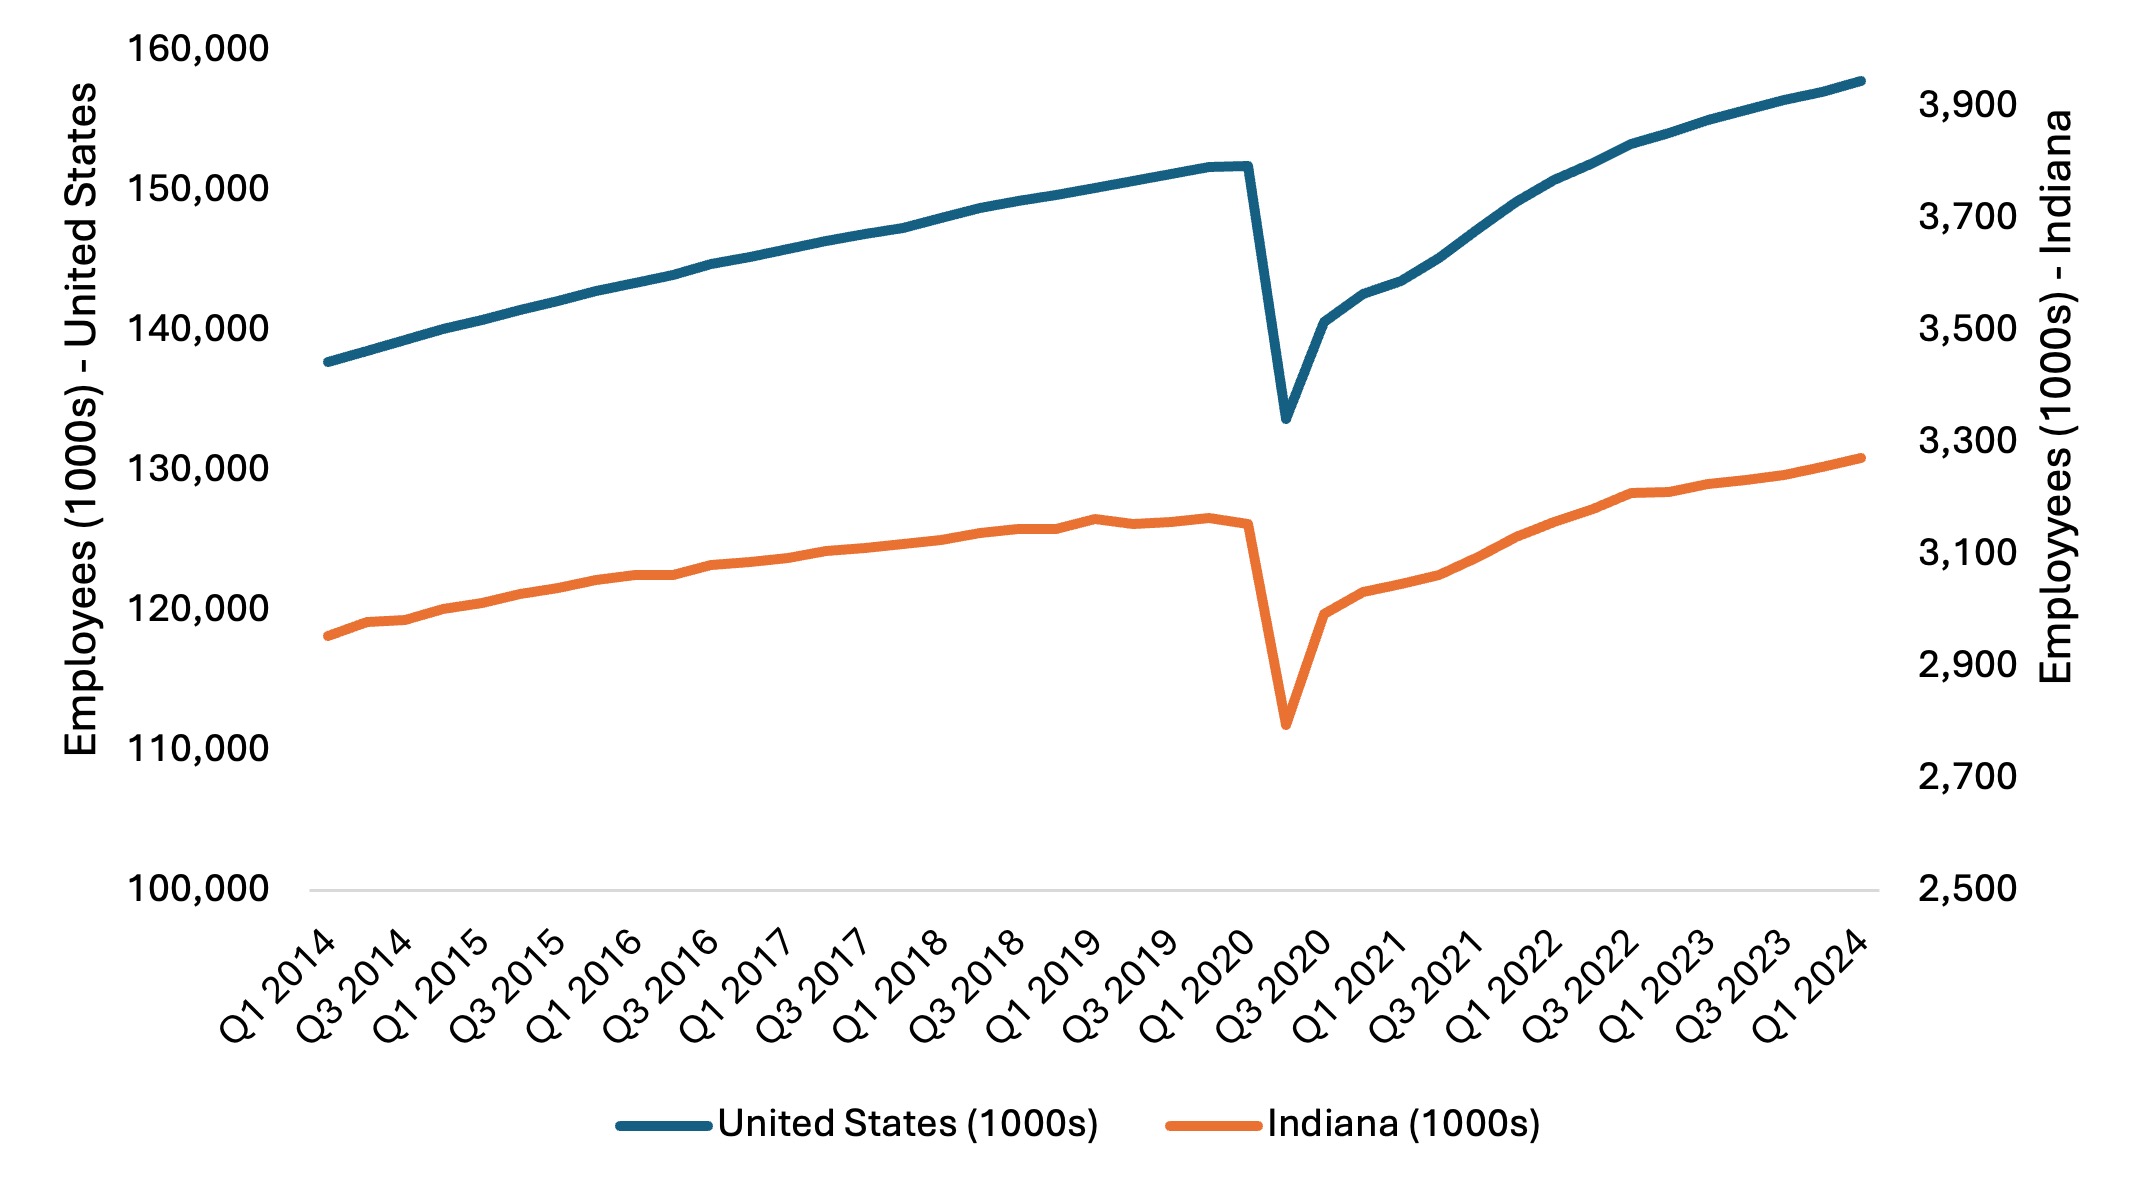
Source: Bureau of Labor Statistics. Numbers are seasonally Adjusted.
Employment Churn
Unemployment and employment are commonly used factors to evaluate labor market performance. However, a deeper look at the details can improve our understanding of its dynamics. Figure 4 plots hires, job openings, layoffs, quits, and total separations between 2014 and 2023 in Indiana.2 Hires are any beginning of an employment relationship between a worker and an employer. Job openings are vacant positions that employers are seeking to fill. Notably, hires can be greater than job openings if the new hiring occurs as a result of a job opening that arose in previous periods. For example, if in a month, say May, there were 100,000 job openings, and in June, there were another 90,000, hires in June could be 120,000 if new hires match with some jobs that opened in May (or any month before June). More job openings than hires in a certain period suggest the presence of a labor shortage, meaning labor is in high demand. Layoffs are involuntary separations of workers from the company originating from the employers’ decisions, largely related to their business activities or economic conditions. Quits are voluntary separation decisions by workers to leave their firm (aka resignations). Total separations represent any interruption of an employment relationship between a worker and an employer for any reason, including layoffs, quits, and other reasons for separations, like retirement or death. Consequently, total separations will likely be greater than the sum of layoffs and quits.
Figure 4: Indiana Nonfarm Labor Market Outcomes (1000s), 2014 to 2023
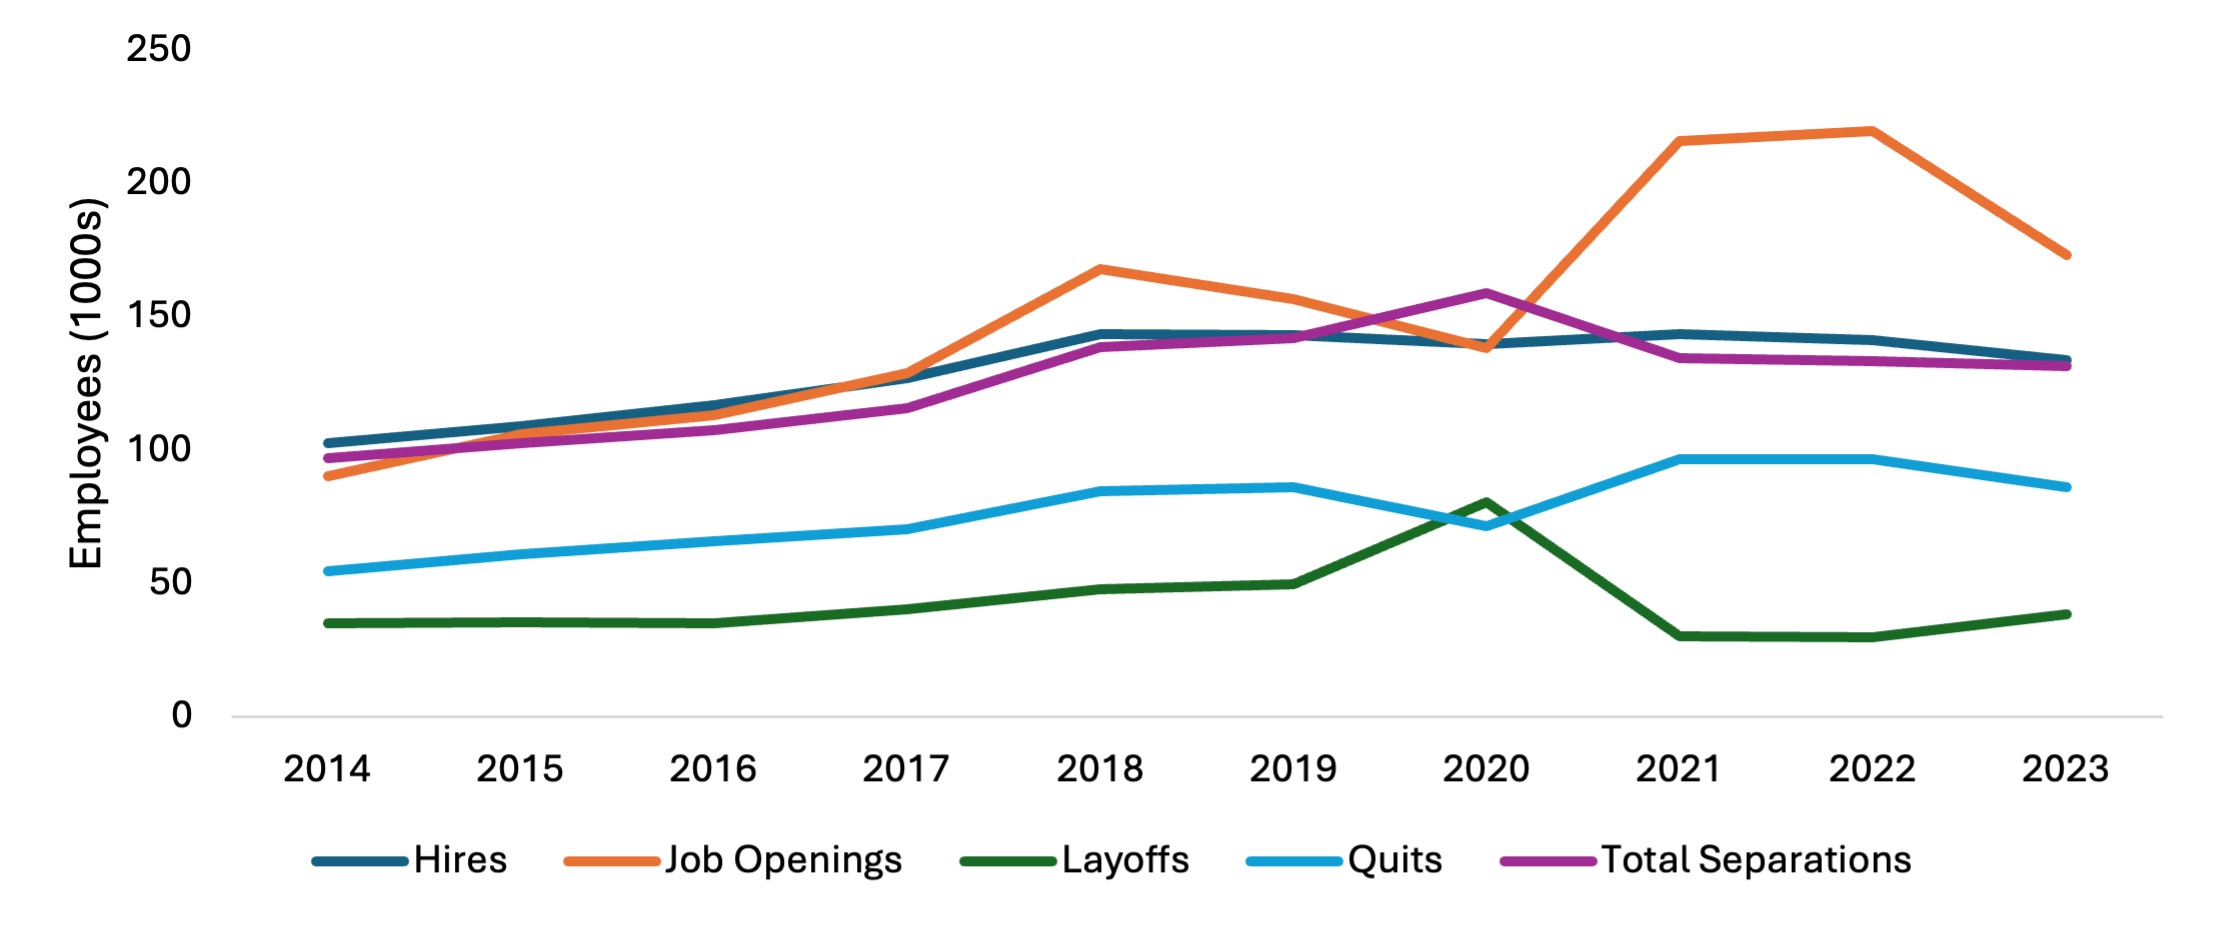
Source: Bureau of Labor Statistics.
Figure 4 shows some interesting patterns. First, between 2014 and 2017, the labor market dynamics were steady, with similar levels of hires, job openings, and total separations. Then, in 2018 and 2019, job openings outpaced hires and total separations. The same pattern occurred more dramatically in 2021 and 2022 and continued at a more subdued pace in 2023. These post-pandemic years correspond to record-low unemployment rates, sustained labor shortages, unfilled job vacancies, and unmatched demand for labor.
Second, layoffs were fewer than quits throughout the period. The exception was 2020, where a decrease in quits and a sharper increase in layoffs, caused by the pandemic and the restriction in economic activities, inverted that trend by a small margin. The largest gap between layoffs and quits occurred in 2021 through 2023, with a smaller gap evidenced in 2023. This is the period of the “great resignation,” an economic trend that started in the wake of the pandemic, whereby Americans began quitting their jobs due to several reasons. These may include wage stagnation, dissatisfaction with the work environment, and lack of flexibility or appropriate benefits on the job. It is also possible that the amplification of the labor shortage and increased number of job openings gave dissatisfied workers confidence that they could quickly find potentially better jobs, thus causing higher levels of quitting in their current roles.
Third, 2020 is the only year where total separations rose above all the other labor market dynamics in the graph, and job openings dropped and coincided with levels of hiring. Somewhat surprisingly, during this year, the decrease in job openings and quits and the increase in layoffs did not come with a noticeable decrease in hires. In fact, the hiring trend was weakly upward till 2019 and has remained quite stable, with a very slight decrease in 2023. This result may imply that employers responded to the pandemic by altering their behavior with their existing workforce through layoffs, furloughs, or temporary leave of absence rather than by dropping the number of new workers entering the workforce.
Overall, Figure 4 shows a cooling of job openings in 2023 from the boosted levels in 2021 and 2022. This translates into a decrease in job openings, which affected hires, quits, and a slight increase in layoffs.
Figure 5 isolates two labor market trends from Figure 4 and reports the number of net hires, which is the difference between the number of hires and that of total separations in thousands between 2014 and 2023 in Indiana. The figure shows that the net hires increased steadily between 2014 and 2017. In 2018 and 2019, the number of “excess” hires over separations, however, was fast declining, likely due to the baby boomer population reaching retirement age and leaving the workforce (separations). In 2020, the large increase in layoffs led to 20,000 additional individuals out of work above new hires, resulting in a large drop in net hires. The trend quickly reverted, and net hires became strongly positive again in 2021 and 2022, which is in line with the graphs above. However, in 2023, the gap between hires and separations became smaller in magnitude, mirroring the 3-year trend before the pandemic.
Figure 5: Nonfarm Net Hires in Indiana (1000s), 2014 to 2023
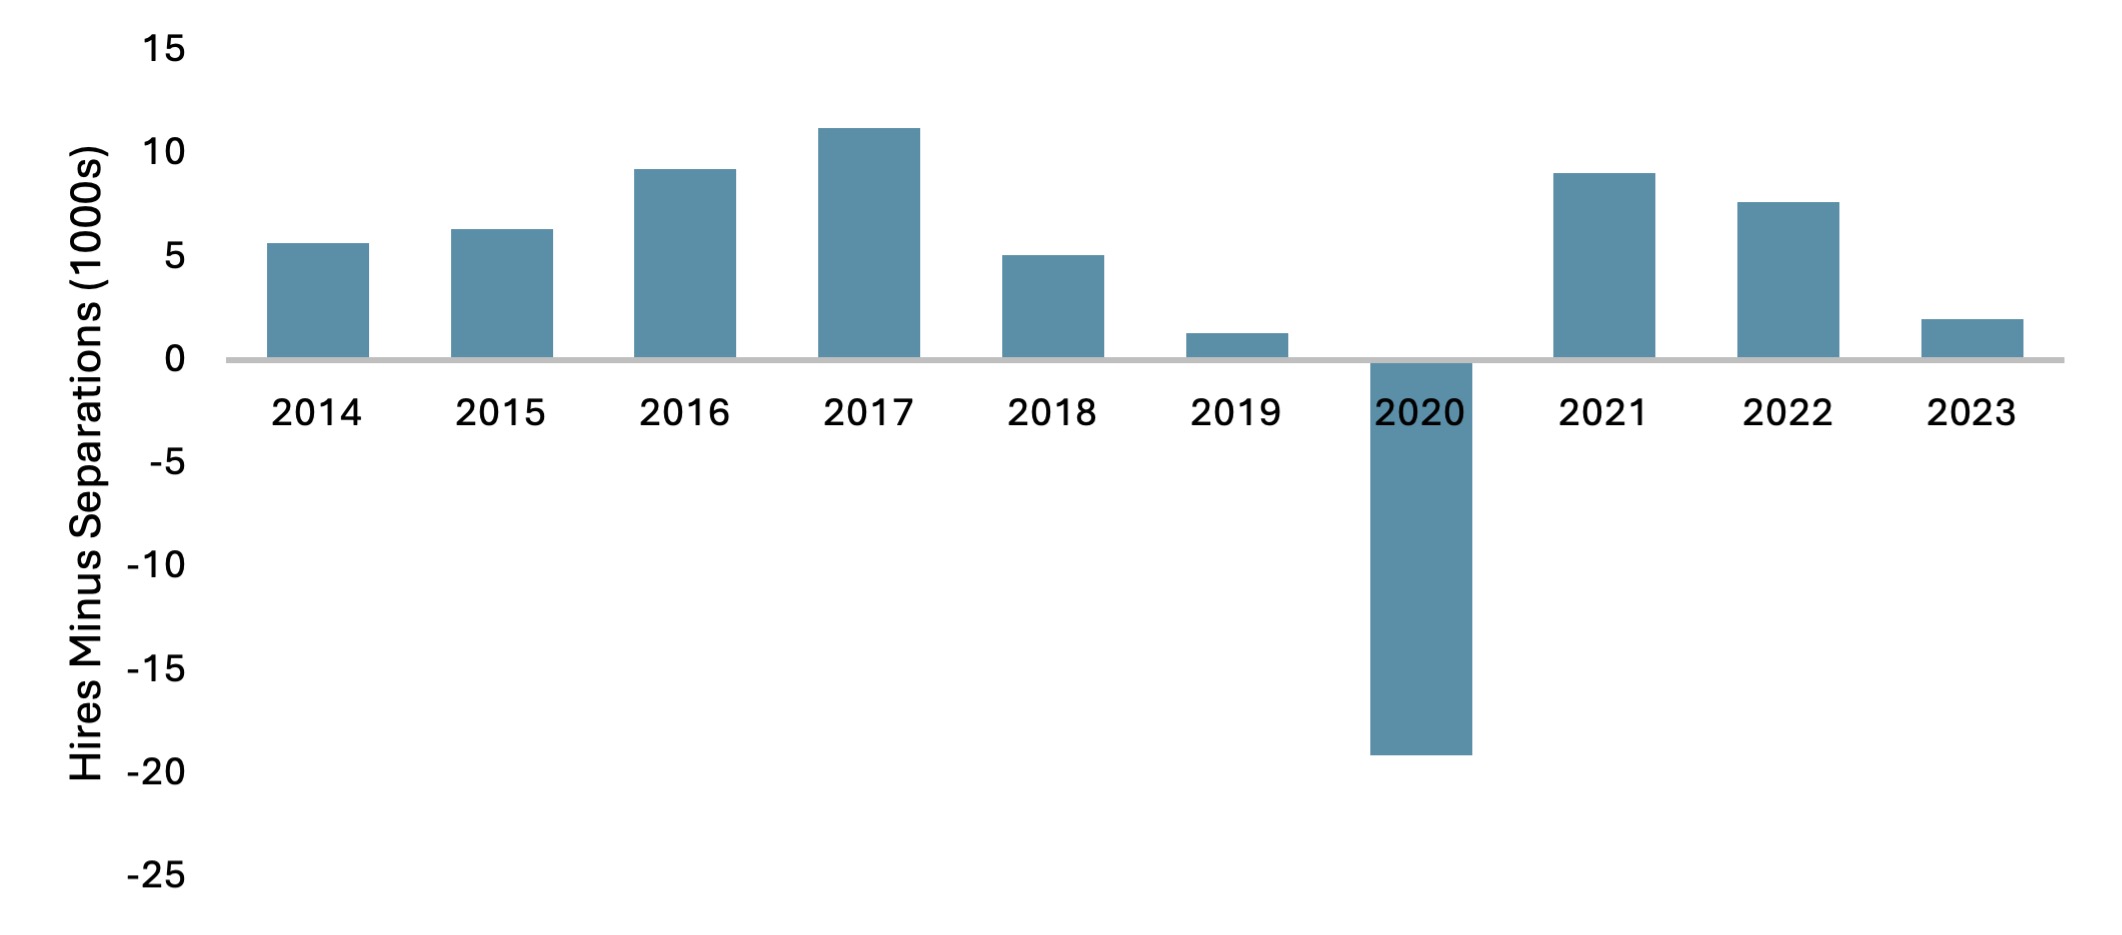
Source: Bureau of Labor Statistics. Numbers are seasonally Adjusted.
Plotting the number of job openings and that of the unemployed workers provides another view of the labor shortage. Figure 6 reports the number of unemployed people and that of job openings between 2014 and 2023 in the United States (Panel A) and Indiana (Panel B). Overall, Indiana seems to track the national trends pretty closely, though their precise timing and magnitudes differ. Focusing on Indiana, Panel B suggests that between 2014:1 and 2017:1, the number of unemployed individuals exceeded job openings, pointing to an excess labor supply. The trends inverted between 2017 and 2020 when Indiana experienced a slight but sustained labor shortage, as noted with very low unemployment numbers. During 2020, the numerous layoffs caused the number of unemployed individuals to skyrocket and job openings dwindled, resulting in a sudden and deep surplus of individuals looking for a job. After the job opening dip in 2020:1, a strong growth in job openings propelled past the unemployed figure, causing a labor shortage between the end of 2021 and the beginning of 2022. In 2023, that labor shortage decreased, again mirroring pre-pandemic trends.
Figure 6: Number of Job Openings and Unemployed Individuals, January 2014 to September 2023
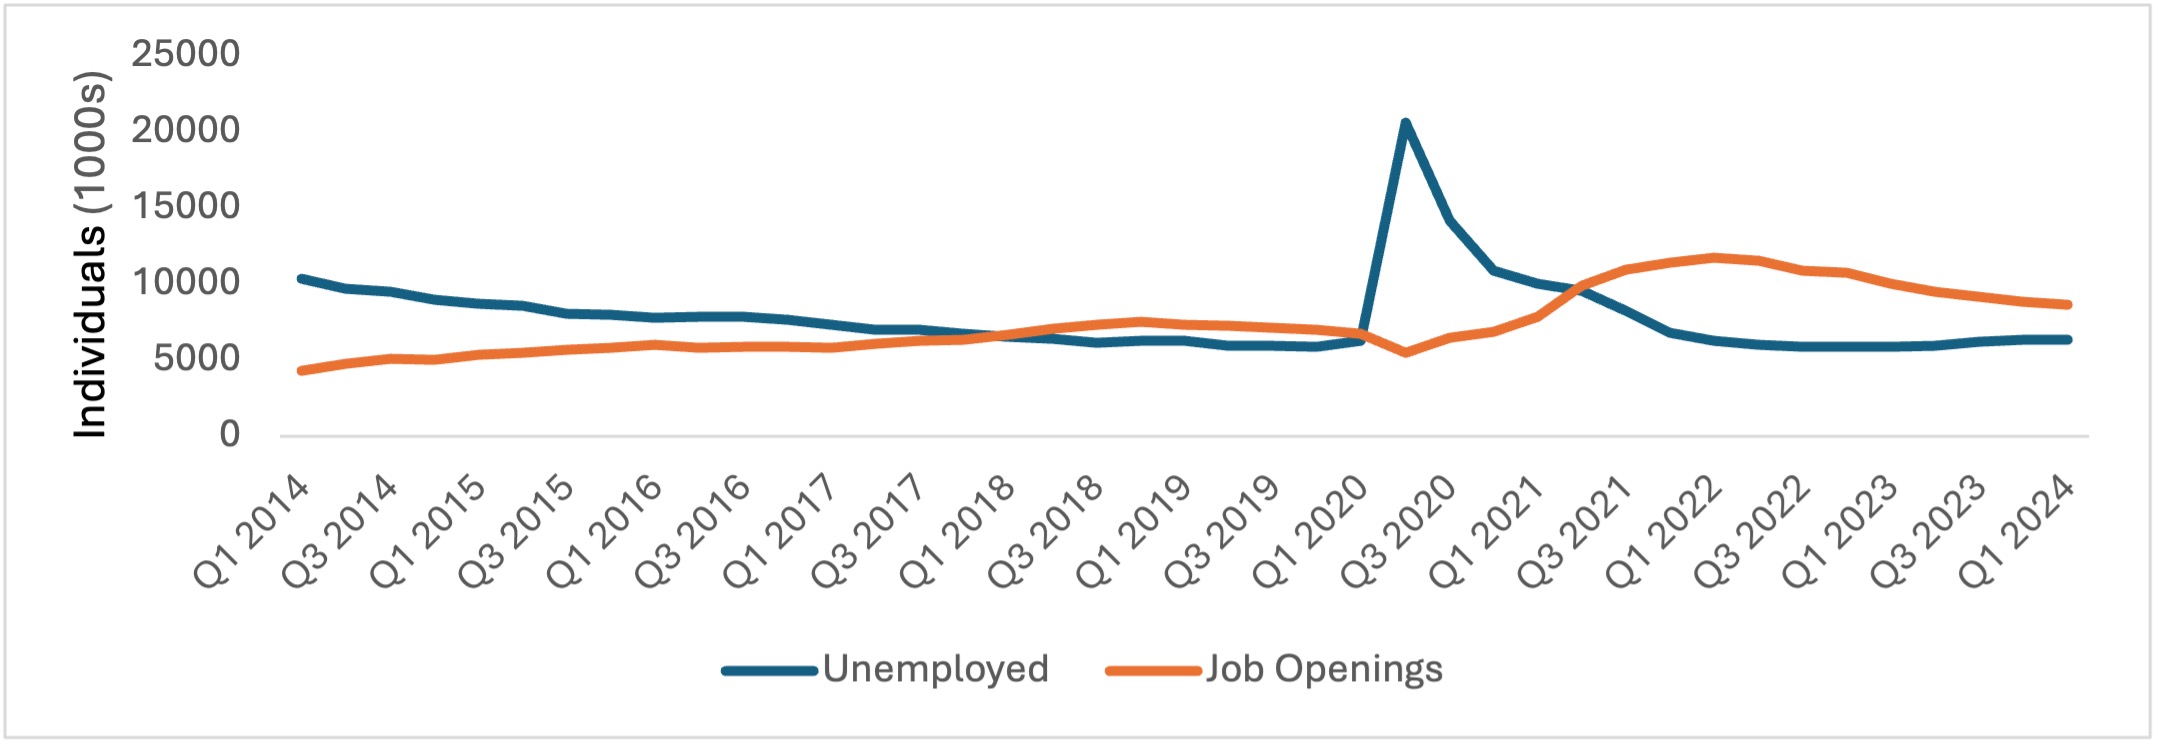
Panel A
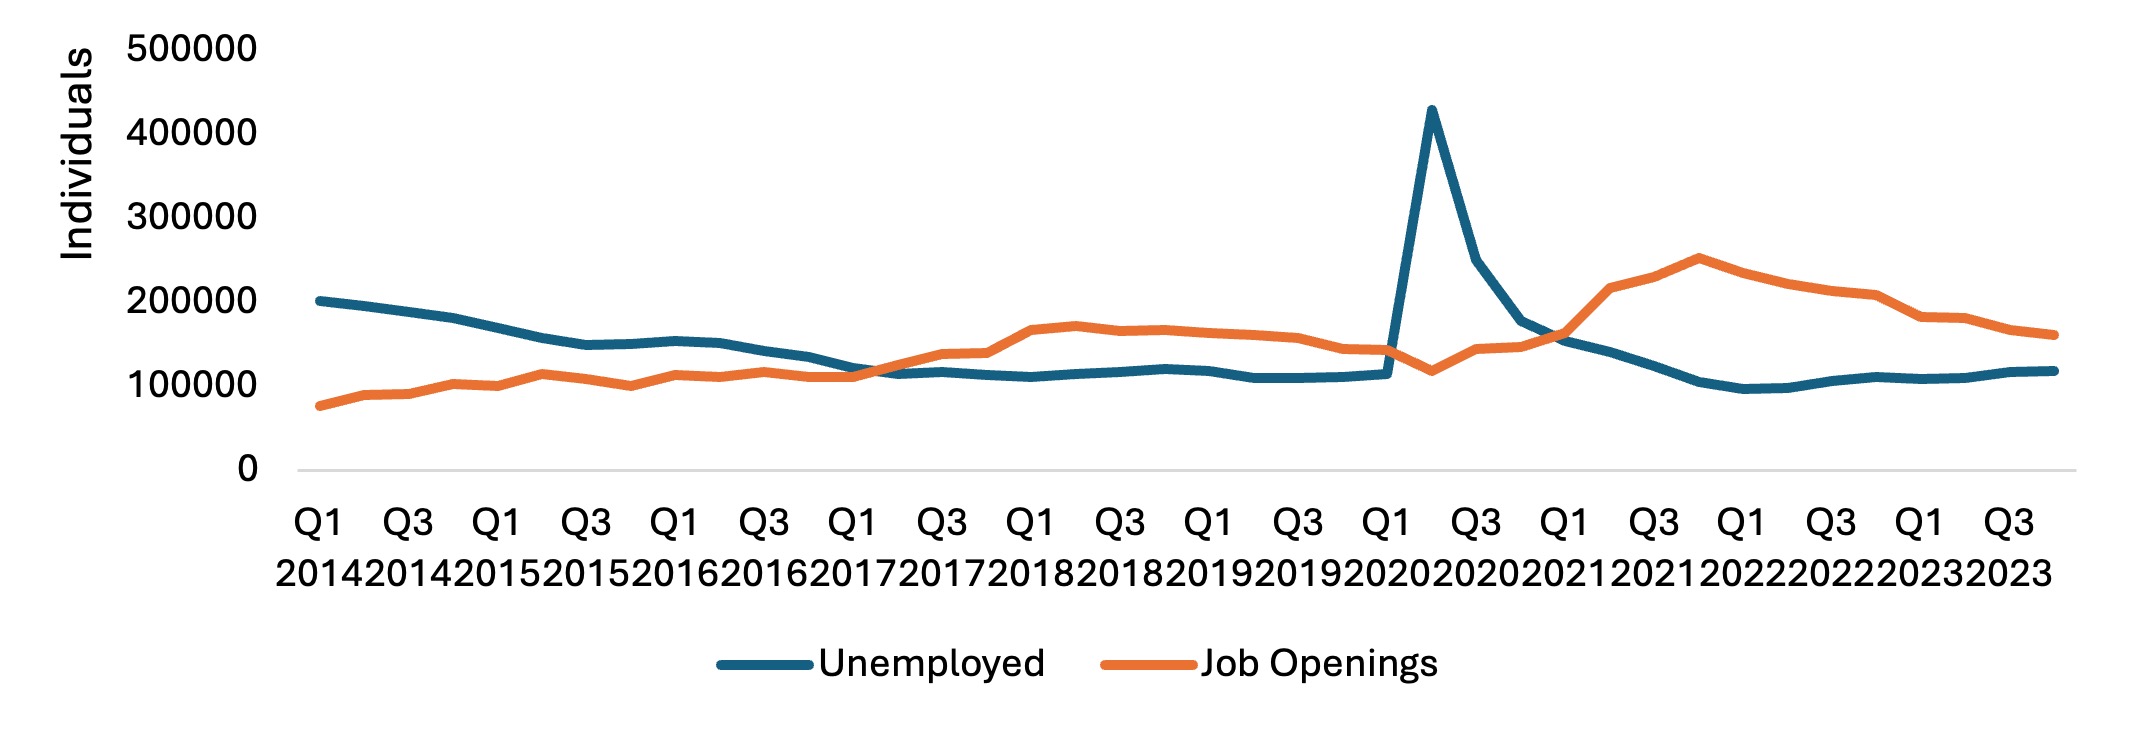
Panel B
Source: Bureau of Labor Statistics
Earnings
A final key labor market dimension to consider when examining labor market trends is earnings. Earnings reflect the productivity of labor as well as labor shortages, because the price of labor, like that of any other good, increases when it is hard to find. Figure 7 plots the average non-seasonally adjusted weekly earnings across all private employees in Indiana and in the United States between the first quarter of 2014 and the first quarter of 2024. The averages for Indiana are historically lower than those for the nation, as reflected across the entire period, but the gap increases over time and is largest in 2024 when the United States average was $1,179 and Indiana’s was $1,025. Several factors may explain why average national weekly earnings increase faster in the nation than in Indiana, including differential changes in labor shortages, labor productivity, costs, or inflation adjustments.3
Figure 7: Average Weekly Earnings of All Private Employees in Indiana
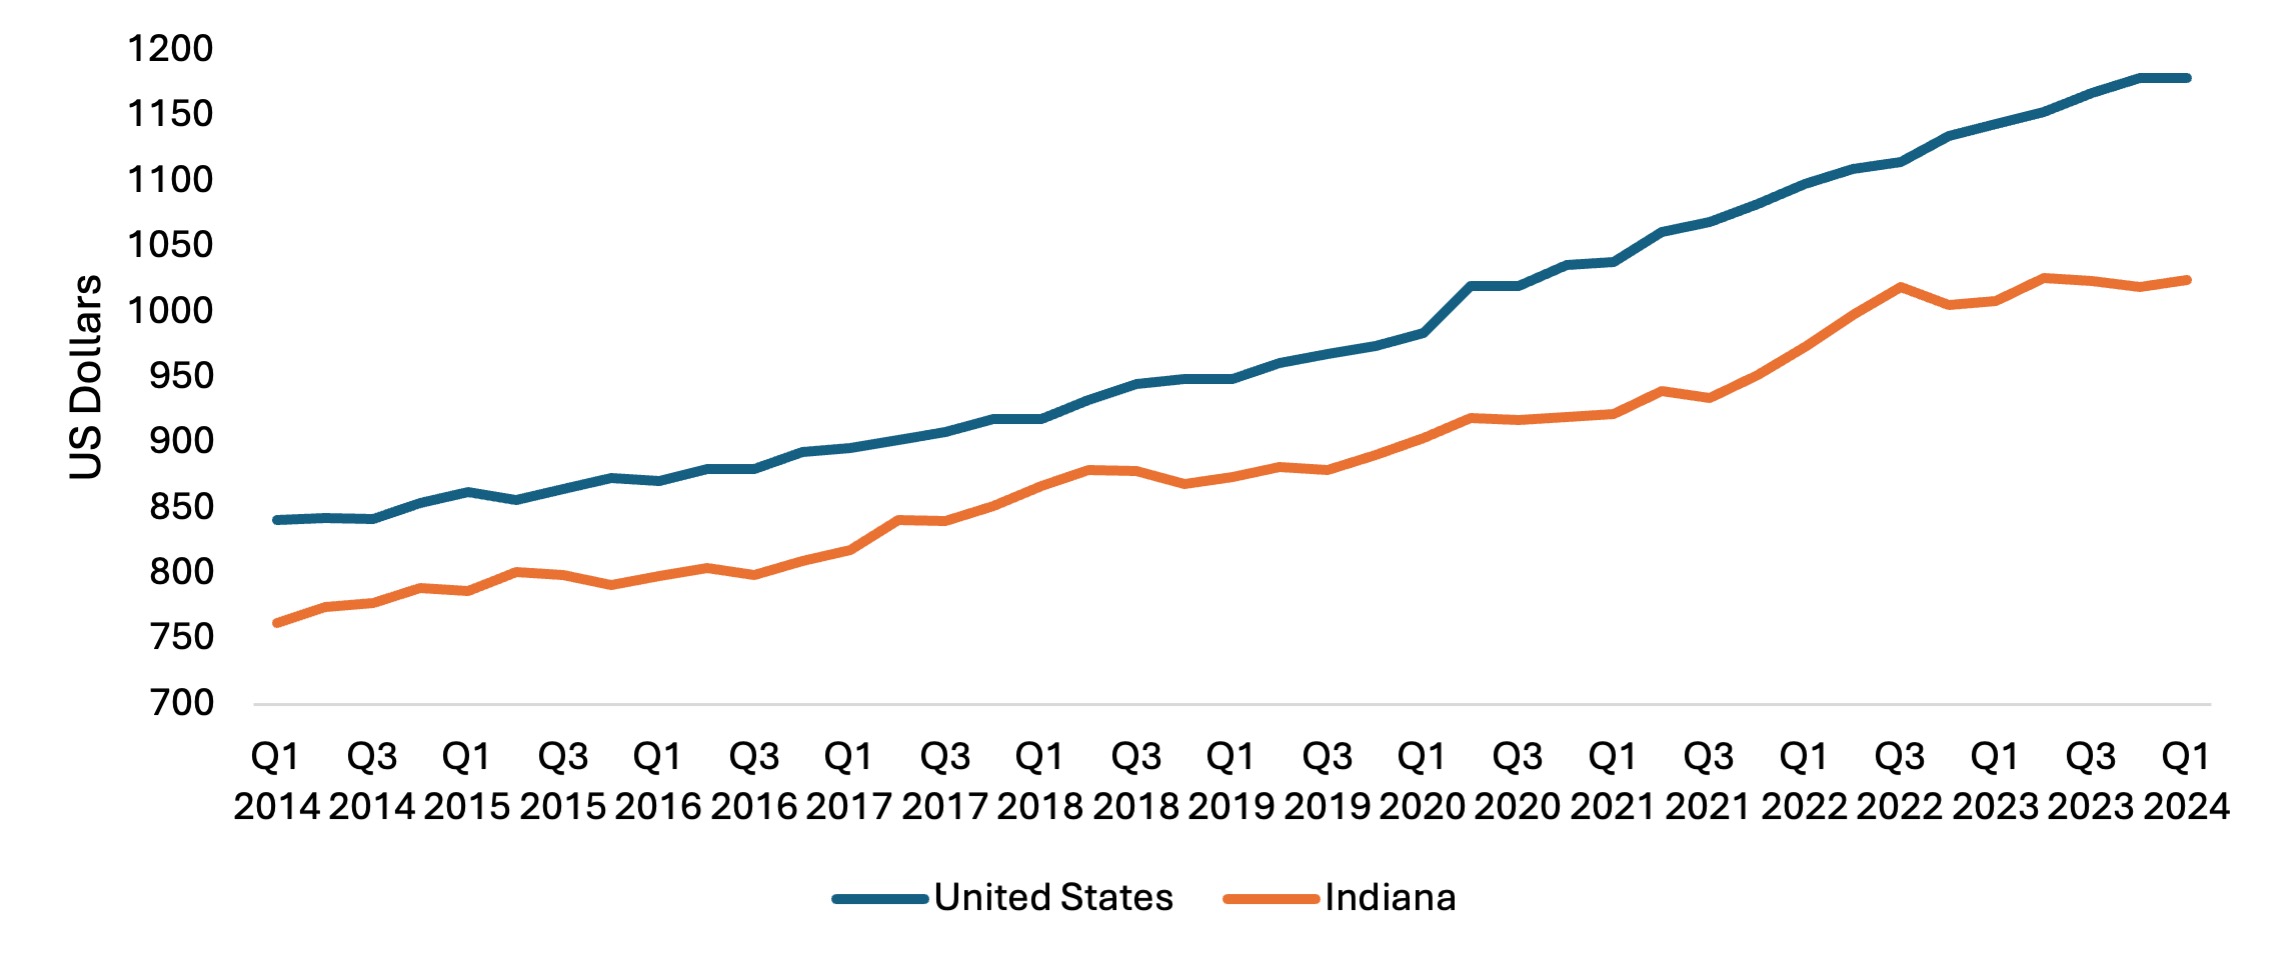
Source: Bureau of Labor Statistics. Numbers are not seasonally Adjusted.
Conclusion
This report shows how Indiana’s key labor market trends have evolved over the last 10 years, notably in the pre- and post-pandemic years. The results consistently show that the COVID-19 pandemic suddenly and substantially affected the labor market experience of Hoosiers and their employers. However, the recovery in the state was fast and steady, and the numbers indicate the temporary presence of a considerable labor shortage in 2021 and 2022. Notably, starting in 2023, the labor market indicators in this report have largely returned to their pre-pandemic levels yet are mirroring trends seen prior to the pandemic.
[1]Author: Laura Montenovo, Assistant Professor, Department of Agricultural Economics, Purdue University. I gratefully acknowledge substantial and helpful comments from Larry DeBoer and Tanya Hall.
[2]2023 is the latest data available. Generally, the charts in the report plot the latest year available in the data.
[3]Tim Slaper, Ph.D., writes about earnings growth differences between Indiana and the nation from the 1950s to 2011 in an article published in the Indiana Business Review of the Indiana Business Research Center.
![]()
![]()
![]()
![]()
![]()