2020 Soybean Price Outlook
December 18, 2019
PAER-2019-21
Authors: James Mintert, Professor of Agricultural Economics & Director of the Center for Commercial Agriculture and Mindy Mallory, Associate Professor, Clearing Corporation Charitable Foundation Endowed Chair of Food & Agricultural Marketing
![]()
![]()
![]()
![]()
![]()
A wet spring that led to severe planting delays in much of the Corn Belt, combined with a corn pre- vented planting option under federal crop insurance that was more attractive than late planting of soy- beans, led to a sharp drop in U.S. soybean acreage in 2019. U.S. farmers planted just 76.5 million acres of soybeans in 2019, down almost 13 million acres compared to 2018. U.S. soybean planted acre- age was the smallest since 2011 which, combined with an estimated national average yield that at 46.9 bushels per acre was down nearly 4 bushels per acre, resulted in a 20% decline in estimated 2019 soybean production compared to 2018. Although there is still some uncertainty about final harvested acreage and yield because of adverse harvesting weather, there is less uncertainty regarding soy- beans than corn. As of early December, USDA esti- mated that U.S. soybean harvest was 96% complete compared to a 5-year average of 99% with North Carolina (75% harvested), Michigan (85% harvested) and North Dakota (92% harvested) falling farthest behind.
We are in the early stages of our third marketing year with U.S. producers facing 25% tariffs on soybean exports to China. The tariff war sharply reduced U.S. soybean exports in the 2018/2019 marketing year. Total exports of U.S. soybeans to all destinations averaged 2.15 billion bushels in the 2016/2017 and 2017/2018 marketing years, but fell 19% below that average in the 2018/2019 marketing year. Although the global supply chain did reshuffle with South America gaining market share in China and the U.S. gaining market share to other destinations, gains in exports by the U.S. to other markets were not large enough to offset reduced access to the Chinese market. U.S. soybean exports to all destinations totaled 1.75 billion bushels in 2018/2019 and USDA anticipates exports in the current marketing year to be just slightly larger, reaching 1.78 billion bushels. Settlement of the trade dispute soon with China could provide a boost to U.S. soybean exports. However, historically the bulk of U.S. soybean exports to Chi- na have been in the fall and early winter before South American supplies are available. So, to provide a significant boost to exports from the U.S. to China in the current marketing year, it’s important to settle the trade dispute sooner rather than later.
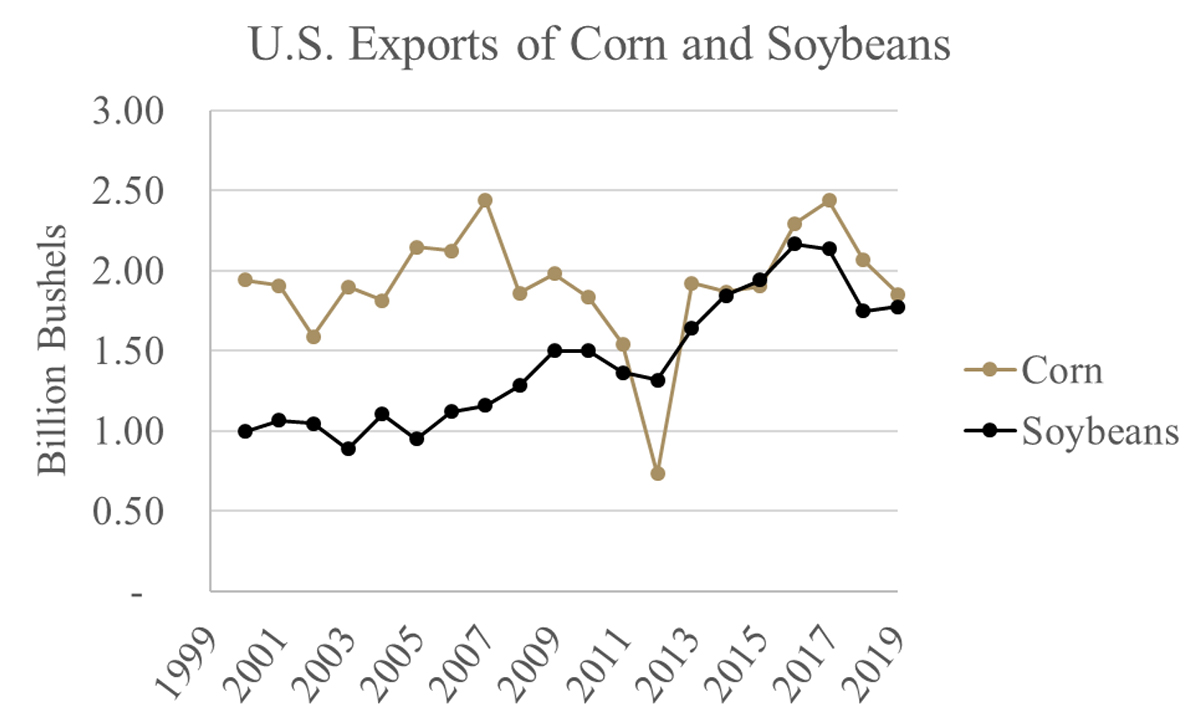
Figure 1. U.S. Exports of Soybeans and Corn in Billions of Bushels (2000-2019)
There are also concerns about how much impact African Swine Fever (ASF) has had on demand for soybeans and soybean meal in China. USDA estimates that hog slaughter and pork production are falling sharply in China as ASF continues to ravage the Chinese pork industry. To help put the impact of ASF in perspective, it’s important to realize just how large the Chinese pork industry is. China is the largest pork producer in the world and as recently as 2017 slaughtered just over 700 million pigs. In comparison, U.S. hog slaughter is expected to set a new record in 2019 at just over 134 million head. But in 2019, as the impacts of ASF became widespread, USDA estimates China’s hog slaughter declined about 15% to 600 million head. Looking ahead to 2020, USDA anticipates a further decline of 27% to just 438 million head. If that turns out to be correct, it would constitute a 38% reduction in hog slaughter since 2017 and a significant decline in demand for soybean meal by the Chinese pork industry.
Even with the uncertainty on the trade front, the large reduction in 2019 soybean production is expected to tighten soybean carryover stocks significantly. Record soybean production in 2018 combined with weak exports produced a soybean carryover into the 2019/2020 marketing year of over 900 million bushels, equivalent to about 23% of to- tal usage. But the combination of a sharp acreage reduction and lower yields this past season is fore- cast to reduce the soybean carryover into the 2020/2021 marketing year to less than 500 million bushels, equivalent to about 12% of usage.
Based in part upon that ending stocks estimate, USDA forecasts the 2019/2020 marketing year average price to improve by about 37 cents compared to last year, which would yield a $8.85 U.S. average price. But there are a lot of moving parts to watch out for in the forecast. Although the administration announced a large Phase One trade deal with China in mid-December, very few details were made avail- able making it difficult to speculate on the deal’s possible impact. Continued delays on the trade front could weigh on prices this winter. Although soybean stocks are expected to be much tighter at the end of the 2019/2020 marketing year than a year earlier, they are still not down into the range that led to significantly higher price levels in recent years. For example, ending stocks beginning with the 2007/2008 marketing year through the 2016/2017 marketing year averaged just 5% of usage. In comparison, even with this year’s sharp stocks draw- down, U.S. soybean ending stocks are projected to total 12% of usage. As a result, it would likely take a big weather event in South America this winter to produce a sharp rally in soybean prices.
Looking ahead to 2020, look for a large increase in acreage compared to 2019, assuming a return to more typical weather. A return to a trend line national average yield of about 48 bushels per acre combined with a planted acreage of 85 million acres would boost 2020 production by approximately 500 million bushels compared to this year. If usage is held constant near this year’s level, that implies a carryover into the 2021/2022 marketing year of just over 13%, just slightly larger than the projected carryover into the 2020/2021 marketing year, which would likely yield an average price near $9.00 per bushel.
![]()
![]()
![]()
![]()
![]()