2024 Agricultural Credit Outlook
January 16, 2024
PAER-2024-10
Brady Brewer, Associate Professor of Agricultural Economics; and Todd Kuethe, Professor and Schrader Endowed Chair in Farmland Economics
![]()
![]()
![]()
![]()
![]()
2023 saw increasing interest rates, stable land values and lower farm profits relative to the year before. Overall, it was a good year for farmers balance sheets for both short-term and long-term assets. Overall, farmers have benefited from several years of higher net incomes, meaning that liquidity is high. This has resulted in some farmers decreasing operating loans to avoid higher interest rate costs which has pushed the demand for loans downward. This article examines the trends in three key parts of the agricultural credit markets: interest rates, the demand for loans, and non-performing loans. We examine data obtained from the two Federal Reserve banks that serve Indiana. As shown in Figure 1, 68 counties in northern and central Indiana are part of the Federal Reserve Bank of Chicago region, and the remaining 24 counties in southern Indiana are part of the Federal Reserve Bank of St. Louis.
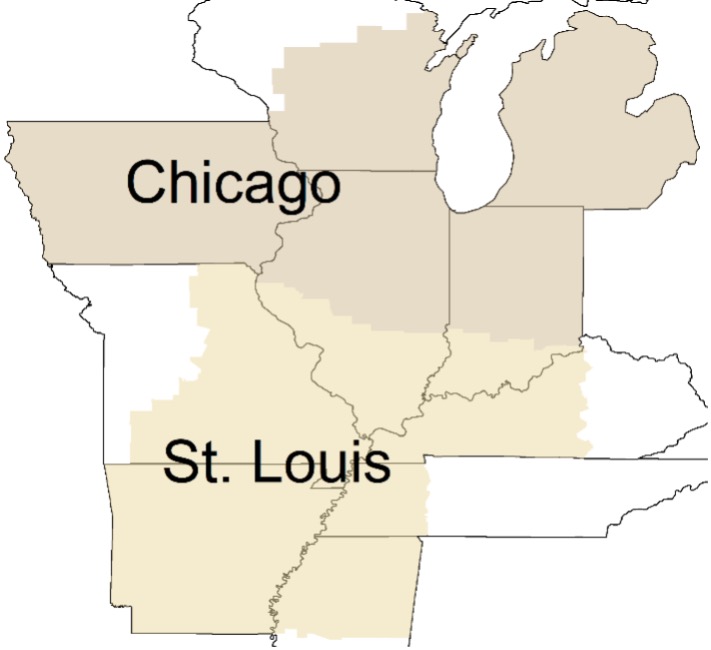
Figure 1. Chicago and St. Louis Federal Reserve Districts
Both Federal Reserve banks conduct quarterly surveys of agricultural bankers in their region. The surveys address important issues in farmland and agricultural credit markets. It is important to note that both Federal Reserve regions cover a large areas with diverse agricultural sectors. Thus, local conditions may deviate from broad, regional trends. At the time of writing, data for the St. Louis Federal Reserve district were available through the third quarter of 2023 through the Federal Reserve Bank of Kansas City’s Agricultural Finance Updates, and data for the Chicago Federal Reserve district were available through the third quarter of 2023 through the bank’s AgLetter publication.
Interest Rates
Interest rates have increased around 4 percentage points from 2022 to the end of 2023. The Federal Open Market Committee (FOMC), a twelve person committee consisting of members of the board of Governors from the Federal Reserve System and presidents from the eleven Reserve Banks, raised the Fed Funds Rate1 four times in 2023, this was after 7 consecutive increases in 2022. Figure 2 plots the average interest rate on farm operating loans since the first quarter of 1991 for the Chicago fed district and the second quarter of 2012 for the St. Louis Fed district. Farm operating loans are defined as those used primarily to finance current crop production expenses and the care and feeding of livestock (including poultry). Data for the St. Louis district does not go back as far as the data for the Chicago district does; however, the longer time period is being shown as it helps put perspective on the increases in interest rates that were experienced in 2023.
The latest data available for each of the two Federal Reserve’s that cover Indiana is from the 3rd quarter of 2023. Operating loan interest rates for the Chicago Fed district were 8.77% while operating loan interest rates for the St. Louis Fed district were 8.5%. At the beginning of 2023, operating loan interest rates were 7.9% for the Chicago Fed district and 7.99% for the St. Louis Fed district. Interest rates increased 0.60 percentage points for the Chicago Fed district and 0.78 percentage points in the St. Louis Fed district. In comparison, this same time period for last year, in 2022, saw 1.9 and 1.25 percentage point increases for the Chicago Fed district and St. Louis Fed district, respectively. This is the highest interest rates the Chicago Fed district has seen since the 2nd quarter of 2007. This is the highest interest rates the St. Louis Fed district has seen in the recorded data which goes back to the 1st quarter of 2012.
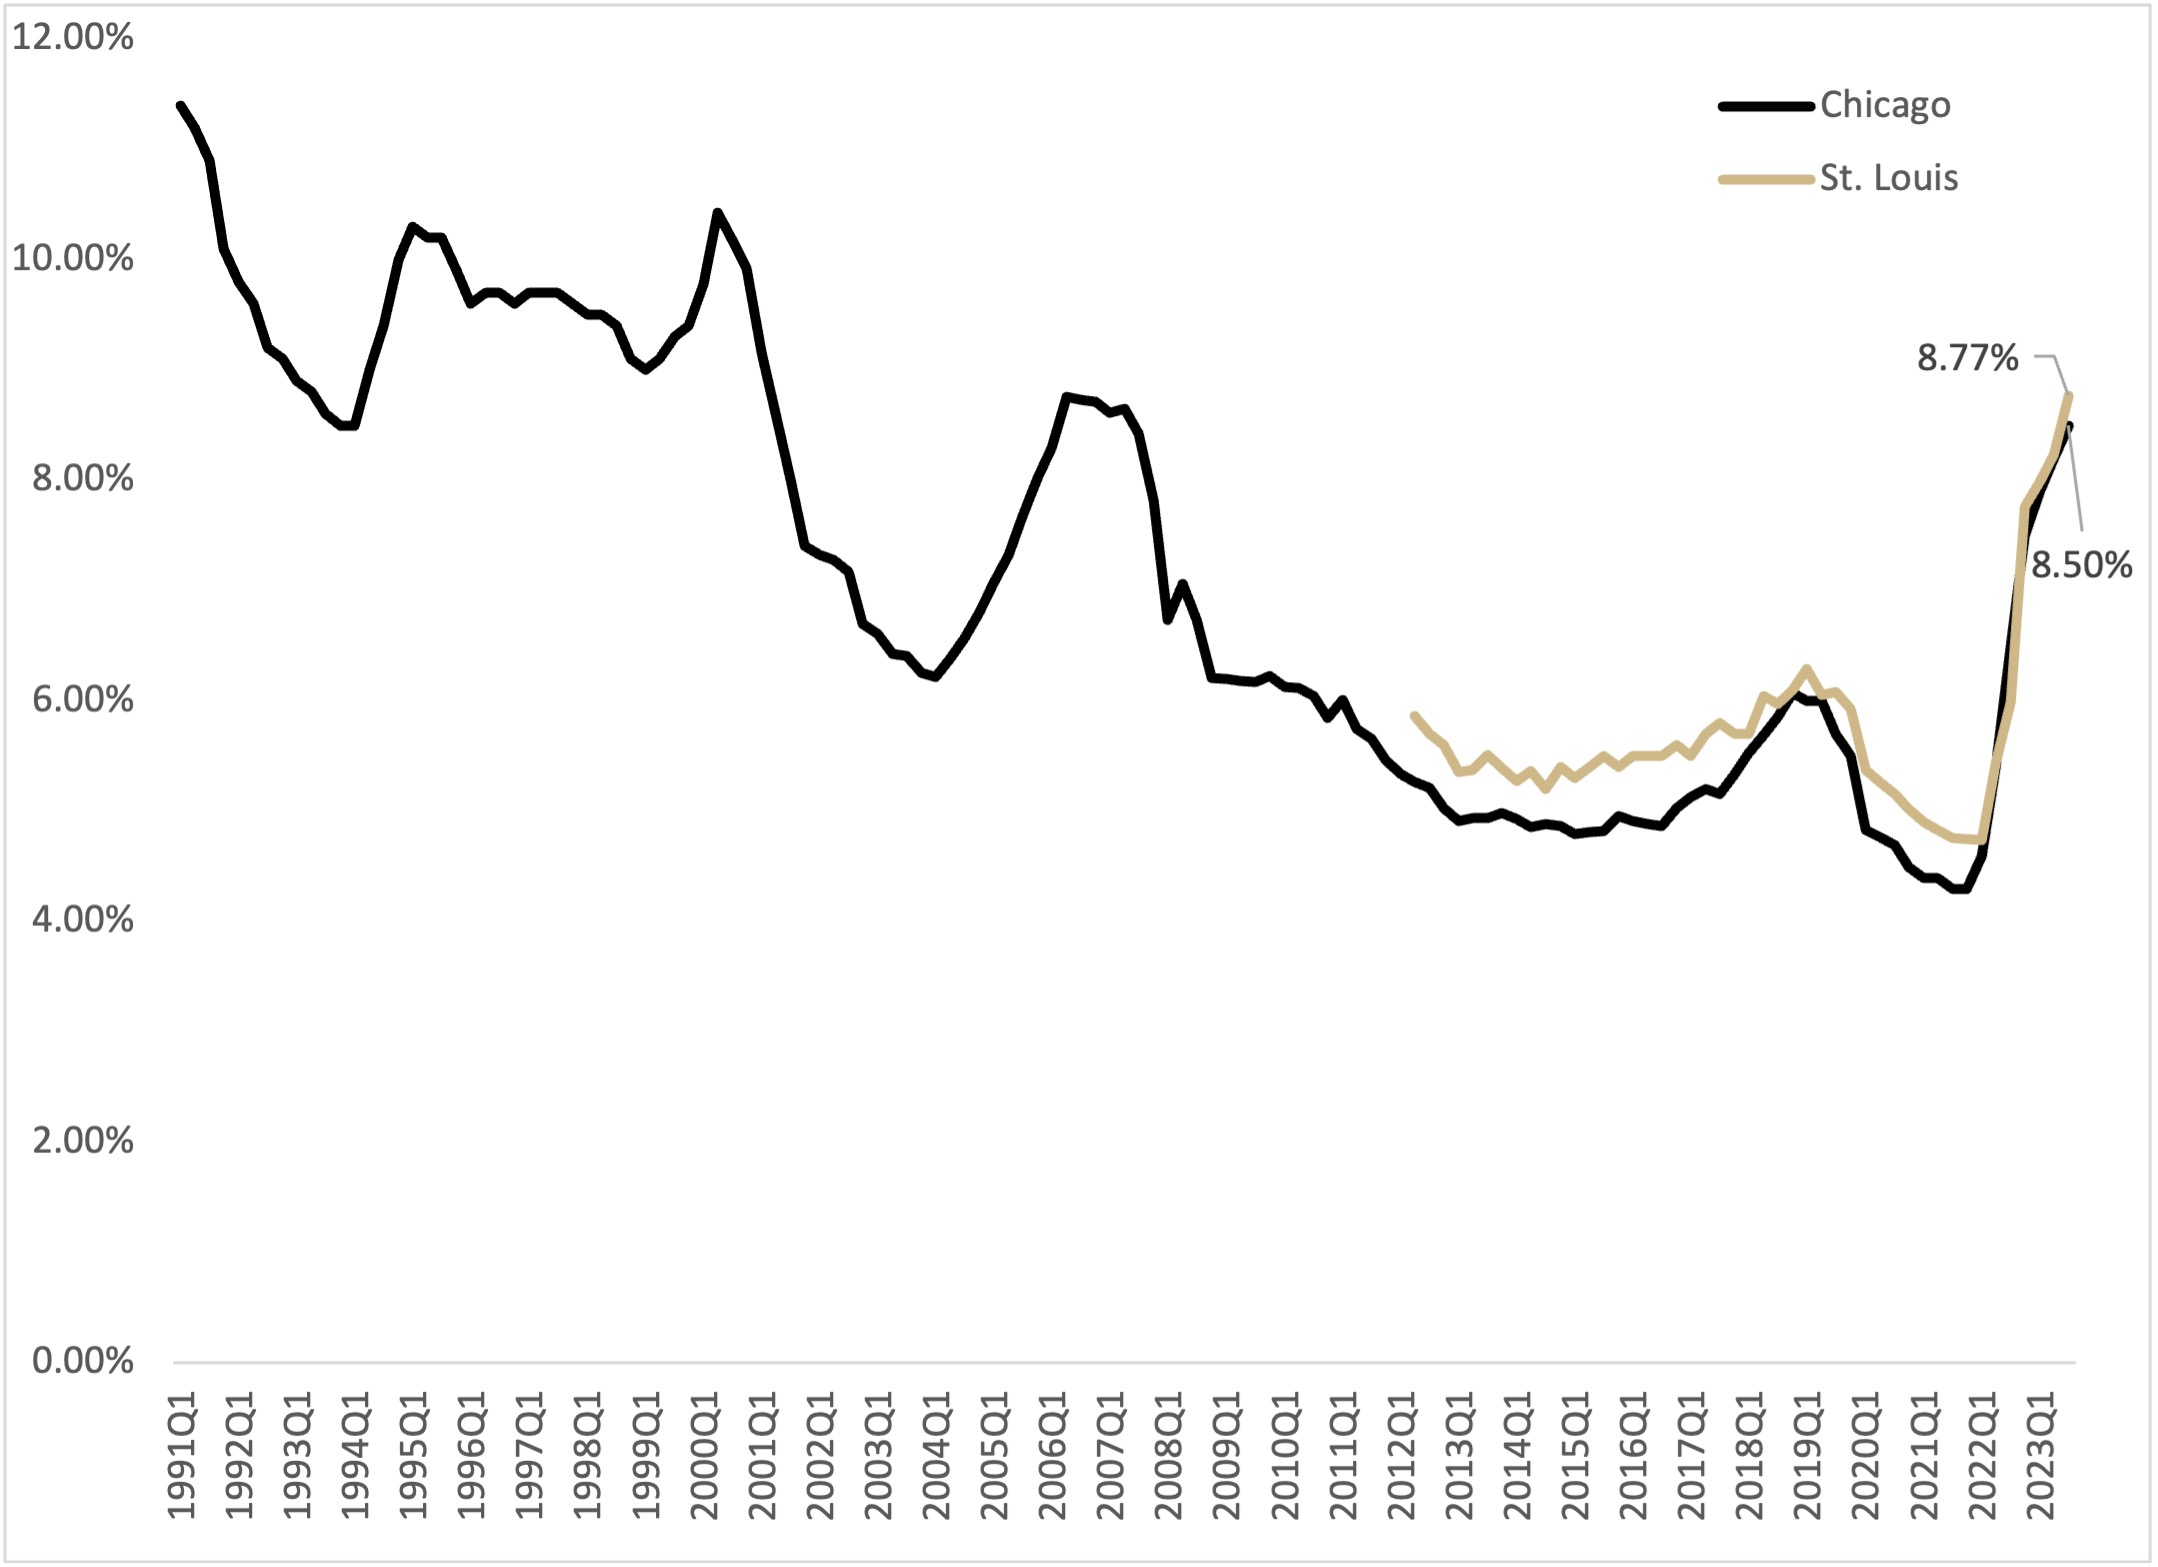
Figure 2. Average Fixed Interest Rate on Operating Loans, 1991Q1 – 2023Q3
Figure 3 plots the average fixed interest rates on long-term farm real estate loans. The most recent survey results suggest an average farm mortgage rate of 7.7% in the Chicago Fed district and 8.41% in the St. Louis Fed district. These interest rates are up 0.6 percentage points in the Chicago Fed district from the 1st quarter of 2023 where they averaged 7.1% and they are up 0.5 percentage points in the St. Louis Fed district where they averaged 7.81% in the first quarter of 2023. While 2023 saw interest rate increases for farm real-estate loans, the size of the increase is less than what farmers saw in 2022. This is the highest farm real estate interest rate since the 2nd quarter of 2007 in the Chicago Fed district and the highest interest rate since the data has been collected which started in the 2nd quarter of 2012.
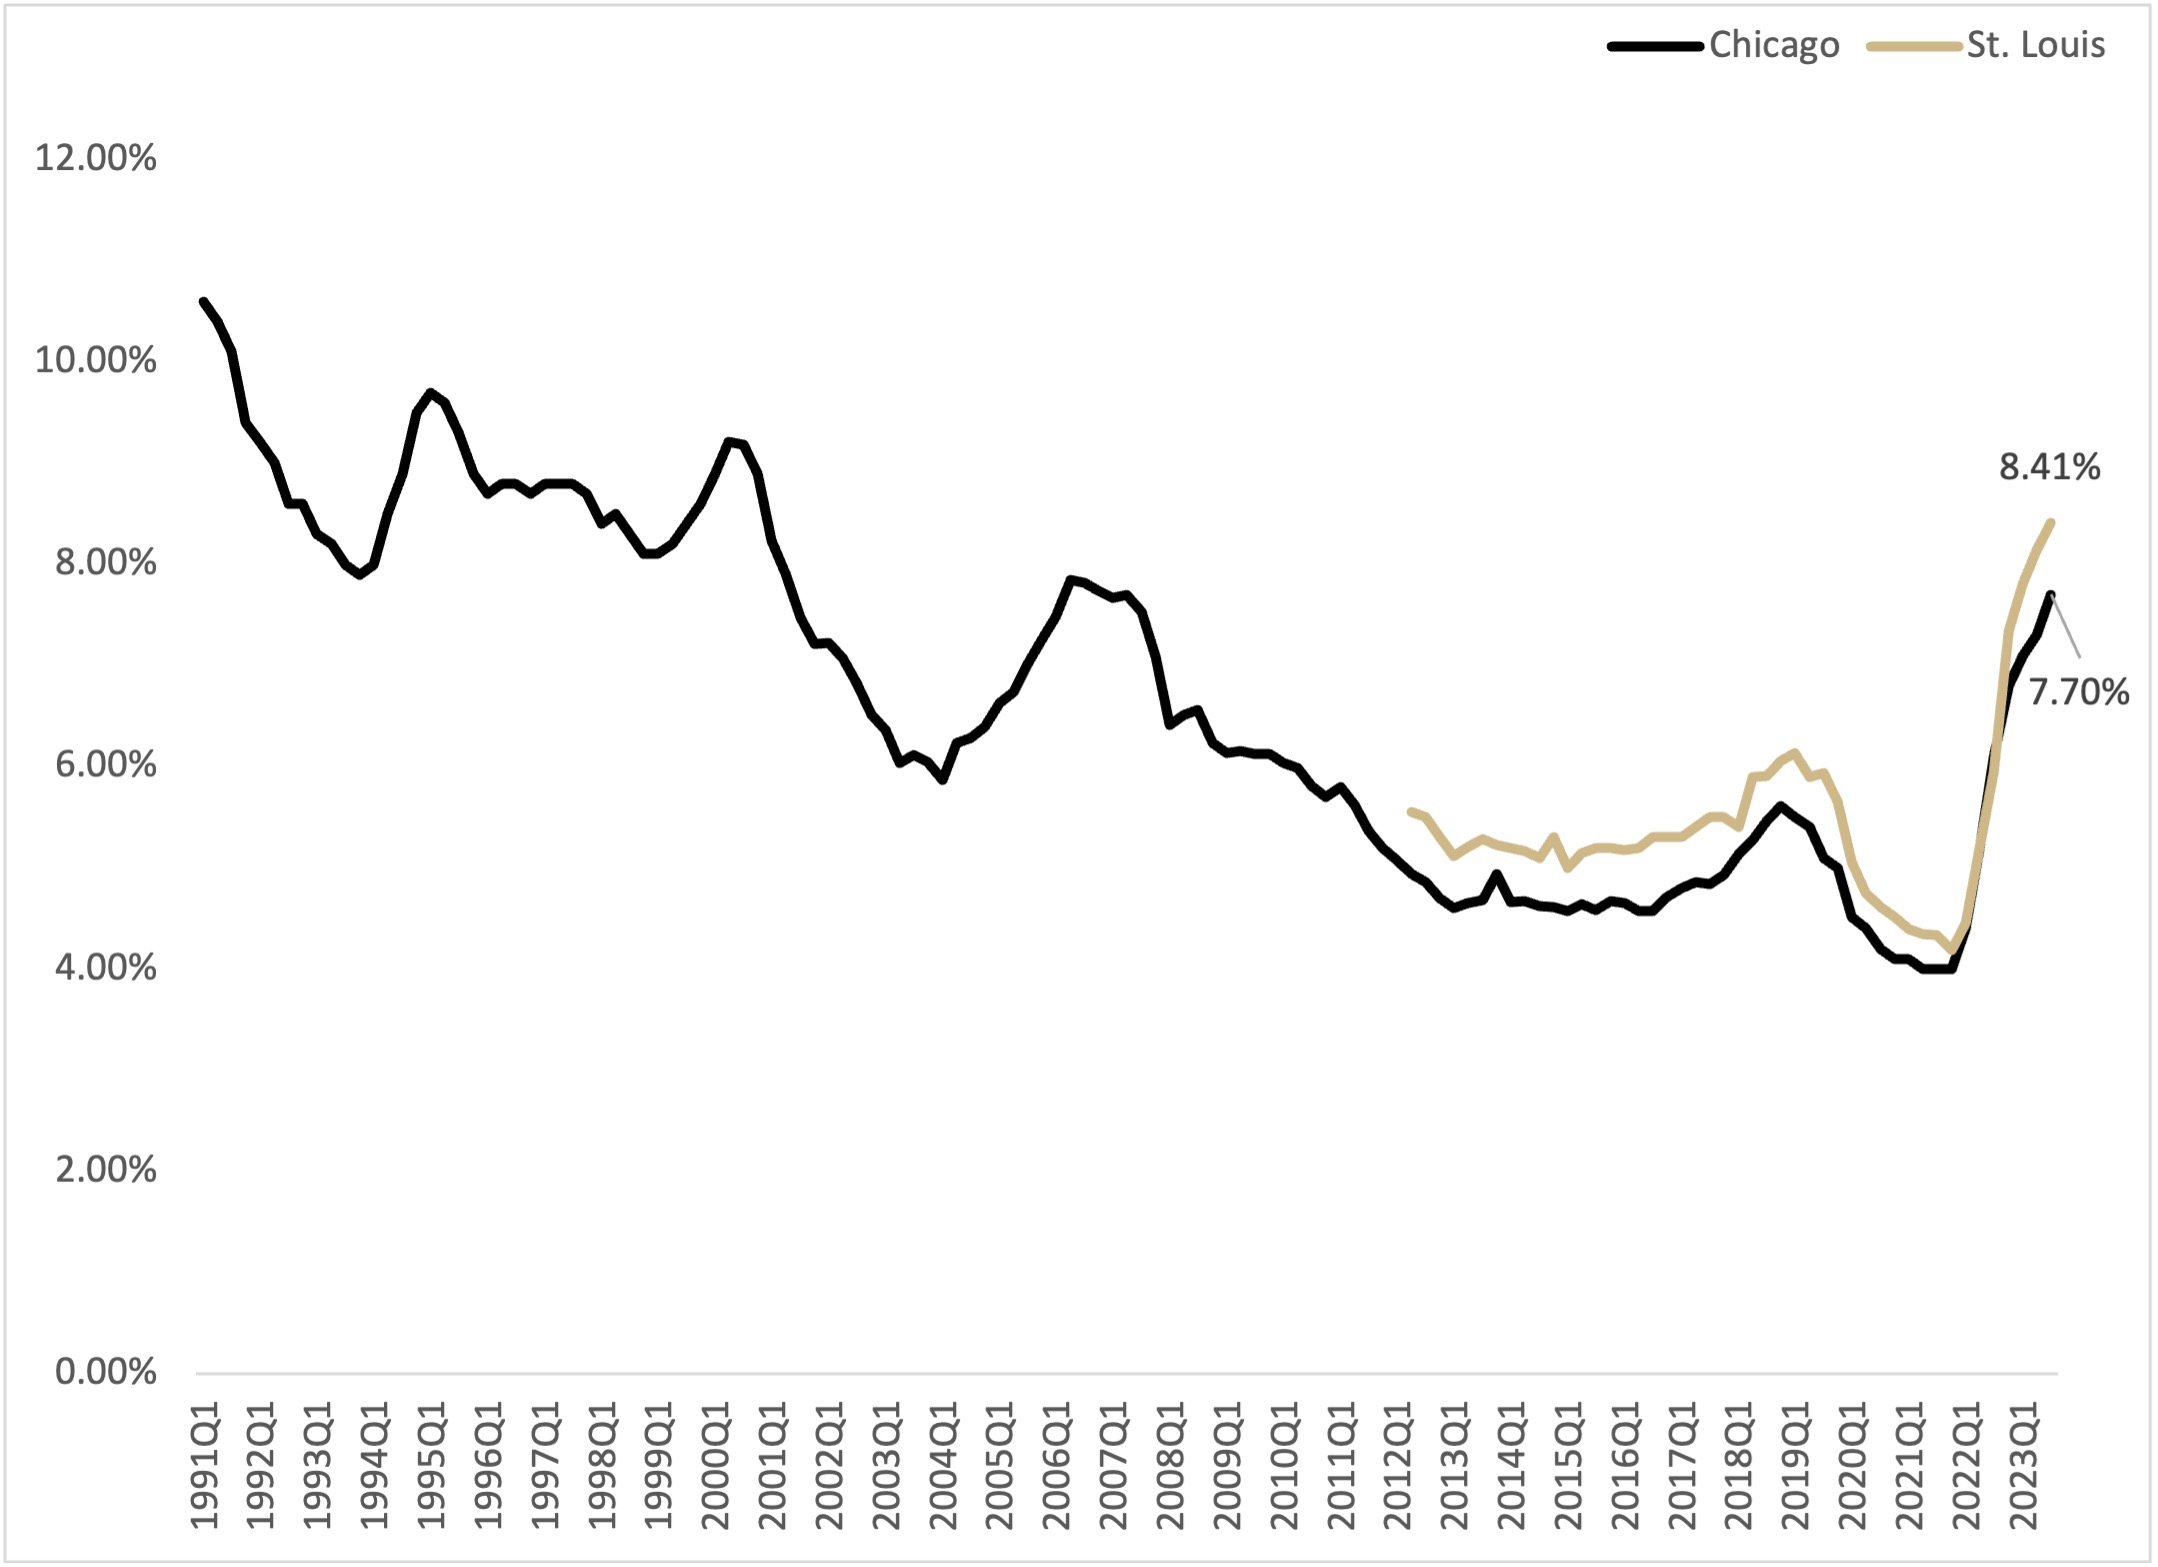
Figure 3. Average Fixed Interest Rate on Long Term Farm Real Estate Loans, 1991Q1 – 2023Q3
One key predictor of where interest rates will go is the Fed Funds rate. Every other FOMC meeting, the “Summary of Economic Conditions” is released. This summary represents the views on certain economic indicators by the FOMC committee. In this summary, it is expected that the Fed Funds rate will decrease in 2024 to a target range of 4.5% to 4.75%
Whether we see a decrease in the Fed Funds comes to fruition will in large part rest on if the US economy continues to see inflation impacting consumers purchasing power along with the labor market remaining strong. While it is unlikely that inflation will return to the Fed Reserves target of 2% in 2024, if it eases enough, we may see the Fed be more aggressive in returning the Fed Funds rate toward their long-run target of 2.5% to 2.75% as reported in the “Summary of Economic Conditions”.
Demand for Loans And Bank Condition
The Federal Reserve Bank surveys ask agricultural bankers to rate the demand for loans at their institution relative to a year earlier. Respondents report whether the demand for loans is “higher,” “lower,” or the “same.” These responses are summarized by a loan demand index, calculated as the share of lenders reporting “higher” minus those reporting “lower” plus 100. Thus, when the loan demand index is less than 100, the demand for agricultural loans is decreasing. Figure 4 shows that the demand for agricultural loans decreased in 2023 relative to 2022, which continued the trend that started in 2022. Agricultural bankers reporting lower demand for agricultural loans has remained steady over the past two years. This is in large part due to ample amounts of liquidity at the farm level along with higher interest rates for operating and farm real-estate loans.
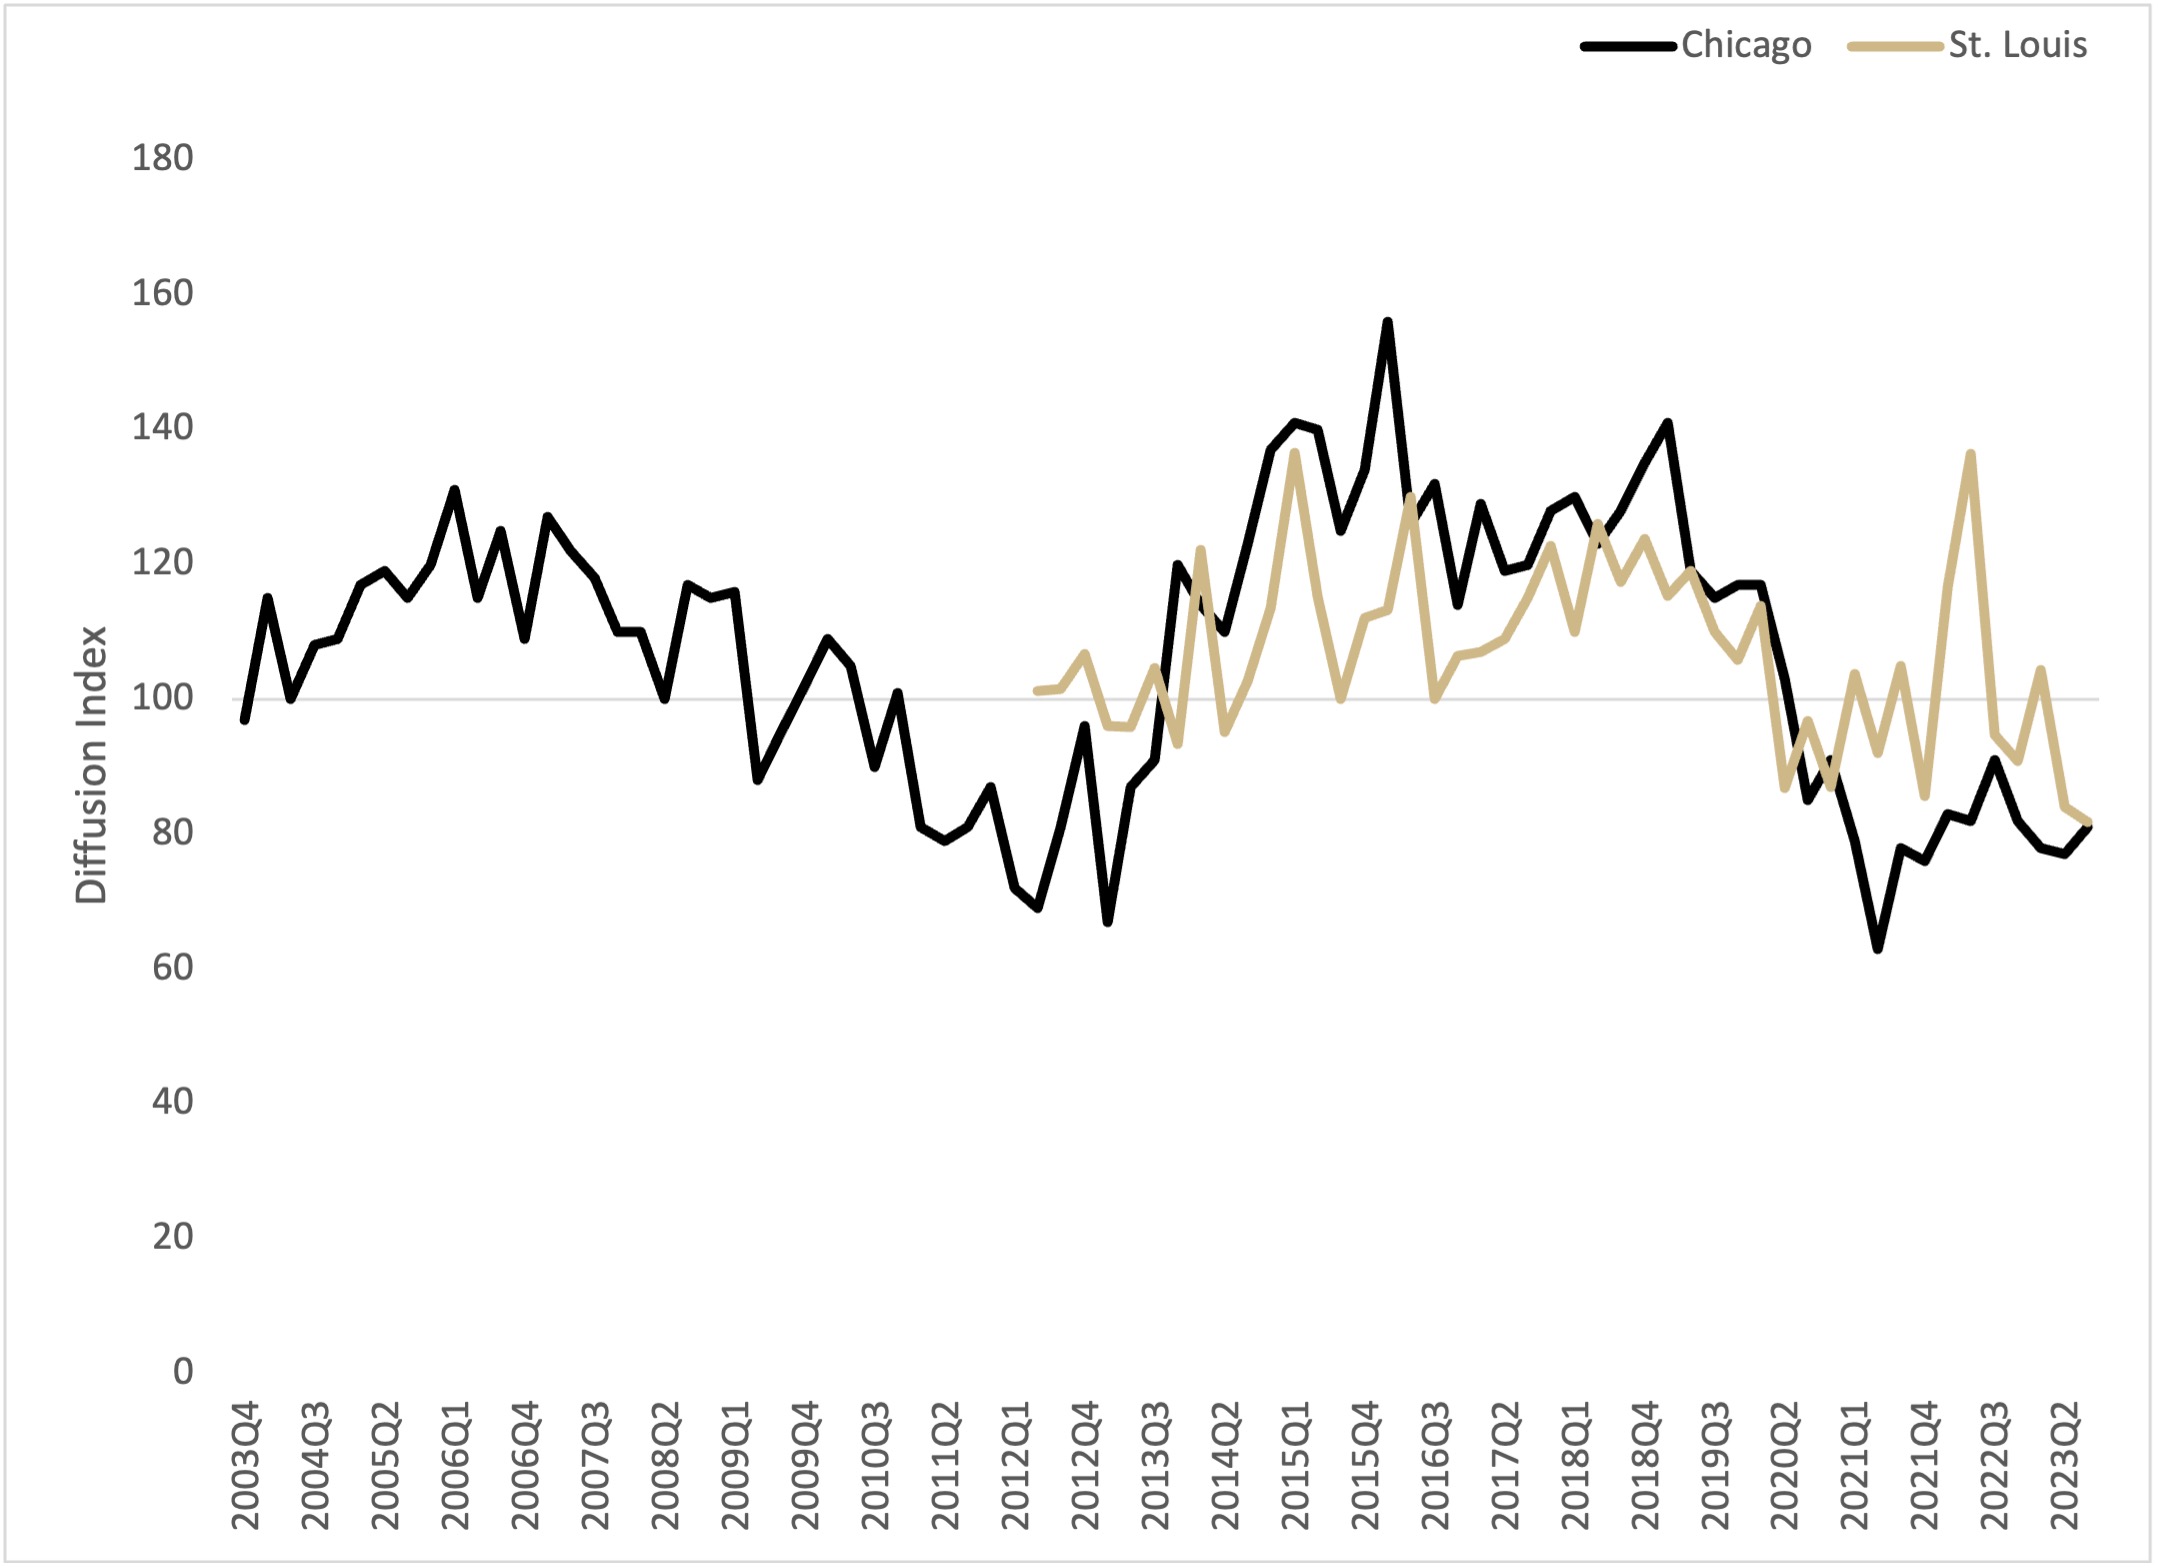
Figure 4. Demand for Agricultural Loans, 2003Q3-2023Q3
A trend that started in 2022 was that bankers reported less funds available to loan out than in previous years. This trend has continued through 2023 as agricultural bankers in the Chicago Fed district and the St. Louis Fed district continue to report lower amount of funds available to loan out. This is in large part driven by lower deposits at lending institutions as the rate of return for certain investments has increased, incentivizing customers to withdraw cash to invest in other assets. However, there isn’t, to date, any indication that banks are stressed, but does show that there may be a tightening of deposits and other funds that have been available. This will be something to keep an eye on throughout 2024.
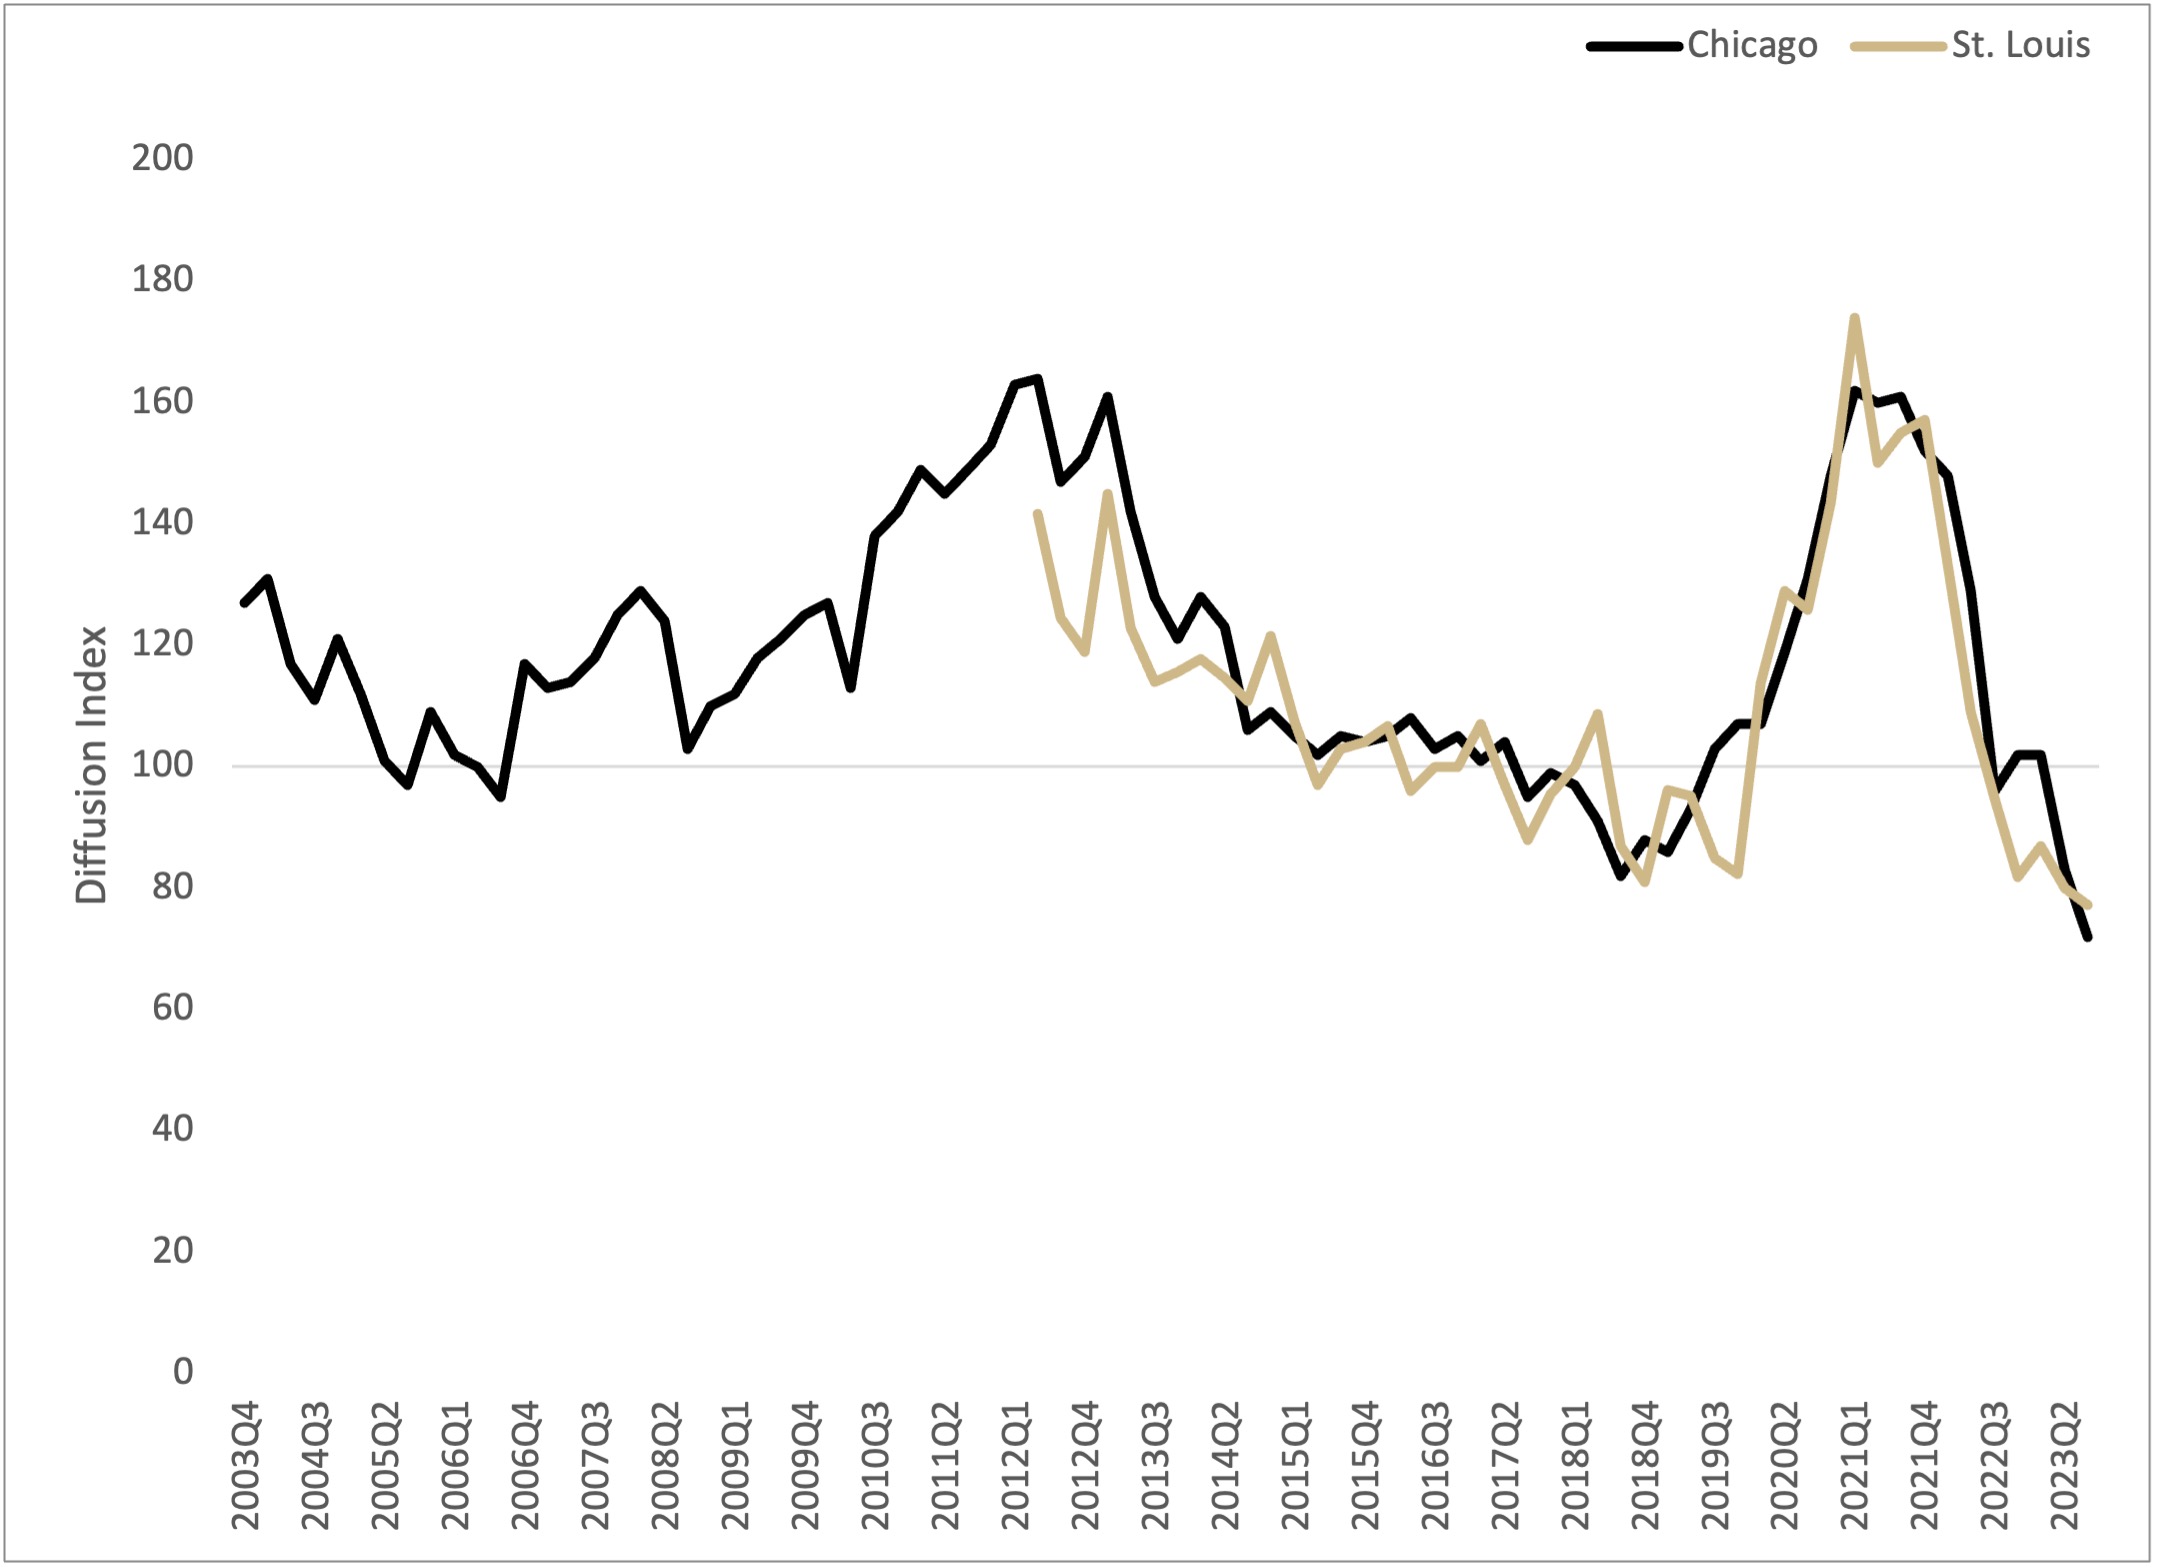
Figure 5. Availability of Funds at Agricultural Banks, 2003Q3 – 2023Q3
Non-Performing Loans
Farmers’ rate of loan repayment declined in 2023, a continuation of a trend that started in 2021. However, the index is still above 100, indicating that loan repayment is still strong, it has just fallen from the highs that were seen in 2021. The index is similarly constructed based on lenders reported repayment rates relative to the same quarter of the previous year. Given that the loan repayment rate index for Chicago is exactly 100, the index suggests that farmers saw no change in their ability to pay off debts relative to a year ago. The St. Louis Fed index is 104 for the 3rd quarter of 2023, indicating farmers were able to pay off slightly more of their debts relative to a year ago. This suggests that repayments rates are still strong in agriculture, although this index has fallen from a year ago.
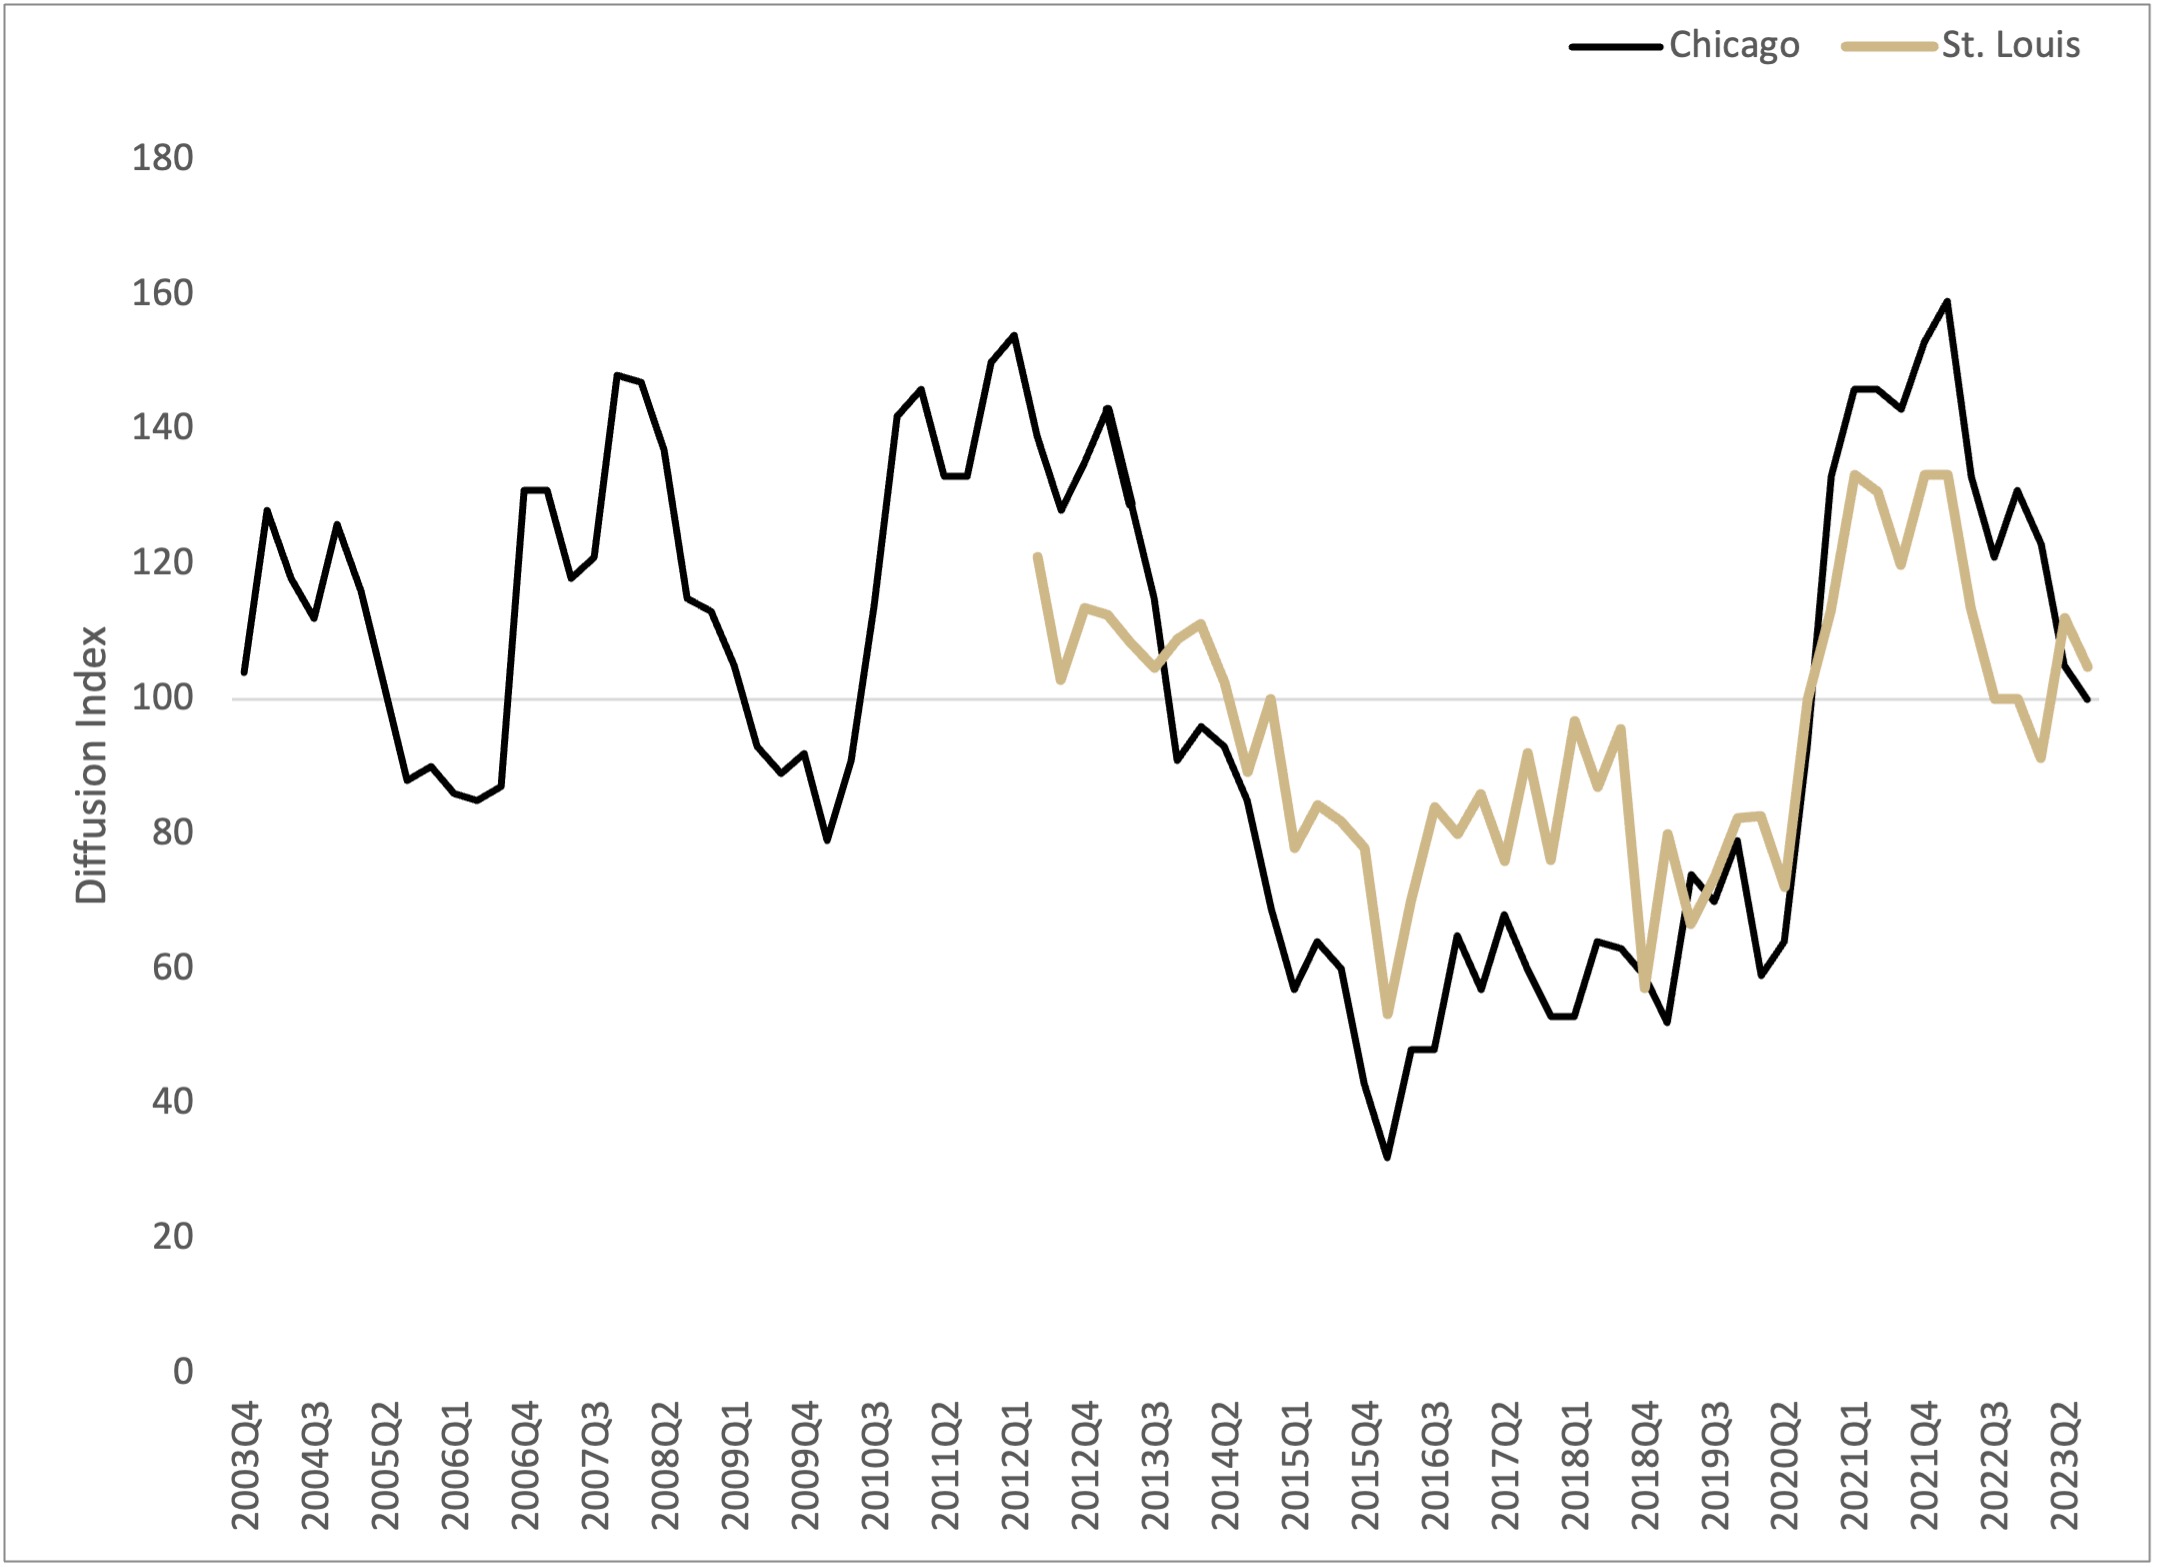
Figure 6. Loan Repayment Index, 2003Q3 – 2023Q3
Overall, the data shows a positive story for the 2024 agricultural credit market. Farm incomes were down in 2023 relative to 2022, but liquidity remains strong in the agricultural sector. Despite the decrease in farm income, bankers stable to slightly higher rates of repayment from farmers they lend to. Additionally, demand for loans is on a trajectory such that farmers will have lower amounts of operating loans for the 2024 growing season, which means that if farm incomes do fall and cash flow were to be an issue, there is less debt out that may become troubled. Interest rates are also on an downward trajectory as well. If the Fed Funds Rate does indeed start to fall in 2024, we can expect the interest rate the farmers pays to decrease similarly. Even if the ag credit market takes a step back, or even two, it is still well positioned to serve the agricultural sector.
References
Federal Open Market Committee (2023) “Summary of Economic Projections” Federal Reserve
Federal Reserve Bank of Kansas City (2023) “Ag Finance Updates” Third Quarter Federal Reserve District Ag Credit Surveys.
Oppedahl, D. (2023) “Farmland Values and Credit Conditions” AgLetter No. 2002, Federal Reserve Bank of Chicago.
1 The Fed Funds Rate is the interest rate at which deposit granting institution (i.e. banks) trade federal funds with each other.
![]()
![]()
![]()
![]()
![]()