COVID-19 Weakens Ethanol Demand Leading to Reduction in Corn Usage Forecast
April 13, 2020
PAER-2020-03
Authors: Farzad Taheripour, Research Associate Professor and James Mintert, Professor and Director of the Center for Commercial Agriculture
![]()
![]()
![]()
![]()
![]()
As recently as March 2020, USDA projected that 37 percent of the 2019 corn crop would be used to produce ethanol with about 40 percent of the 2019 crop expected to be consumed as animal feed. But the decline in oil and gasoline prices that started prior to the advent of COVID-19, combined with weak consumer demand for gasoline as a result of recent orders for consumers to shelter in place and the U.S. economy’s descent into recession, makes it clear that corn usage will be much lower than was forecast earlier this year. To determine by how much demand for corn to produce ethanol and dried distillers grains with solubles (DDGS) will shift in the weeks and months ahead, we start by considering the impact of reduced gasoline prices on ethanol prices and the resulting impact on ethanol plant operating margins. We then consider changes in gasoline usage by consumers both near-term, in response to sheltering in place, and longer term as the U.S. economy attempts to climb out of recession. Results indicate that the impact on total corn usage could be quite large resulting in a significant boost to corn ending stocks at the end of the 2019 crop year.
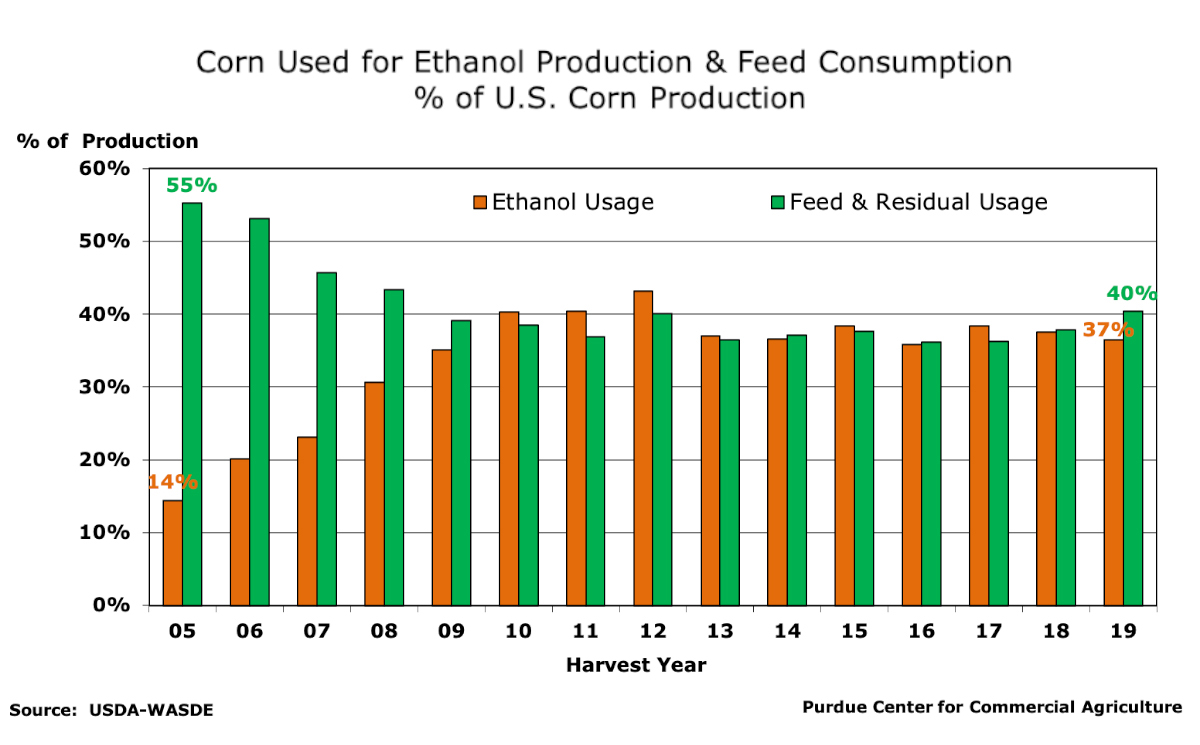
Figure 1. Percentage of U.S. Corn Production Used for Feed Consumption and Ethanol Production, By Harvest Year, 2005-2019.
Historically, the largest single use category for corn was feed for animal agriculture, often accounting for usage of approximately 60 percent of each year’s corn production. But that began to change early in this century as corn became an important input in energy production. Since the early 2000s corn used to produce ethanol has increased dramatically. In recent years corn used to produce ethanol and the resulting DDGS byproduct has grown from just 14 percent of U.S. corn production in 2005 to an average of 37 percent of U.S. corn production from the 2014 through 2018 crop years (Figure 1). Ethanol is blended into gasoline, primarily at a rate of 10 percent, and as a result ethanol usage is closely tied to gasoline usage. As recently as December the rack price for unleaded gasoline in Omaha, Nebraska averaged $1.82 per gallon. But after weakening modestly early this year, the rack price for unleaded gasoline fell precipitously in March 2020, averaging just $1.14 per gallon in Omaha as oil production by major producers surged and worldwide demand for fuel used in transportation weakened.
Ethanol values at Omaha, which reached a near-term monthly average peak in November 2019 at $1.44 per gallon, began to weaken in late 2019 and early 2020, falling to $1.03 per gallon in February before dipping below $1 in March to average just $0.84 per gallon. The decline in ethanol value of over 40 percent from November 2019 to March 2020 put tremendous pressure on ethanol plant operating margins. Iowa State University’s Center for Agricultural and Rural Development (CARD) estimates indicate daily ethanol plant operating margins above variable production costs peaked in November at $0.36 per gallon of ethanol produced, but declined in early 2020 and by mid-March were negative. The inability to recoup variable production costs provided a clear signal to ethanol producers to consider shutting down ethanol plants. In late March and early April, a cascade of announcements ensued from various ethanol producers that they were shutting down plants or delaying scheduled plant openings leading to a sharp reduction in corn usage.
A key question in estimating the impact on corn demand originating from reductions in ethanol production is how large will the short-run impact on consumer behavior be and how rapidly will ethanol production recover once restrictions are lifted? Recently, Scott Irwin and Todd Hubbs, agricultural economists at the University of Illinois, provided a short-run estimate of the impact of reduced ethanol production on U.S. corn demand, estimating that a combination of shelter in place, social distancing and other consumer movement restrictions would lead to a weighted average reduction in gasoline usage of approximately 11 percent in March and 33 percent in April. They assume restrictions on consumer movement and business activity will be relaxed in May leading to a much smaller reduction in gasoline usage of about 17 percent. They implicitly assume a return to normal gasoline usage by June. Their assumptions lead them to estimate that corn used to produce ethanol from March through May would decline by 256 million bushels because of reduced gasoline usage. When adjusted for reduced availability of DDGS, they estimate a decline in corn usage of 181 million bushels.
Our analysis builds upon Irwin and Hubbs. We consider three possible corn demand scenarios: 1) 40% reduction in short-run gasoline usage; 2) 50% reduction in short-run gasoline usage and 3) 60% reduction in short-run gasoline usage. Second, we assume that the recovery in economic activity will be gradual and that reductions in corn demand will continue through the summer and into the fall, providing a gradual recovery in fuel demand and corn consumption rather than the abrupt recovery implied by Irwin and Hubbs. Each scenario assumes that the reduction in gasoline usage will decline each month after April. For example, in the most pessimistic scenario (scenario 3), we assume a 60% decline in gasoline usage in April, a 50% decline in May, followed by a 40% decline in June, a 30% decline in July and a 22% decline in August. We assume a similar gradual change in fuel usage, and therefore corn usage, for the other two scenarios as well[1].
The three scenarios we consider for reductions in short-run gasoline consumption lead to markedly different outcomes with regard to corn used for ethanol production, but all three are larger than the impact estimated by Irwin and Hubbs. Table 1 provides estimates of the reductions in corn demand, net of the shift in corn usage by animal agriculture given reduced availability of DDGS, by month for the three scenarios outlined previously. To keep estimates consistent with the annual corn balance sheets, which are estimated on a crop year basis, we focus on the estimated impact on the 2019 corn crop balance sheet. Under scenario 1, corn consumption for ethanol production in the 2019 crop year declines by about 350 million bushels. Under scenario 2, the corn consumption loss rises to nearly 500 million bushels and under scenario 3 corn used for ethanol production declines by over 600 million bushels. Although there is a large amount of uncertainty surrounding these estimates given the assumptions used to generate them, notice that the smallest estimate of reduced corn consumption, which is provided by scenario 1, is nearly double the estimated loss in corn consumption during the 2019 crop year estimated by Irwin and Hubbs, in part because Irwin and Hubbs assume reductions in gasoline usage will disappear after May.
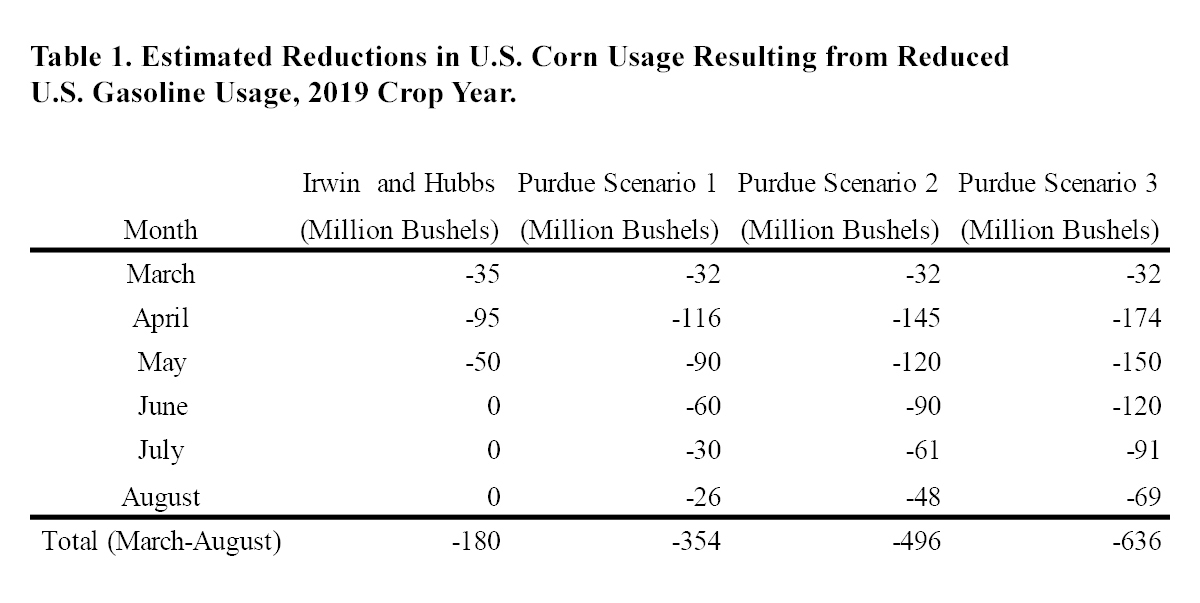
Table 1. Estimated Reductions in U.S. Corn Usage Resulting from Reduced U.S. Gasoline Usage, 2019 Crop Year.
Holding other estimated sources of corn demand constant at the levels forecast by USDA in March 2020, the reductions in corn usage for ethanol production result in a substantial increase in the expected carryover of corn from the 2019 crop year into the 2020 crop year. To put it in perspective, back in March USDA forecast corn ending stocks at the conclusion of the 2019 crop year of 2.3 billion bushels with an ending stocks/total usage ratio of 17 percent. Scenario 1 in our analysis implies ending stocks would rise to nearly 2.7 billion bushels, leading to an ending stocks/total usage ratio of 20 percent. Scenario 3, with the largest reduction in corn used to produce ethanol of the three scenarios we examined, would lead to ending stocks rising to nearly 3 billion bushels and an ending stocks/total usage ratio of 23 percent. Figure 2 provides some historical perspective on corn ending stocks expressed as a percentage of total usage. Scenarios 1 and 2 would potentially boost ending stocks to levels last seen in 2004 and the late 1990s. Scenario 3 would potentially boost ending stocks back to just below the large ending stocks of 1992. All three scenarios imply that corn prices for the remainder of the 2019 crop year will remain under pressure and the increase in corn ending stocks at the end of the marketing year will depress prices for the 2020 crop.
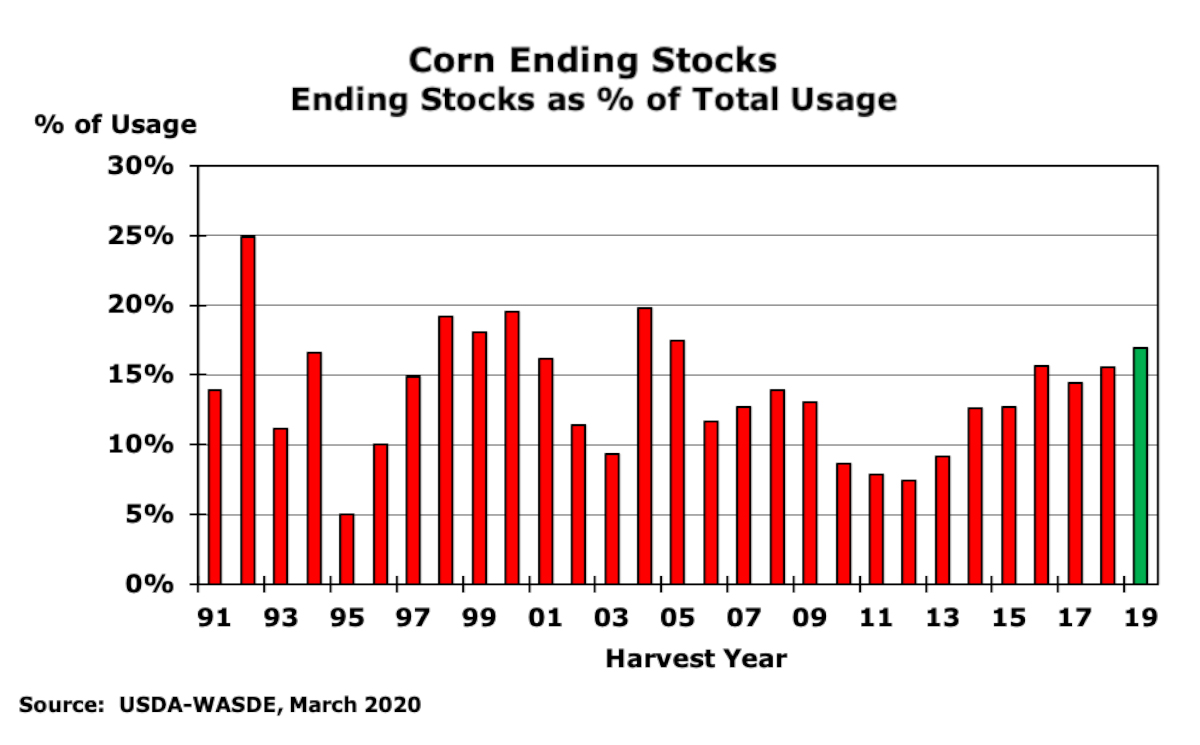
Figure 2. U.S. Corn Ending Stocks Expressed as a Percentage of Total U.S. Corn Usage, By Harvest Year, 1991-2019.
References
Irwin, S. and T. Hubbs. “The Coronavirus and Ethanol Demand Destruction.” farmdoc daily (10):56, Department of Agricultural and Consumer Economics, University of Illinois at Urbana-Champaign, March 26, 2020.
[1] To learn more about these scenarios see: Taheripour, F. and J. Mintert. “Impact of COVID-19 on the Biofuels Industry and Implications for Corn and Soybean Markets.” Department of Agricultural Economics, Purdue University, April 13, 2020.
![]()
![]()
![]()
![]()
![]()
