April 13, 2020
Impact of COVID-19 on the Biofuels Industry and Implications for Corn and Soybean Markets
by: Farzad Taheripour and James Mintert
![]()
![]()
![]()
![]()
![]()
1. Introduction
Since the appearance of COVID-19 in China in late 2019 and its rapid spread across the world, demand for crude oil has declined sharply due to reductions in economic activities, which has led to a large drop in crude oil prices. In addition, competition among major oil producers has further pushed down the price of crude oil. As shown in Figure 1, the price of crude oil fell from $61.14 in December 31, 2019 to $14.10 in March 30, 2020.
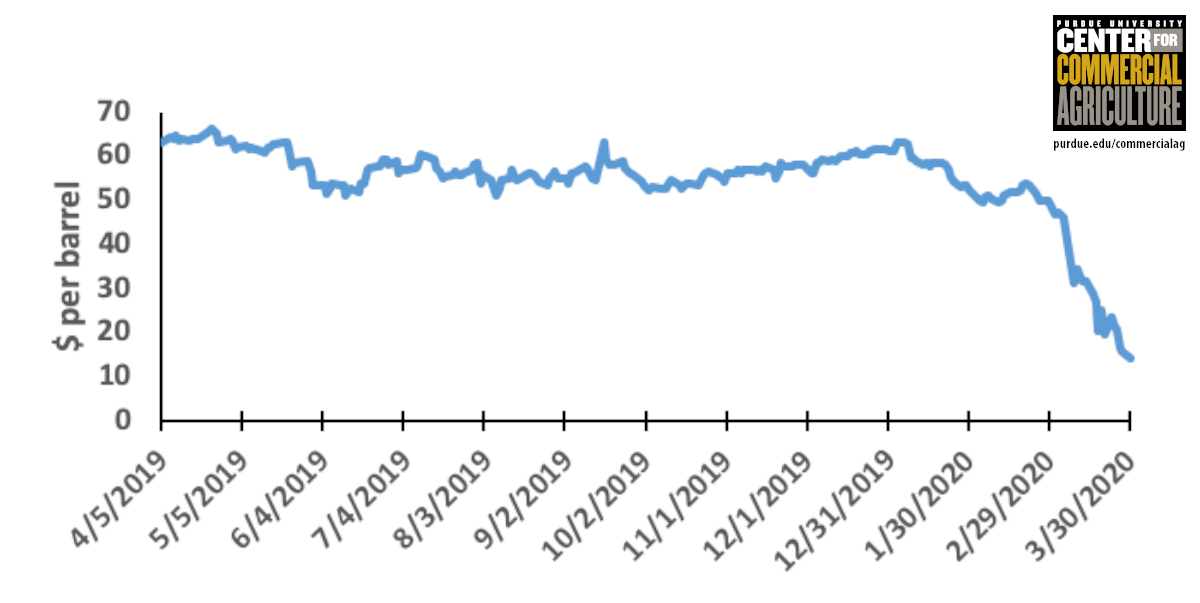
Figure1. Cushing Oklahoma Spot Price (FOB) of crude oil, Daily, April 5,2019-March 30, 2020.
The decline in oil prices resulted in prices for transportation fuels declining as well. For example, as shown in Figure 2, the average monthly rack price of unleaded gasoline fell from $1.82 per gallon in December 2019 to $1.14 in March 2020. At the same time, the average monthly rack price of ethanol declined from $1.32 per gallon in December 2019 to $0.82 in March 2020.

Figure 2. Omaha monthly average unleaded gasoline and ethanol average rack prices, January 2019-March 2020.
The sharp decline in the price of ethanol reduced ethanol producers’ profit margin. As shown in Figure 3, based on daily data from Iowa State University’s Center for Agricultural and Rural Development (CARD), the average return above variable costs for Iowa ethanol producers declined from about 35 cents per gallon in late November 2019 to -7 cents per gallon on March 27, 2020. The reduction in profitability per gallon of ethanol produced is not the only consequence of COVID-19 for ethanol producers. Reductions in economic activities resulting from social distancing and mandatory shelter in place rules have negatively affected the demand for gasoline and hence for ethanol, due to the 10% blend rule. Today, about 96% of the US population is living under some required restrictive measures to limit the spread of COVID-19. Therefore, due to the lack of profitability in ethanol production coupled with reduced demand for gasoline, ethanol producers are expected to either reduce their production levels or, in some cases, simply shut down their plants. Since a large portion of corn produced in the US (about 38%) is used to produce ethanol (and DDGS), the lack of demand for ethanol will cause a large decline in corn demand.

Figure 3. Estimated daily return above variable production costs for Iowa ethanol producers, September 9, 2019-March 27, 2020, Iowa State University, CARD.
Demand for distillate fuel oil (diesel fuels and fuel oils) has also followed a diminishing trend in recent months due to the reduction in economic activities caused by the spread of COVID-19. For example, according to the data provided by the EIA1, consumption of these fuels has declined by 11.3% in the first two months of 2020 compared to the first two months of 2019. The reduction in the price of crude oil and reduced demand for diesel fuel pushed down diesel fuel prices as well. For instance, the retail diesel price, which was about $3.05 per gallon in January 2020, declined to $2.56 per gallon in the last week of March 2020. This led to a major reduction in the price of biodiesel from about $1,050 per metric ton in early January 2020 to $735 per metric ton at the end of March 20202. Weaker demand for diesel could also reduce demand for biodiesel, which will lead to reductions in demand for biodiesel feedstocks. Among these feedstocks, soybean oil has the largest share in the US market. Hence, any major decline in demand for biodiesel would reduce demand for soybeans as well.
The above analyses suggest that the spread of COVID-19 will negatively affect demands for corn and soybeans due to declines in demands for ethanol and biodiesel. In what follows, we assess the magnitudes of these effects. Since the consequences of COVID-19 are very uncertain, three possible scenarios are assessed to cover a wide range of potential outcomes.
2. Impacts of COVID-19 on demand for ethanol and corn
The analysis begins with recent work by Irwin and Hibbs (2020)3. They estimated the impacts of COVID-19 on demand for corn due to expected declines in ethanol production for March, April, and May of 2020 with an expectation that economic activity will return to normal by June. However, in early April about 96% of the US population was still under a shelter in place order and the existing evidence suggests that the interruptions in economic activities are not likely to disappear by the end of May and could be extended beyond that, as can be inferred from Figure 4.
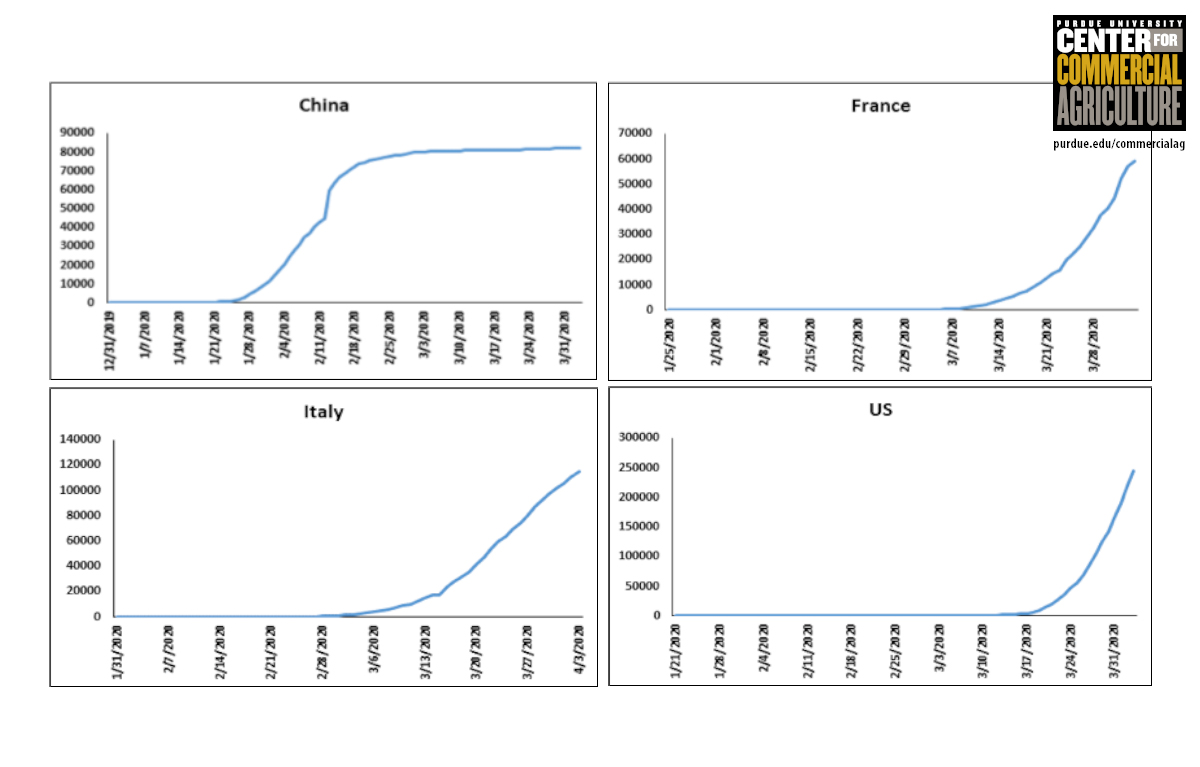
Figure 4. Number of officially reported COVID-19 cases for four countries with high spread rates including: China, France, Italy, and the US. Except for China, the origins of the horizontal axes represent the date of first observation. The origin for China represents the day that China officially announced the outbreak. The last observation is April 3rd, 2020 for all countries. Data source: https://ourworldindata.org/coronavirus
This figure represents the number of officially reported COVID-19 cases for China, France, Italy, and the US. Regardless of the differences in the socioeconomic determinants for these countries, this figure shows relatively similar timelines for the path of expansion in the number of COVID-19 cases. China officially reported about the outbreak of COVID-19 in December 31, 2019. However, early cases were actually detected in China in mid-November 2019. Hence, it took about four and a half months to stop the spread of COVID-19 in China. France and Italy reported their first cases in late January. After about two months, they reached the point where the number of cases grew exponentially and are still at the beginning of the climbing path. The US observed its first case a few days before France and Italy and is now climbing up the curve with a very steep slope and it may take multiple weeks to reach the top of its curve. Therefore, at this time it is reasonable to extrapolate that the shelter in place and other restrictive measures that limit communication and interrupt economic activities will stay in place at least through April and possibly several weeks beyond that. Even after the removal of these orders, it is very unlikely that economic activities will immediately revert to business as usual conditions. A report developed by the World Bank Group4 in collaboration with Purdue University’s GTAP Center indicates that the global economy will suffer harshly due to the spread of this virus. Hence, given the above analysis, it’s assumed that the shelter in place orders will remain in place fully across the US in April and they will be lifted gradually over time.
Irwin and Hubbs (2020) posit that shelter in place requirements will effectively reduce gasoline usage by 50% while shelter in place is in effect. Given that there is no solid information to clarify the accuracy of this assumption, a uniform distribution for the impact of shelter in place on gasoline demand is assumed with a mean of 50% and lower and upper bounds of 40% and 60%, respectively. Also, since 96% of the US population is currently under the shelter in place order, we assume that this order will be extended to all states. Based on these assumptions, the following three scenarios are considered for the possible impacts of COVID-19 on gasoline and ethanol consumption:
Scenario I: Low Impact with 40% reduction in demand in April;
Scenario II: Medium Impact with 50% reduction in demand in April;
Scenario III: High impact with 60% reduction in demand in April.
For each of these scenarios, it is assumed that the impact will diminish over time throughout the remainder of 2020. In each scenario, for May, June, and July the impacts are assumed to diminish by 10% per month. Therefore, the June reduction rates for the low, medium, and high scenarios are 10%, 20% and 30%, respectively. To take into account recession in economic activities beyond July, the reduction rates were linearly dropped to reach the reduction rates of about 5%, 7.5%, and 10% in December for the low, medium, and high impact scenarios. With these defined trends, the 2020 overall reduction rates in demand for gasoline for the low, medium, and high impacts scenarios are about 12%, 17%, and 23%. Figure 5 represents the monthly reduction rates for the defined scenarios. These hypothetical pathways reflect different potential outcomes that may occur in the real world and are all subject to major uncertainty. Note that Figure 1 also shows the percentage reductions in gasoline usage projected by Irwin and Hubbs for March, April, and May.

Figure 5. Projected impacts of COVID-19 on gasoline demand: Monthly reduction rates in demand for gasoline for the examined scenarios
Given the above projected monthly reduction rates in the demand for gasoline, and given the EIA projected demand for gasoline in 2020 (not considering the COVID-19 impacts), the monthly reductions in quantity demanded of gasoline are estimated. Then, assuming a blend rate of 10.1% (see Irwin and Hubbs (2020) for details), the reduction in demand for corn ethanol is projected and results are presented in Table 1. The estimated reduction in U.S. ethanol usage ranges from 1.7 to 3.3 billion gallons in 2020. To help put this in context, consider that quantity is the equivalent to about 11% to 21% of ethanol produced in the U.S. during 2019, representing a huge loss in demand for the ethanol industry.
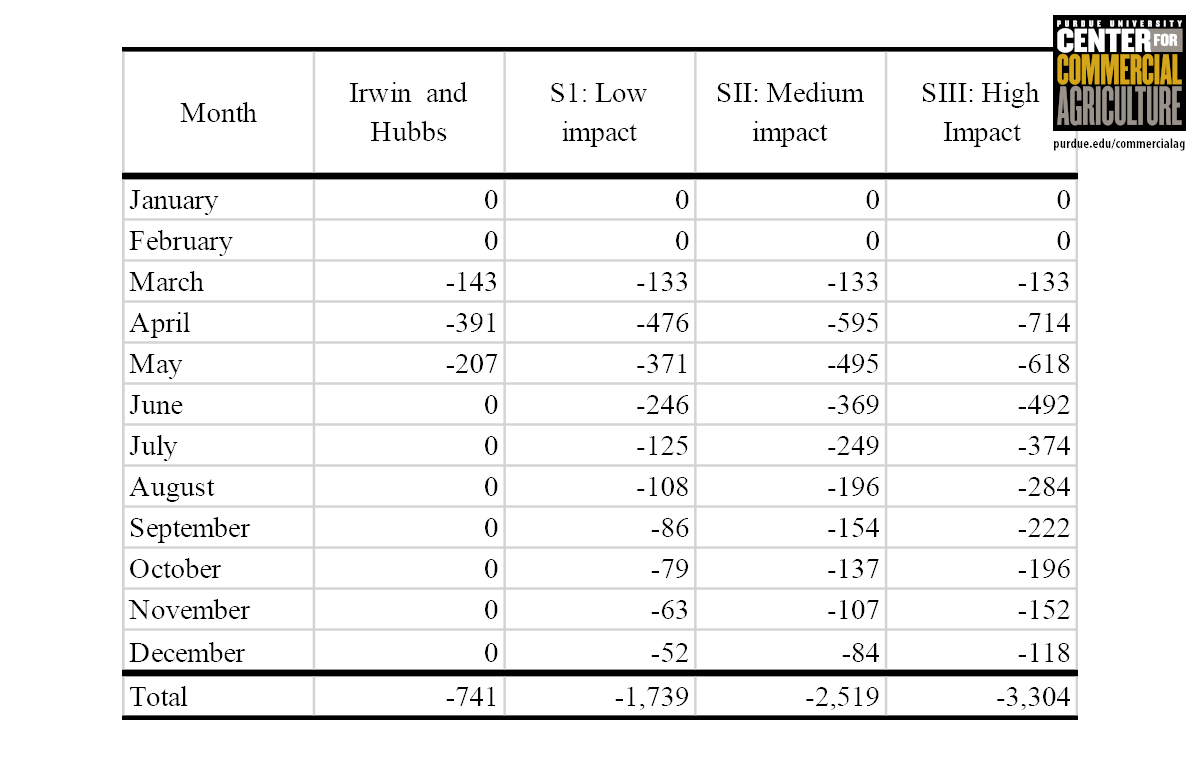
Table 1: Impacts of COVID-19 on demand for corn ethanol: Projected reductions for the examined scenarios (figures are in million gallons).
Assuming that about 2.9 bushel of corn is needed to produce one gallon of ethanol, the reduction in corn demand due to the reduction in ethanol demand is estimated. Since reduction in ethanol production leads to reduction in DDGS supply, assuming that the livestock producers will substitute DDGS with corn, we calculated the net reduction in corn demand. For this calculation, we considered 5.7 pounds of DDGS per gallon of ethanol. The monthly results are presented in Table 2 and the overall results for 2020 is shown in Figure 6. These results show that the gross demand by the ethanol industry for corn could go decline by 600 million bushels to as much as 1,139 million bushels. However, if livestock producers substitute corn in their rations in place of DDGS, to account for reduced availability of DDGS, then the net demand for corn would decline by 423 to 803 million bushels. These large demand reductions are expected to push estimated corn ending stocks up dramatically and have a very negative impact on corn prices received by U.S. producers.

Table 2. Impacts of COVID-19 on demand for corn induced by reduction in demand for corn ethanol: Projected reductions for the examined scenarios (figures are in million bushels).
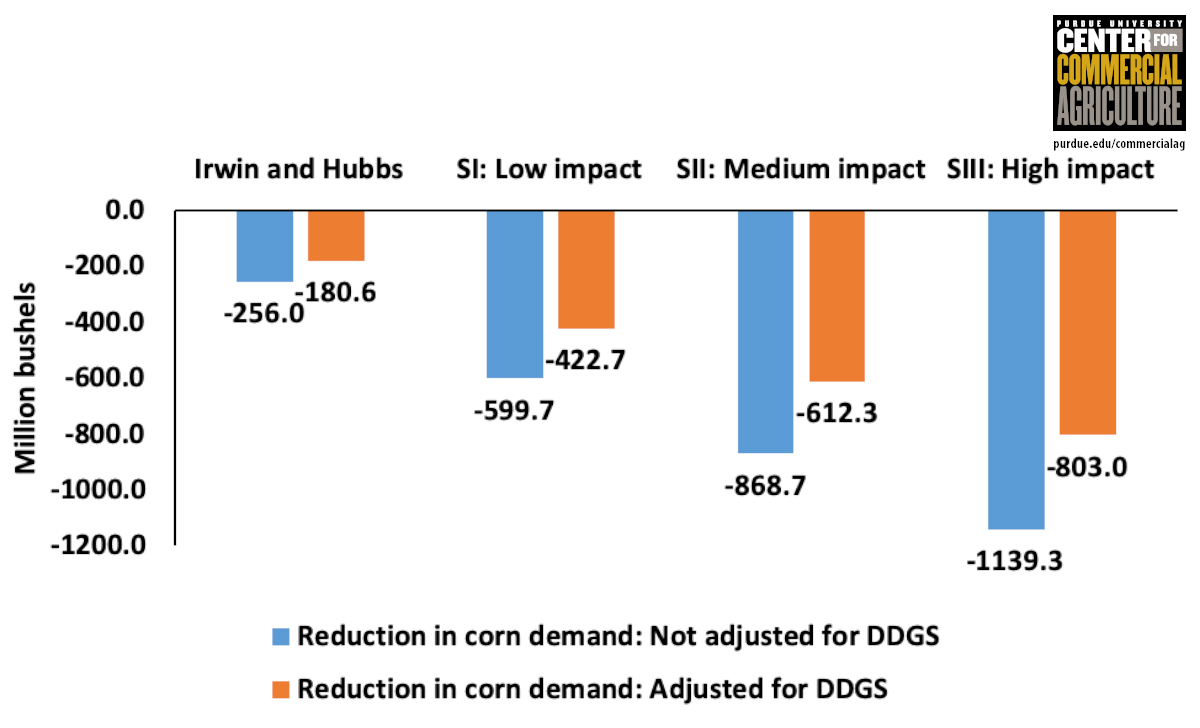
Figure 6. Projected impacts of COVID-19 on demand for corn due to reduction in supply of ethanol in 2020 for the examined scenarios.
3. Impacts of COVID-19 on demands for biodiesel and soybeans
The impact of COVID-19 on demand for biodiesel, soy biodiesel, and soybeans would likely be smaller than its impact on gasoline, ethanol, and corn demand for several reasons. First, consumption of diesel fuel may decline less than the consumption of gasoline due to the reduction in demand for transportation. Diesel fuel is mainly used in heavy duty trucks, agricultural machinery, construction equipment, and other industrial activities. Hence, while its demand is expected to drop due to reductions in economic activities, the shelter in place restrictions may not reduce diesel demand as much as expected for gasoline. Second, the share of biodiesel in diesel fuel consumption is not large (2.9% in 2019 according to the EIA report5), and finally, only 51% of biodiesel is produced from soy oil feedstock in 20196. In the absence of other evidence, the rate of reduction in demand for diesel due to COVID-19 in each month is assumed to be half of the rate of reduction in gasoline, as projected in Figure 5. Then, given the share of biodiesel in diesel consumption, the reduction in the quantity demanded of biodiesel is estimated. Finally, according to the share of soy oil in biodiesel feedstocks, Table 3 provides estimated reductions in soy biodiesel by month through the end of 2020.
These results indicate that demand for biodiesel could go decline by 122 to 219 million gallons in 2020, due to the spread of the COVID-19. To put this in context, this is the equivalent to about 7% to as much as 13% of 2019 U.S. biodiesel production. These are major reductions for the biodiesel industry. The corresponding estimated reductions in soy biodiesel range from 62 to 111 million gallons.
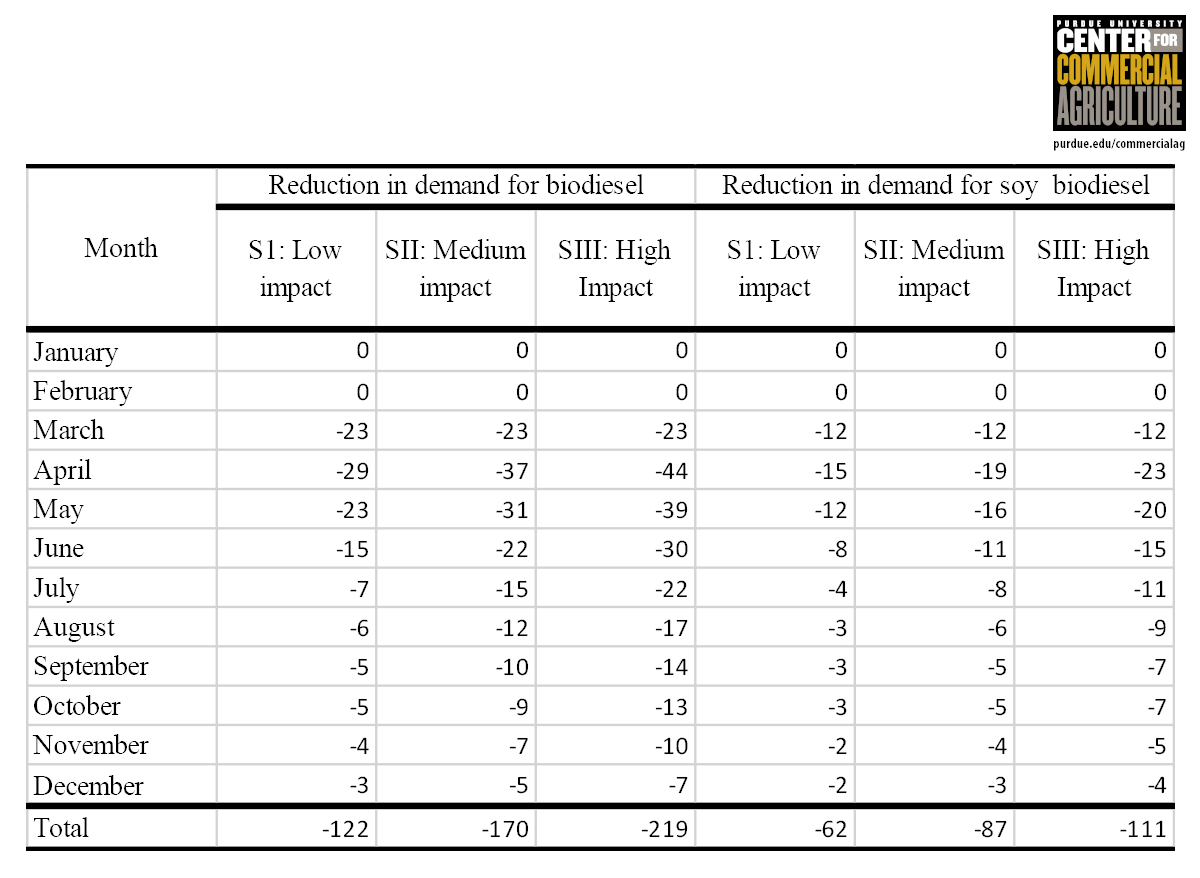
Table 3: Impacts of COVID-19 on demand for biodiesel and soy biodiesel: Projected reductions for the examined scenarios (figures are in million gallons).

Table 4. Impacts of COVID-19 on demand for soybeans induced by reduction in demand for soy biodiesel: Projected reductions for the examined scenarios (figures are in million bushels)
Finally, assuming 7.68 pounds of soy oil are used per gallon of soy biodiesel, and a 20% crushing rate, Table 4 provides the estimated reduction in quantity demanded of soybeans for each month through the end of 2020. These results indicated that soybean usage could decline by approximately 40 to 71 million bushels in 2020, due to the spread of the COVID-19. This is about 1% to 1.6% of 2019 US soybean production. Therefore, the implications COVID-19 on soybean demand arising from reduced biodiesel usage could be significant, but are expected to be much smaller than the impact on corn demand arising from reduced gasoline usage.
4. Conclusion
This report shows that the spread of COVID-19 in the U.S. is expected to reduce the demand for both corn and soybeans due to reductions in demand for ethanol and soy biodiesel. The likely reduction in demand for corn is quite large and will boost corn ending stocks substantially, leading to a significant reduction in the 2019 and 2020 marketing year average prices for U.S. corn. The expected reduction in soybean demand is significant, but it is much smaller than for corn and will lead to a much smaller impact on soybean ending stocks and marketing year average prices received by U.S. producers than for corn.
[1] See March 2020 Monthly Energy Review at: https://www.eia.gov/totalenergy/data/monthly/pdf/mer.pdf
[2] For biodiesel historical prices see: https://www.neste.com/corporate-info/investors/market-data/biodiesel-prices-sme-fame
[3] Irwin, S. and T. Hubbs. “The Coronavirus and Ethanol Demand Destruction.” farmdoc daily (10):56, Department of Agricultural and Consumer Economics, University of Illinois at Urbana-Champaign, March 26, 2020.
[4] Available at: https://www.worldbank.org/en/region/eap/publication/east-asia-pacific-economic-update.
[5] The total supply of distillate fuel oil (including renewable diesel and biodiesel) was about 62 billion gallons in 2019. In this year total production of biodiesel was about 1.8 billion gallon. For detail see March 2020 Monthly Energy Review at: https://www.eia.gov/totalenergy/data/monthly/pdf/mer.pdf.
[6] The 51% share for soy biodiesel is obtained based in the EIA for biodiesel feedstock report. This report is available at: https://www.eia.gov/biofuels/biodiesel/production/. Note that this share could change due to the expected change in feedstock availability in 2020. However, it is not clear in what direction it may change. Therefore, in this report we assume it will remain the same as 2019.
Related article: Taheripour, F. and J. Mintert. “COVID-19 Weakens Ethanol Demand Leading to Reduction in Corn Usage Forecast.” Department of Agricultural Economics, Purdue University, April 13, 2020.
![]()
![]()
![]()
![]()
![]()
TAGS:
TEAM LINKS:


RELATED RESOURCES
UPCOMING EVENTS
We are taking a short break, but please plan to join us at one of our future programs that is a little farther in the future.