
Data Usage in the Agricultural Value Chain
October 7, 2020
PAER-2020-15
Author: Brady Brewer, Assistant Professor
![]()
![]()
![]()
![]()
![]()
Firms at various levels of the agricultural value chain face a consistently high level of competition. At every level of the value chain, participants compete for strategic advantages that will lead to an increase in market share or lower costs. With advances in technology, customer segmentation practices, and a changing consumer base, it is not surprising that many firms are increasingly turning to data analytics to provide strategic advantage over their competitors. Data have the potential to provide insights into both demand and supply issues, helping companies better target new customers or cutting costs of production along the way. Data analytics, under all its various uses, is driven by the goal of improving a business’ bottom line.
To this end, the Purdue University Center for Food and Agricultural Business (CAB) conducted a survey project on data usage and analytics along the food and agricultural value chain from the farmer to the food retailer. The purpose of this research was to examine the degree to which these businesses gathered, analyzed and shared data.
The survey was conducted during the summer of 2019 with 1,500 responses from all levels of the value chain, across a wide array of employees. The resulting survey is highly representative of the overall food sector. While other research has focused on one particular sector within the value chain, this research is the first comprehensive look at the entire data environment from farmer to consumer. The following were the levels of the value chain survey participants were classified as: 1) Farmer, 2) Agricultural Input Manufacturer, 3) Agricultural Retailer, 4) Processor/Trader/First Handler, 5) Food Manufacturer, and 6) Food Retailer. For this article, we exclude farmers and focus on the insights provided for the other segments of the value chain.
Figure 1 shows the results for overall data collection within the agricultural value chain. Ninety-two percent of the sample indicated that the agribusiness they work for collects data, with 43% indicating their firm collects an extensive amount of data and 49% indicating their firm collects some data. Figure 1 demonstrates the importance of data and data analytics across the value chain.
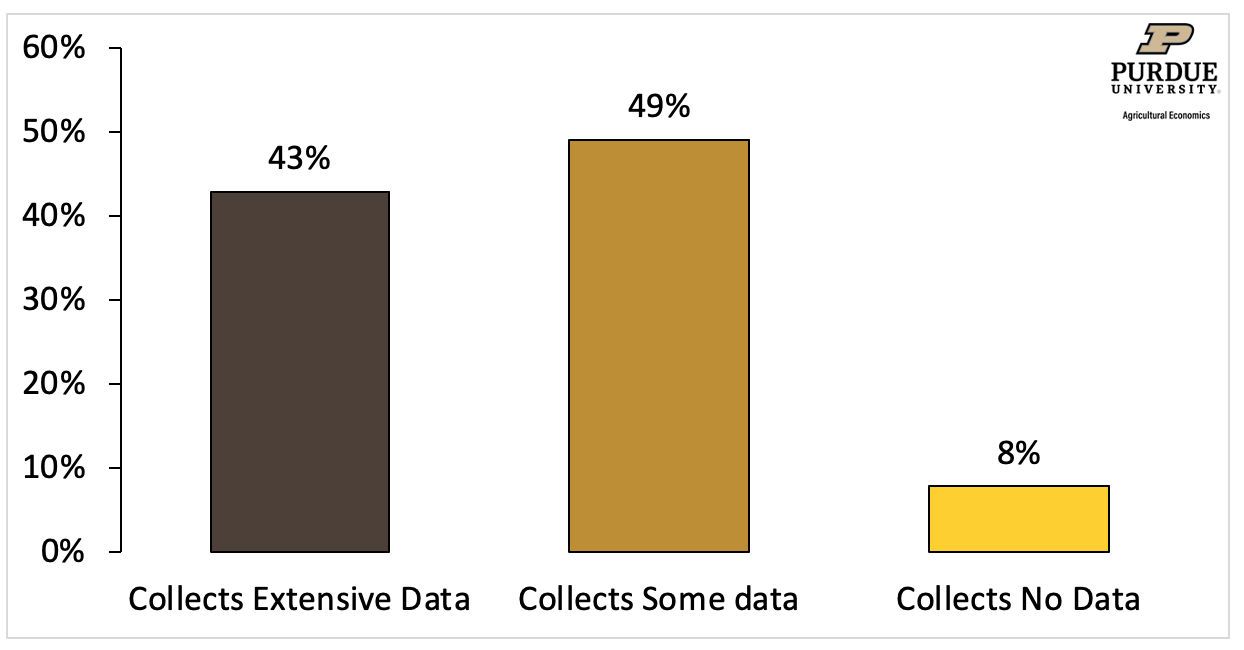
Figure 1. Data Collection Among the Agricultural Value Chain
Our study found that the amount of data collected by businesses varies across the value chain. Figure 2 provides a breakdown of the level of data collected by firms at various stages along the value chain. Agricultural input manufactures (e.g., equipment manufacturers, chemical manufacturers, feed and nutrition manufacturers) collect the most data with only 3% of respondents indicating that their company does not collect data. Food retailers, on the other hand, were found to collect the least amount of data in the agricultural value chain.
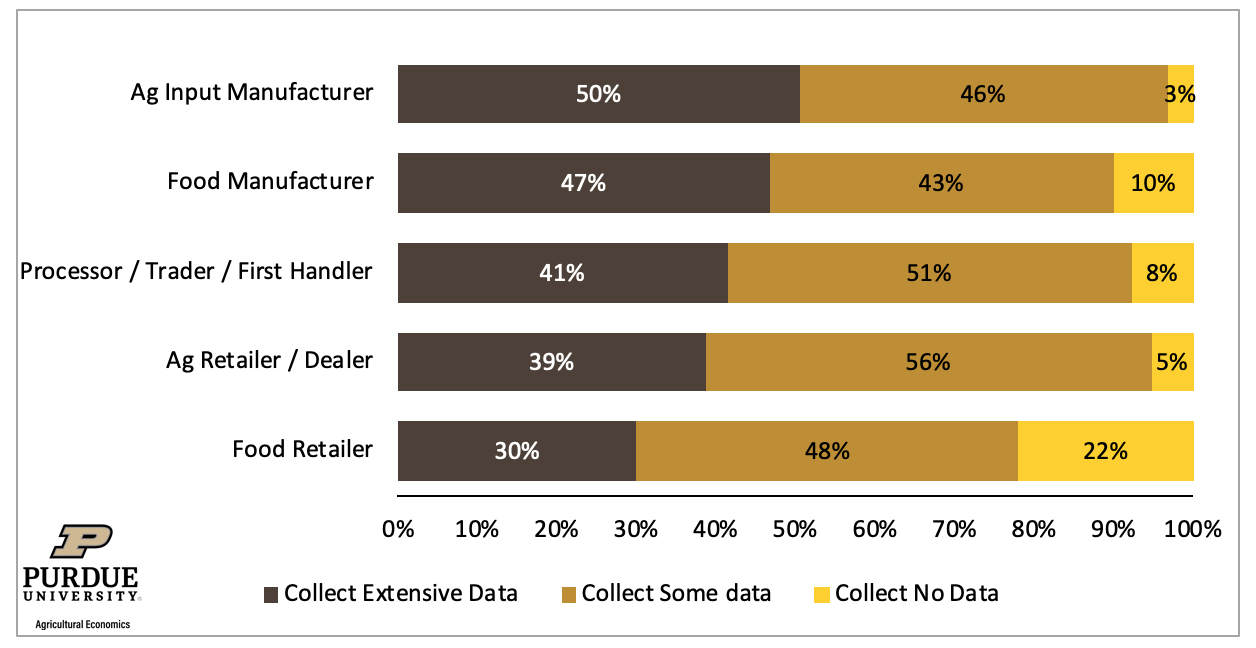
Figure 2. Data Collection by Level of the Value Chain
Collecting data, however, is only the first step. The goal for these companies is to turn this data into actionable insights. The survey next asked respondents the percent of all decisions made at their organization that were based on data analytics. The results to this question are shown in Figure 3. Results show that 15% of agribusiness use data analytics in over three-quarters of their decisions. Thirty-six percent of agribusinesses base half to three-quarters of their decisions on data analytics, and 33% of agribusinesses base one-quarter to half of their decisions on data analytics. This shows that a small number of firms use the data they collect on almost all decisions made, with most agribusinesses using the data to aid in making somewhere between 25% to 75% of their decisions.
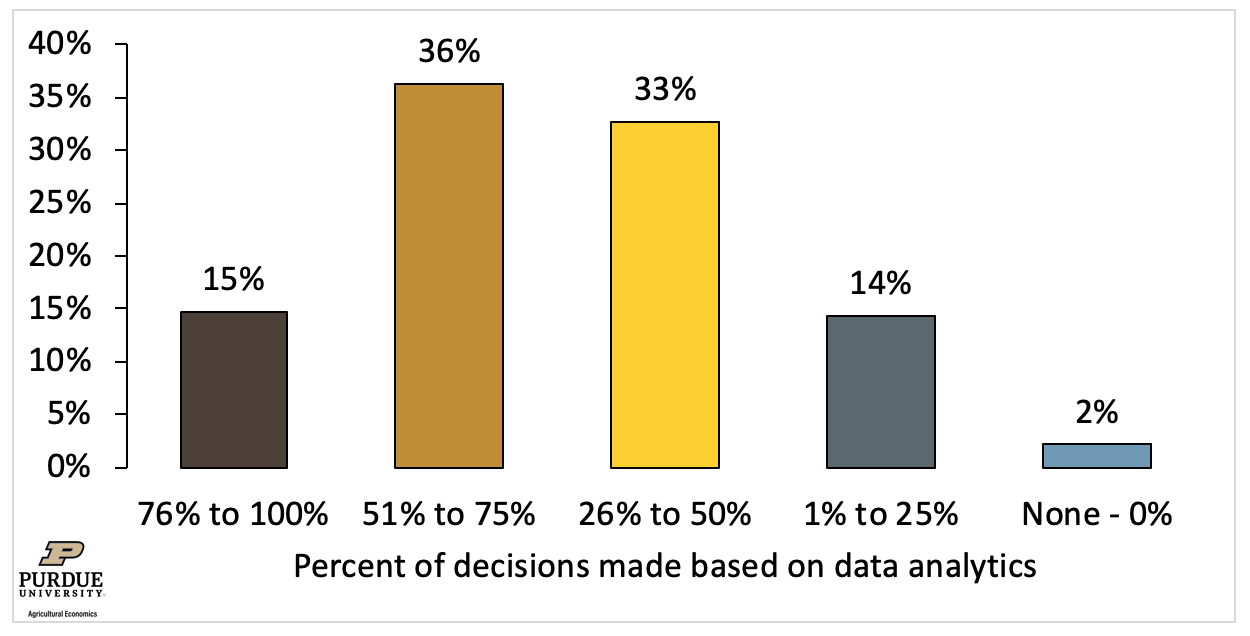
Figure 3. Overall Decisions Made based on Data Analytics
The value of collecting data is driven by data analytics, or business’ ability to effectively study the data to aid in decision making. Figure 4 further examines the usage of data analytics by separating data analytics usage by how extensively agribusinesses collect data. What is revealed is that agribusinesses that more extensively collect data make more decisions by drawing on the insights provided through data analytics. Of the firms that indicated they base more than three-quarters of their decisions off of data analytics, 82% also indicated that they collect extensive data, yet only 18% indicated they collect some data. Firms that base fewer decisions off of data analytics tend to indicate they collect less data.
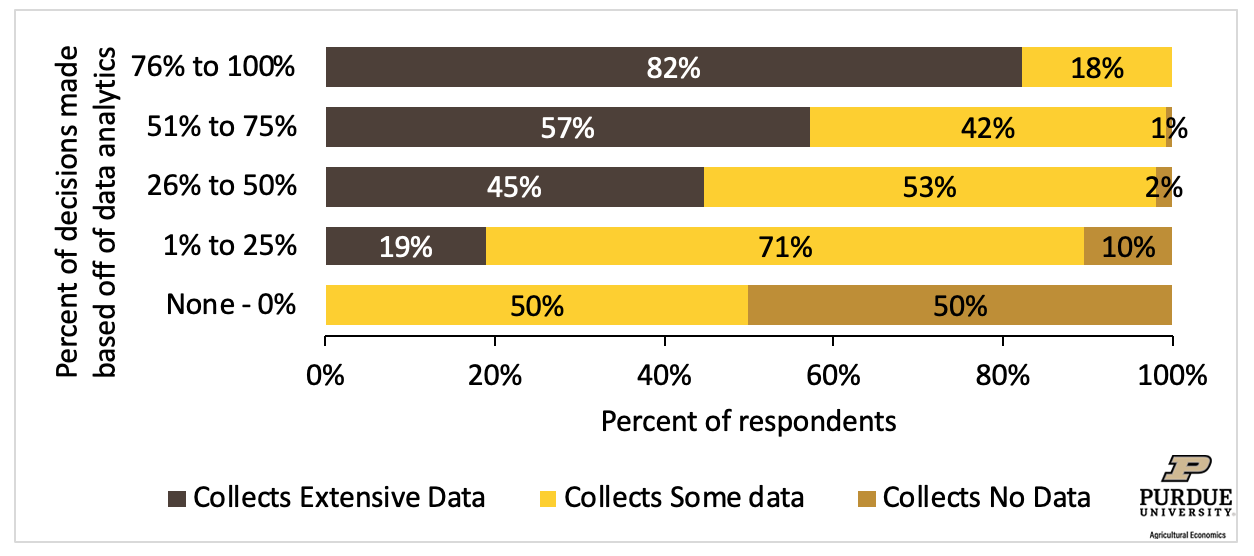
Figure 4. Percent of Decisions Made Using Data Analytics by the Extent Data is Collected
The survey also asked companies to grade themselves on the use of this data and data analytics. Only 30 percent said that their organization was using data and data analytics to their full advantage. About half of the respondents said their firm is at par or behind the competition. Respondents attribute this deficiency to challenges associated with collecting data in a usable form in a timely manner. Timely data collection and analysis is the biggest challenge to fully capitalize on the potential offered by data. In other words, decisions must be made faster than a company can collect and analyze data.
Many leaders across the food and agricultural value chain argue that how data is used and what insights it generates is going to be of vital understanding in the future. Through modern technology, huge swathes of data are being generated from everyone along the value chain, from farmers to consumers, and firms along the value chain attempt to collect and capture the potential value created by this large volume of data. This research shows that most agricultural business are collecting data in some form, but many feel they are not yet able to fully use data to provide actional insights.
![]()
![]()
![]()
![]()
![]()
