Firm Financial Health of Publicly Traded Agribusinesses
May 15, 2024
PAER-2024-16
Binayak Kunwar, Graduate Research Assistant
![]()
![]()
![]()
![]()
![]()
Introduction
The agricultural sector, along with food and related industries, constitutes a vital component of the US economy. In 2022, these sectors collectively contributed approximately $1.420 trillion to the U.S. GDP, representing a noteworthy 5.5 percent share (USDA ERS). However, there is very little study on the historical financial performance of agribusiness companies.
Publicly traded agribusinesses are those agribusinesses companies whose shares are available for purchase on open markets like stock exchanges or other trading platforms (Katchova & Enlow, 2013). This report evaluates the financial performance and position of publicly traded agribusiness companies from 1981 to 2022. Our analysis incorporates four different types of financial ratios to evaluate profitability, liquidity, solvency, and efficiency with a total of 7 specific financial indicators. We rely on the Compustat North America dataset to examine the financial health of publicly traded agribusinesses.
Compustat dataset
The data for this study is obtained from Compustat North America Data, accessed through Wharton Research Data Service at the University of Pennsylvania. This dataset is structured based on Global Company Key (GVKEY) and Standard Industrial Classification (SIC).
For this analysis, we focus specifically on agribusiness companies with SIC code 20 engaged in the production of food and kindred products. There is a total of 29,682 quarterly financial observations for agribusiness companies from 1981 to 2022, which are utilized in this report.
Methodology
We specifically observe the profitability, liquidity, solvency, and efficiency ratios to examine the financial health of agribusiness companies. The profitability ratio evaluates the amount of profit agribusinesses generate at different stages of an income statement. We examine profitability based on return on equity (ROE), return on assets (ROA), and profit margin ratio. ROE and ROA examine profitability relative to equity and assets and evaluate how efficiently equity and assets are utilized by the agribusinesses. Similarly, the profit margin ratio indicates the proportion of profit earned by a company with its total revenue.
Liquidity ratios measure a company’s ability to meet its short-term obligations with its liquid assets. It is a financial metric that assesses the company’s ability to cover its short-term liabilities. We use the current ratio and quick ratio to measure liquidity. The current ratio is calculated by dividing a company’s current assets by its current liabilities. A current ratio greater than 1 is generally considered a positive sign, as it indicates that the company is in a relatively good financial position to meet its short-term obligations. Unlike the current ratio, the quick ratio excludes inventory from current assets to measure liquidity. The quick ratio provides a more conservative measure of a company’s liquidity compared to the current ratio because it focuses on assets that can be quickly converted to cash.
The solvency ratio measures the ability of the company to meet its long-term liabilities. In our study, we use the debt-to-asset ratio as a measure of solvency. The debt-to-asset ratio measures the proportion of a company’s total assets that are financed by debt. This ratio provides insights into the financial risk of a company. A higher debt-to-asset ratio suggests a higher degree of financial risk, as a larger portion of the company’s assets is financed by debt.
Asset turnover provides insight into the efficiency of agribusinesses by measuring how effectively agribusiness companies generate sales for each dollar of assets employed in their operations. An agribusiness with an asset turnover of less than 20% raises concerns, while those with 40% or higher asset turnover are considered to have a strong financial position.
Table 1 provides the financial indicators and formulas used to calculate the financial metric for this study.
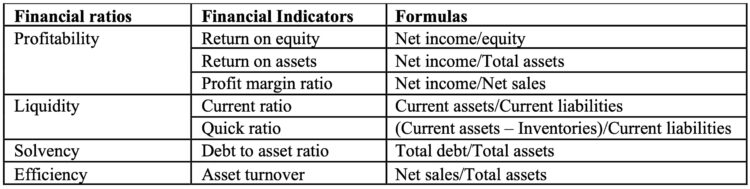
Table 1. Financial ratios definition
Results and findings
Table 2 reports the median financial ratios for publicly traded agribusiness companies using Compustat quarterly fundamental data of North America for 2016-2022. In our analysis, we opt for the median instead of the mean, considering the possibility of outliers and skewness in financial data. Figure 1 illustrates the long-term trend of financial ratios from 1981 to 2022.
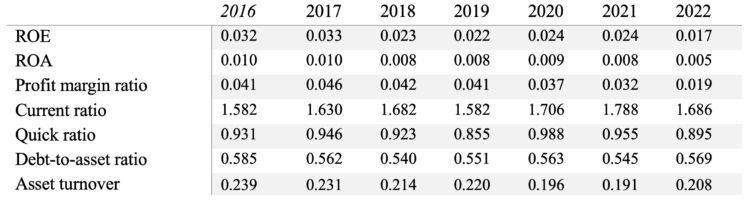
Table 2. Financial ratio of agribusinesses by year
The median ROE for agribusinesses fluctuated between 1.7% to 3.3% from 2016 to 2022. Adjusting for financial leverage, we expect the ROA to be lower than the ROE. As anticipated, ROA ranges between 0.5% to 1% during this period. Both ROE and ROA show a decline in 2022 compared to the previous six years. A similar pattern is observed in the profit margin ratio, which ranges from 1.9% to 4.6%. In 2022, the profit margin ratio for agribusinesses was 1.9%. Figure 1 depicts that the profitability measures are at their lowest point in the past forty years. This decline in profitability measures is due to the decline in net income.
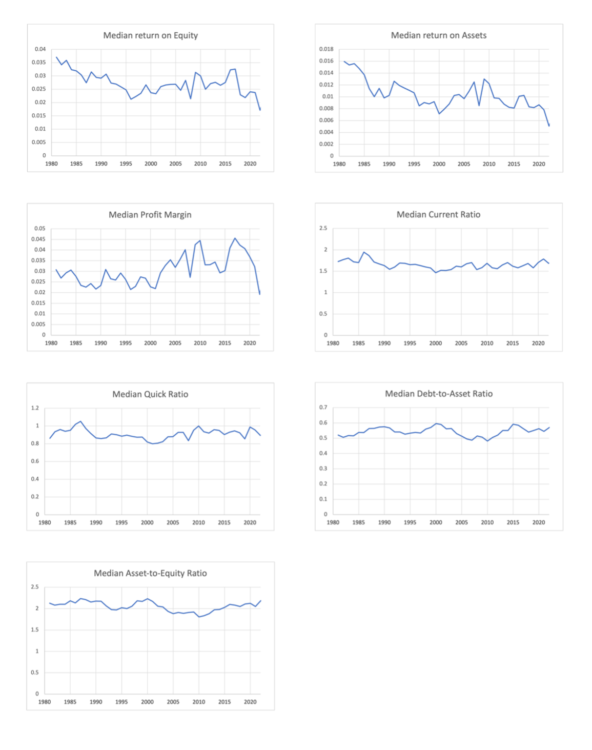
Figure 1. Agribusinesses’ financial ratios for years 1981-2022
Between 2016 and 2022, agribusinesses exhibit a median current ratio between 1.582 to 1.788. With a current ratio value greater than 1, it signifies that agribusinesses have good financial health to meet their short-term obligations. The quick ratio fluctuates between 0.855 and 0.988 during this period. The increase in the quick ratio in 2020 suggests improved liquidity in the pandemic year, possibly due to the effective management of liquid assets.
In terms of solvency, agribusinesses exhibit a median debt-to-asset ratio fluctuating between 54% and 56% from 2016 to 2022. In financial analysis, a debt-to-asset ratio below 30% is generally considered strong, while a ratio surpassing 60% raises concerns. Based on these metrics, agribusinesses fall within the category of moderately risky enterprises. Similarly, the median asset turnover ratio ranges between 19% to 23% during this period. The median asset turnover ratio was 20.8% in 2022. With an asset turnover slightly higher than 20%, agribusinesses can be considered to have a marginal efficiency ratio.
Conclusion
This report discusses multiple financial ratios of agribusinesses, focusing on four major indicators of financial performance: Profitability, Liquidity, Solvency, and Efficiency. Profit margin has been uneven for the last ten years, reaching a peak of 4.6% in 2017 and subsequently declining to 1.9% in 2022 post the pandemic. We find that agribusiness companies are relatively stable in terms of liquidity, with a current ratio exceeding 1. Similarly, the quick ratio varies from 0.855 to 0.988 from 2016 to 2022. Furthermore, the solvency indicator (measured by debt-to-asset ratio) suggests a moderate level of risk for agribusinesses. The asset turnover ratio, slightly surpassing 20%, indicates that agribusinesses might need to find ways to increase efficiency. While the overall financial health of agribusinesses is generally satisfactory, the report recommends agribusiness operators should cautiously engage in risk management strategies.
References
Compustat. Fundamentals Quarterly. (2023). Wharton Research Data Services. https://wrds-web.wharton.upenn.edu/wrds/
Katchova, A. L., & Enlow, S. J. (2013). Financial performance of publicly-traded agribusinesses. Agricultural Finance Review, 73(1), 58–73. https://doi.org/10.1108/0002146131132131
USDA ERS – Ag and Food Sectors and the Economy. (n.d.). Retrieved April 2, 2024, from https://www.ers.usda.gov/data-products/ag-and-food-statistics-charting-the-essentials/ag-and-food-sectors-and-the-economy/
![]()
![]()
![]()
![]()
![]()