Fixing Crop Insurance: Farmer Responses and Policy Implications
June 16, 1991
PAER-1991-6
Authors: Monte L. Vandeveer, Extension Agricultural Economist, Kansas State University; and Edna T. Loehman, Associate Professor
![]()
![]()
![]()
![]()
![]()
*Funding for this work was provided by the S.S. Huebner Foundation, Wharton School, University of Pennsylvania.
The Federal Crop Insurance Act of 1980 designated federal multiple peril crop insurance (MPCI) to be the primary disaster assistance program aiding farmers in the event of crop failures due to natural causes. Disaster payments were to be replaced by insurance in order to make disaster relief less dependent on political forces and to improve efficiency of resource use by “privatizing” risk management. However, except in 1989, when 51 % or 30 million acres were insured due to requirements linking insurance with disaster payments received in 1988, participation by farmers in federal crop insurance has not met target levels of at least 50% participation needed to replace disaster payments.
Federal disaster programs were the subject of extensive debate for the 1990 Farm Bill because of the high federal budget cost for the combination of disaster payments and insurance subsidies. USDA’ s Office of Budget and Program Analysis shows that disaster payments cost about $8.8 billion from 1980 to 1990, and crop insurance subsidies also cost about $5.7 billion over this same period (see Fig. 1). American Association of Crop Insurers’ (AACI) data showed that, from 1981 to 1990, farmers received indemnity payments totaling $6.9 billion while they paid only $3.65 billion in premiums. In addition to direct premium subsidies of about 30% or $1.1 billion for this period, insurance subsidies also include the difference between indemnity payments and premiums and the cost for the Federal Crop Insurance Corporation (FCIC) to administer the program of $1.33 billion.
A ratio of indemnity payment to premium (called the “loss ratio”) greater than one typifies problems of achieving actuarial soundness in insurance associated with problems known as “moral hazard” and “adverse selection.” The loss ratio for MPCI for the 1981-1990 period, including the federal subsidies, was 1.46, meaning that $1.46 in indemnities was paid out for every $1.00 of premium. Excluding government premium subsidies from the loss ratio, farmers with insurance were paid $1.89 for every dollar of premium paid. (In comparison, loss ratios for private insurance are typically about 0.8.)
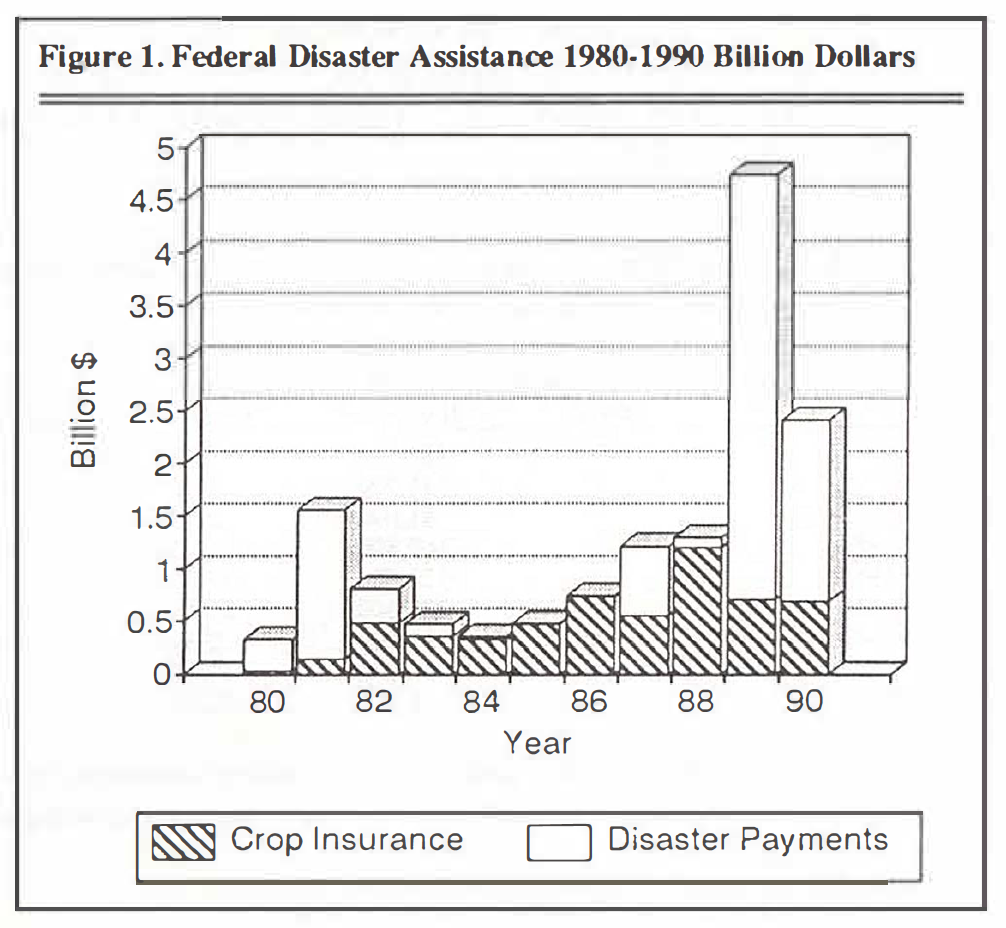
Figure 1. Federal Disaster Assistance 1980-1990 Billion Dollars
The federal government is the reinsurer for crop insurance in order to reduce the risk to private insurance companies which sell and administer 90% of the insurance contracts. Because of reinsurance, problems of actuarial soundness associated with moral hazard and adverse selection are passed on to the federal government.
During deliberations for the 1990 Farm Bill, there was much discussion regarding possible elimination of the current federal crop insurance program mainly because of the duplication of disaster payments and insurance indemnities. The Bush Administration’s Farm Bill proposal advocated replacing insurance with disaster payments which would be automatically triggered if a county’s yield losses exceeded a predetermined level {below 65% of average county yield). However, the final version of the Farm Bill approved continued funding for crop insurance, and in spite of a 25% cut in the five-year agricultural budget, crop insurance was not cut al all for 1991. The American Association for Crop Insurers attributes this to the strong grass roots support for the program expressed to elected officials. Future funding is still uncertain.
The Farm Bill did authorize certain reforms in crop insurance. It included efforts to increase participation, by allowing yield coverage to be based on ASCS yields and authorized some new types of contracts to be offered by private companies. It also included efforts to promote “actuarial sufficiency”. The bill called for increases in premium rates up to 20%, improvements in recordkeeping procedures, and increases in civil penalties in cases of program abuse. But AACI has raised concerns that premium increases may price coverage out of reach of many producers, thus defeating program goals to expand participation.
New Approaches Are Needed
Because the crop insurance program essentially has been maintained in its original form in the 1990 Farm Bill, it can be argued that further changes are necessary to make significant improvements in participation and actuarial sufficiency. This article proposes some additional changes that could be made in insurance contract design and ratemaking. Specifically, our proposals are:
- base premium rates on a producer classification system considering both yield variability and average yield
- offer insurance contracts with higher yield coverage for “better” producers
- introduce coinsurance in the form of reduced price guarantees for higher yield coverage
- develop improved methods of calculating fair premiums
To increase participation and reduce moral hazard and adverse selection, these proposals to improve crop insurance are based on insurance contract design principles.
That implementing the above proposals could improve the crop insurance program is demonstrated by results for a study for Tippecanoe County, Indiana carried out at Purdue University. Tippecanoe was used as the study site because growing conditions are typical of central Indiana com production. Com was the crop studied because of its importance in this region.
In Tippecanoe County, as in other areas of the Midwest, participation in crop insurance has been low -about 3-5% prior to 1984 rising to 37% in 1989 when participation was required for those receiving disaster payments in 1988. Table 1 presents characteristics of production in Tippecanoe County and loss ratios for com for Tippecanoe and Indiana for 1981-89. Over this period Tippecanoe had a higher loss ratio than the state ratio (an average of 1.21 compared to the state average of 1.02). Thus, if improvements in participation, subsidy cost, and actuarial sufficiency can be made in Tippecanoe, such improvements could also be anticipated for other similar areas in the Midwest.
Insurance Design Principles
In general, an insurance contract may include the following features: the premium, which is the price for purchasing the contract; coinsurance, which makes the insuree pay a share of loss to give incentives for reducing moral hazard; and a deductible, which defines a maximum loss level. Our proposals pertain to a more complete application of insurance design principles to reduce moral hazard and adverse selection.
Demand for Insurance and Adverse Selection. Low MPCI participation may indicate that farmers believe benefits from current crop insurance contracts are not worth their premium cost. Nelson (1990) found that the premiums computed by Federal Crop Insurance Corporation (FCIC) procedures overstate the yield risk for Com Belt farmers with relatively low yield variability. Barnaby et al. also found that farmers were dissatisfied with yield guarantees. Demand for crop insurance could be increased both by improving rate-setting procedures to better reflect the risks faced by farmers and by improving contract guarantees.
Insurance literature suggests that charging a fair premium – plus a loading fee for administrative purposes – would lead lo the greatest level of benefit for the insuree consistent with actuarial soundness of insurance. The fair premium is the rate which allows the insurance company to break even over time, with losses in some years offset by years with gains.
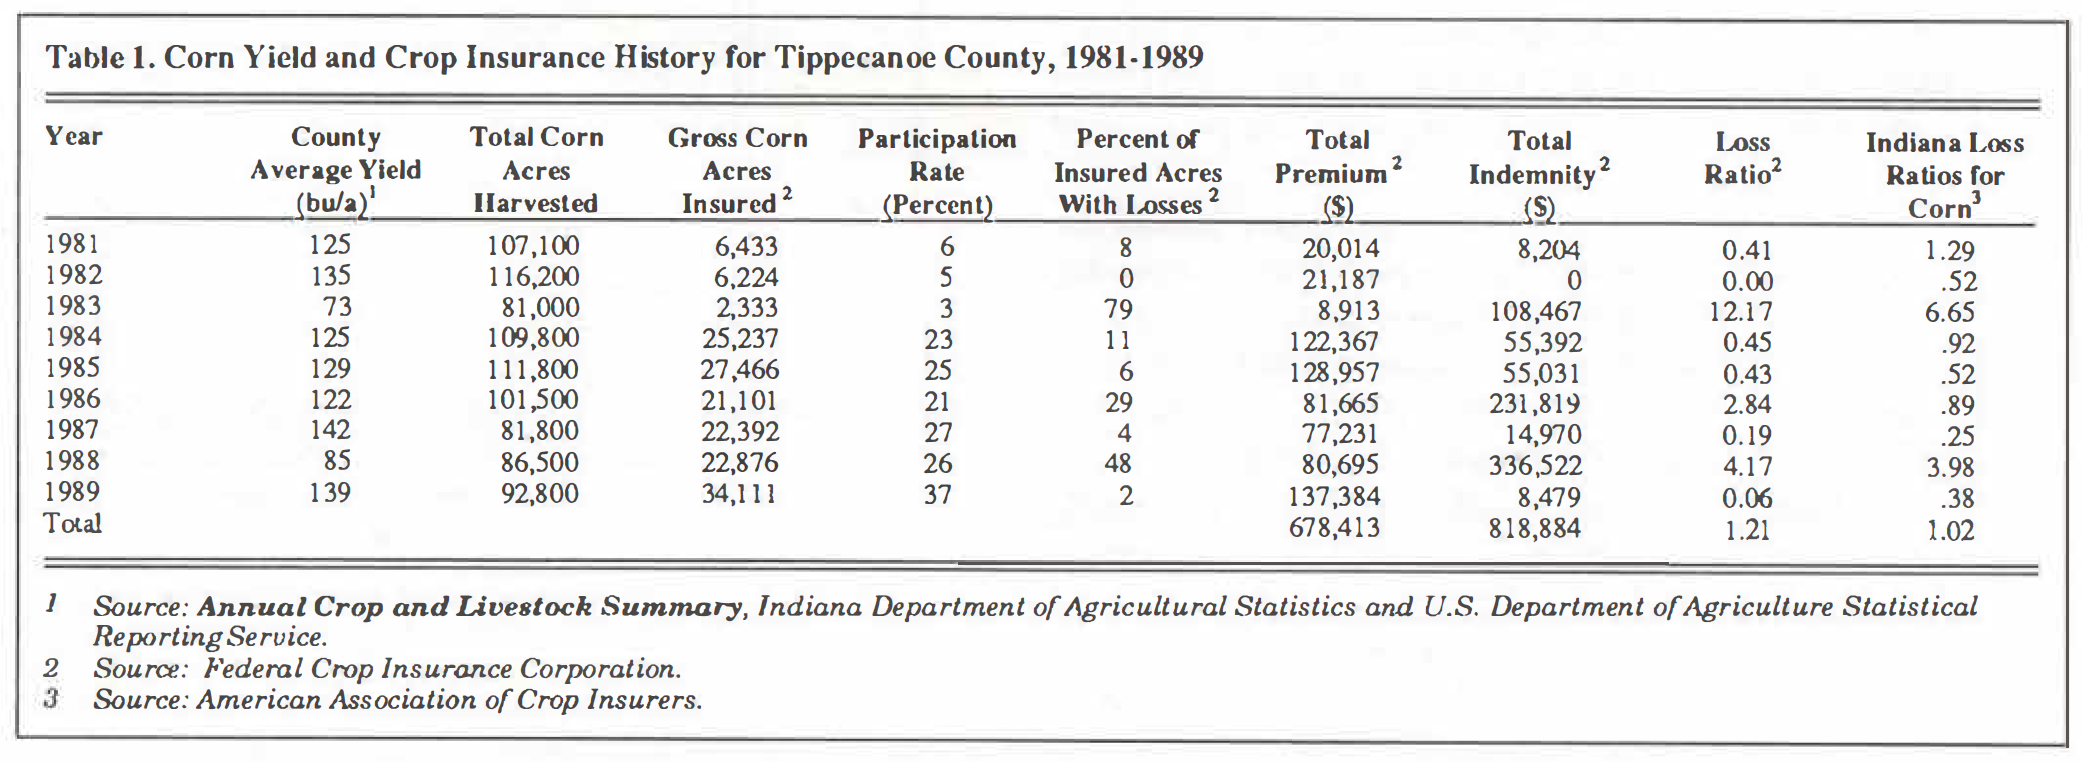
Table 1. Corn Yield and Crop Insurance History for Tippecanoe County, 1981-1989
Typically, premiums are specified according to a system of assigning insurance purchasers to risk classes for which different premium rates are quoted. With adverse selection, the insurance company may not be able to distinguish among producers of different types (e.g., “high risk” and “low risk”), and so charges the same premium (an average rate) to producers of both types. This average rate will be too high for “low risk” producers and too low for “high risk” producers; thus, only the “high risk” producers will buy the insurance and loss ratios will be greater than one.
One procedure to improve adverse selection is to obtain better information about the types of people to be insured. For example, in the case of automobile insurance, rates are set according to characteristics of the driver such as age, sex, mileage driven, and characteristics of the automobile. Because such indicators of care in driving may be imperfect signals of type, rates can later be adjusted according to driving history.
Similarly, in the case of rate making for crop insurance, producers could be tied according to yield loss characteristics. Yield variability and average yield are both important to identify the nature of yield risk. Therefore, in setting premium rates, the proposed classification system is based on both yield variability and average yield.
In comparison, current rate-making procedures are based only on average yield. Actual Production History (APH) is used to classify farmers according to their average yield over a 10-year period, and the same level of yield variability is assumed for all farmers with a given average yield. Both yield variability and average yield could be assessed from the historical data currently required for the Actual Production History.
Moral Hazard and Coinsurance. Moral hazard has to do with a producer changing production behavior after insurance is introduced, thus leading to losses greater than anticipated. One example of moral hazard behavior is not to irrigate a crop which is already failing. Another example is reducing the number of bushels harvested by changing combine settings in a year when the insurance price guarantee (the price paid per bushel of yield loss) is higher than the price which could be obtained through the market.
Moral hazard can typically be alleviated by the use of coinsurance which makes the insuree share the cost of losses with the insurance company. In contrast, the current crop insurance program uses a “full coverage” concept by applying close to the full market price (about $2.30 per bushel for com) to yield losses. Coinsurance would set the payment rate at less than the market price for yield loss.
The Yield Guarantee as a Deductible. The deductible is a feature of insurance for which a loss is only covered by insurance if it is above the deductible level. The deductible level is thus the highest loss incurred. Insurance with a smaller deductible gives a lower exposure to risk, but requires a larger fair premium. For general types of insurance, a menu of deductible levels is offered to provide a range of expression of risk preferences.
In crop insurance, the yield guarantee acts as a deductible. An indemnity will only be paid if yield falls below the yield guarantee level. A higher yield guarantee level corresponds to insurance with a smaller deductible for which indemnity payments are more frequently received.
The highest yield guarantee currently available from MPCI is 75% of average farm yield. In Tippecanoe County, farms with high-quality soils may never experience yields below 75%, even in severe droughts like those seen in the 1980s, so that indemnity payments would not be received under this MPCI contract.
The Committee for the Improvement of the Federal Crop Insurance Program, appointed by Congress after the 1988 drought, suggested the establishment of a pilot program offering yield guarantees of 85% for com and other crops, but such changes have not yet been incorporated into FCIC programs. Since offering higher yield guarantees could increase the potential for “moral hazard,” higher yield guarantees should be coupled with coinsurance, that is, lower price guarantees.
Buyers and Nonbuyers and Adverse Selection
Adverse selection has to do with problems of determining premiums for “buyers” of insurance when they may have different risk characteristics. To compare differences in characteristics of “buyers” and “nonbuyers”, a survey was conducted in Tippecanoe County in March and April of 1990. Respondents were categorized as either “buyers” or “nonbuyers” based on their decision whether or not to purchase MPCI for com in 1988. The classification was based on 1988 instead of 1989, because farmers required to purchase MPCI in 1989 due to receiving disaster payments in 1988 may not have been voluntary buyers.
Telephone screening produced 55 respondents whose primary occupation was fanning and who were willing to go through the lengthy personal interview. Twenty-two of these were classified as buyers and 33 were classified as nonbuyers. The proportion of buyers in the survey (40%) was higher than the proportion of actual buyers in Tippecanoe County in 1988, because the insurance participation rate for com (in acres) was actually only 26% that year. Therefore, responses were analyzed separately for buyers and nonbuyers. Responses were combined in the proper statistical proportions to represent the county in the analysis of alternative types of disaster programs described below.
Table 2 describes the personal characteristics of the farmers and the characteristics of their farms. The average age of the farmers in the sample was not quite 50 years old, and the average number of years farming was over 20 years. Most farmers had completed high school. There also were no statistically significant differences between buyers and nonbuyers in terms of total acres or total sales. There may be some minor differences between the groups in the debt/asset ratio and the “survivability” of the farm, but these differences were not statistically significant at the 95% confidence level.
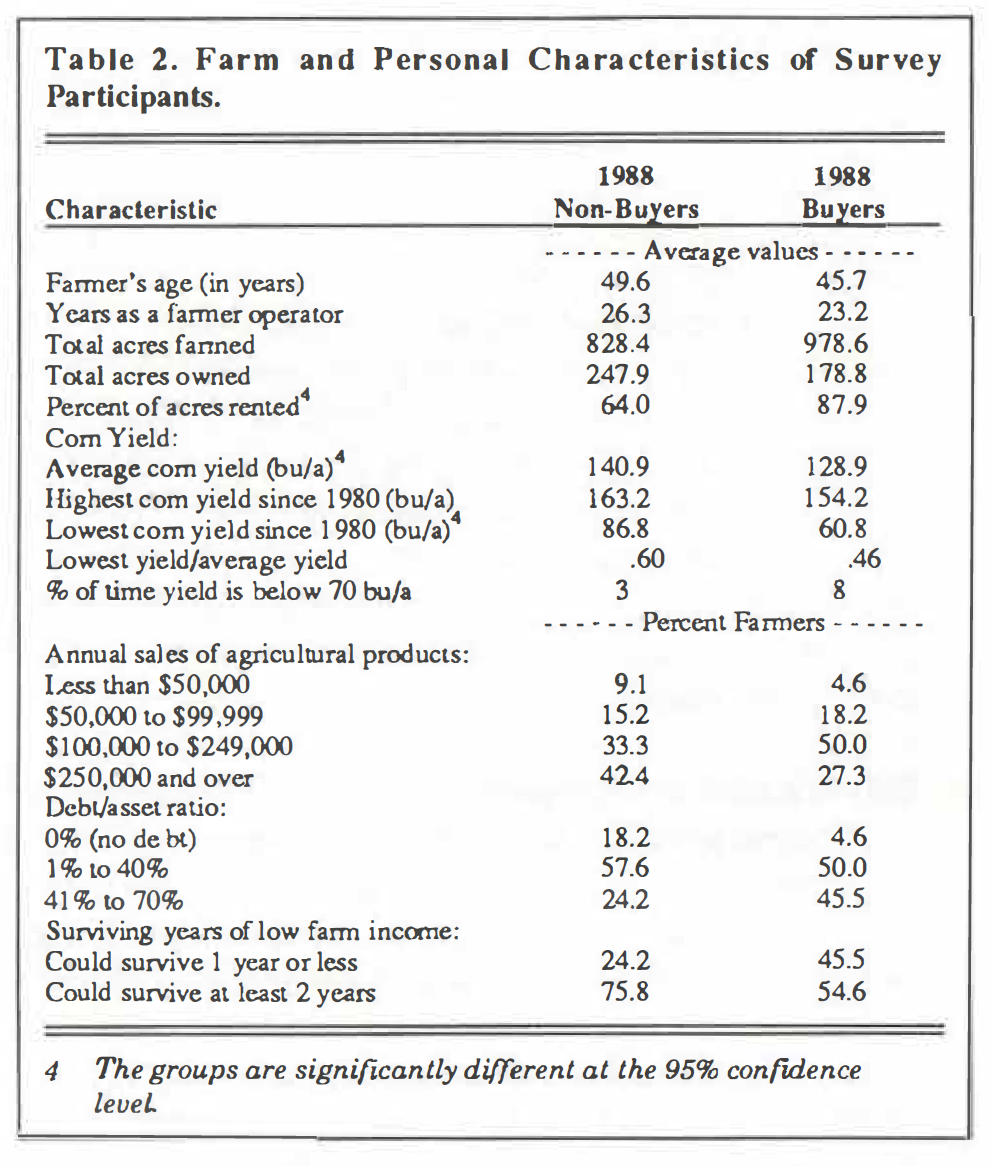
Table 2. Farm and Personal Characteristics of Survey Participants.
Com yield characteristics were significantly different for the two groups (see Table 2). Yield variability can be assessed by the ratio of the lowest yield experienced since 1980 to the average yield; a low ratio indicates high variability and a greater probability of experiencing significant yield loss. Insurance buyers tended to have lower average yields and greater yield variability than nonbuyers.
About 25% of the sample of nonbuyers had never experienced yields below 70% of average. The association of buyers with a higher probability of yield loss than nonbuyers indicates that producers do make insurance choices that reflect differences in yield risk.
In order to compare the current system of classifying farmers only by average yield with a classification system based on both average yield and yield variability, the sample of buyers and nonbuyers was further subdivided into four types according to yield variability (see Table 3). The four types exhibit combinations of higher or lower average yields and higher or lower yield variability. The majority of nonbuyers are in the higher average yield, lower yield variability class, whereas the majority of buyers are in the higher variability class.
The bottom of Table 3 compares FCIC rates for these four types with fair premium computed from a yield risk model developed at Purdue. The comparison indicates that current premium rates are too high for the lower variability farms and too low for higher variability, higher yield farms. Therefore, lower variability producers would tend not LO buy the current crop insurance contract at current FCIC rates unless they were extremely risk averse, whereas higher variability producers would be more likely to buy insurance. Thus, in order LO increase participation by low variability farmers to reduce adverse selection, premiums should be determined to reflect differences in yield variability. Yield risk models such as those used in the Purdue study could be used to compute more appropriate premium rates.
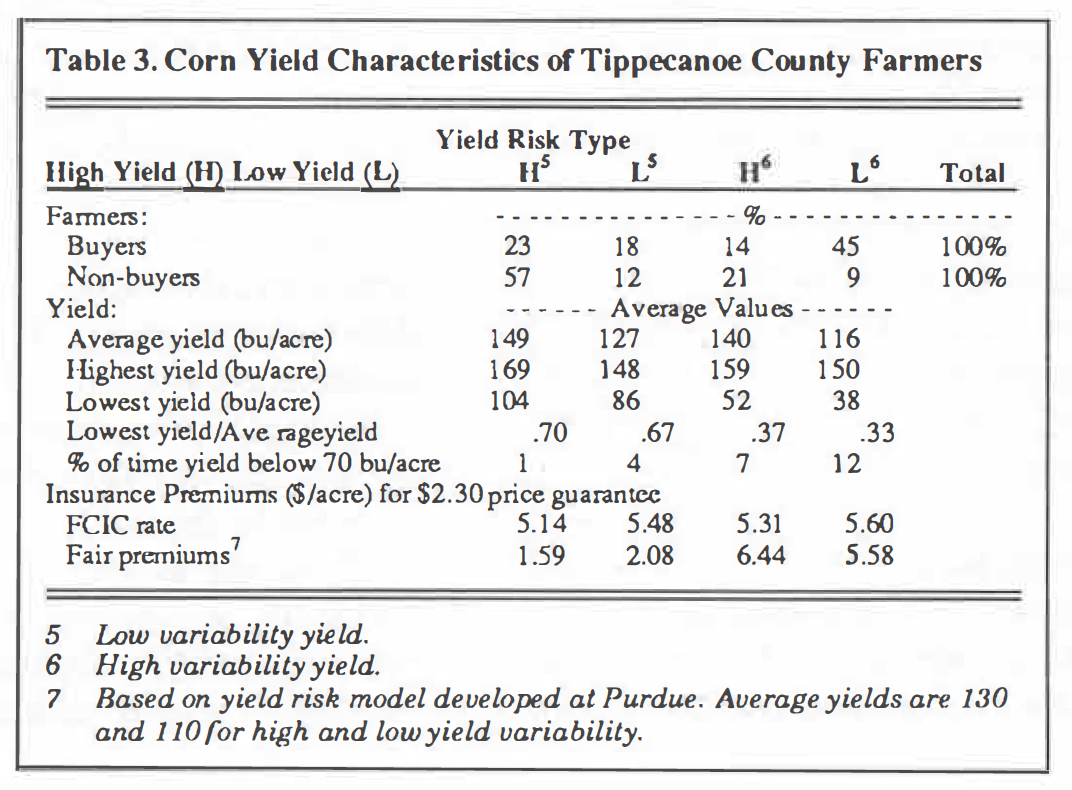
Table 3. Corn Yield Characteristics of Tippecanoe County Farmers
Tippecanoe County Farmers Respond
Farmers were asked to compare alternative types of insurance contracts, including contracts with higher yield guarantees and lower price guarantees than are presently used. Alternative types of insurance were priced at a fair premium. (Comparisons used a hypothetical farm which had average yield set at either 110 or 130 bu/acre to be representative of the farmer’s own yield.) Combining higher yield guarantees with lower price guarantees produced greater probability of payment with premiums no greater than current levels.
When given detailed information about insurance and fair premium levels (probabilities and amounts of payment for various yield levels), 24% of the nonbuyers said they would buy the current yield and price guarantees. Participation in insurance by nonbuyers could be increased even further (up to 48%) by offering higher yield guarantees of 80 or 85%. Thus, adverse selection would be reduced by increasing yield guarantees.
Not all the 1988 buyers agreed to continue buying insurance after receiving insurance information -only 77% would continue to buy the current contract at a fair premium. The participation by buyers was 86% with the 80% yield guarantee.
Combining nonbuyers and buyers represents about 70% of the acres in the county which would be covered by insurance if the set of available contracts was extended LO include higher yield guarantees (80% and 85%) with lower price guarantees ($1.40 and $1.70). Because of the hypothetical nature of insurance comparisons, farmers were asked if they would make similar choices for their own farm. All the buyers and most (about 90%) of the nonbuyers indicated they would make the same insurance decisions for their own farms.
Alternative Disaster Assistance Programs
Five alternative types of disaster programs (two types of disaster payment programs, the current program, farm insurance with the four improvements suggested above, and such a program with a 15% premium subsidy) were compared for Tippecanoe County (see Table 4).
Disaster payments with a 65 % county yield loss trigger are similar to the Bush proposal for the 1990 Farm Bill and also similar to how indemnity payments were actually made after the 1988 drought. In this case, payment is based on individual farm losses but must be triggered by a county-wide loss. There is no premium cost to the farmer and all farmers automatically receive benefits if a countywide yield loss occurs. The 80% trigger provides greater probability of indemnity payments for producers.
Farm yield insurance alternatives included: a base case similar to the current program with a 30% premium subsidy in which farmers are only classified by average yield and the highest yield guarantee is 75%; a case with improved farmer classification and improved contract design, for which farmers are categorized by both average yield and yield variability, and higher yield guarantees (up to 85%) are coupled with lower price guarantees of $1.70 or $1.40; and a case with improved classification of farmers and improved contract design which also has a 15% premium subsidy.
Criteria for comparing these alternative programs are participation rate, total government subsidy cost, premiums paid by farmers, the expected value of losses covered by indemnity payments, and the expected value of losses not covered by payments (“unrecovered losses”) for yields below 65% of average yield -since 65% has been defined as the socially unacceptable level of yield loss in previous disaster programs. With no disaster assistance, the expected value of yield losses in Tippecanoe County for yields below 65% of average yield would be about $120,403.
Participation rates were predicted from insurance demand models developed at Purdue based on survey responses. Subsidy costs and expected loss values were evaluated using yield risk models developed at Purdue and assumptions about moral hazard and adverse selection. The loss ratio for the base case is taken to be 1.2, similar to the historical average. A lower loss ratio (1. 1) is assumed for farm insurance with improved classification of farmers’ yield risk. A loss ratio of 1.0 is assumed for disaster payments triggered by county losses because moral hazard and adverse selection would not occur with such a program.
The type of disaster payment program proposed by Bush, while having a much lower government subsidy cost than the current program, would have much higher unrecovered losses than the base program ($93,047 compared to $37,461), only about a third lower than if there were no disaster program. Using the 80% trigger would give lower unrecovered losses than the 65% trigger but would also require a higher subsidy cost in an amount approaching the cost of the current program. Thus, such programs would not be improvements compared to the current program.
Farm insurance with improved classification of farmers and improved contract designs would increase participation with a small reduction in unrecovered losses at a reduced subsidy cost compared to the base case. A 15% premium subsidy with improved contracts and improved farmer yield risk classification would produce an even greater participation and reduce unrecovered losses by 50% compared to the base case for a similar subsidy cost. Therefore, either of these program modifications would be better on economic efficiency grounds than the current type of program. Which one to adopt would depend on whether government insurance subsidies could be continued at the current level. Either would allow the cost duplication for disaster payments to be eliminated.
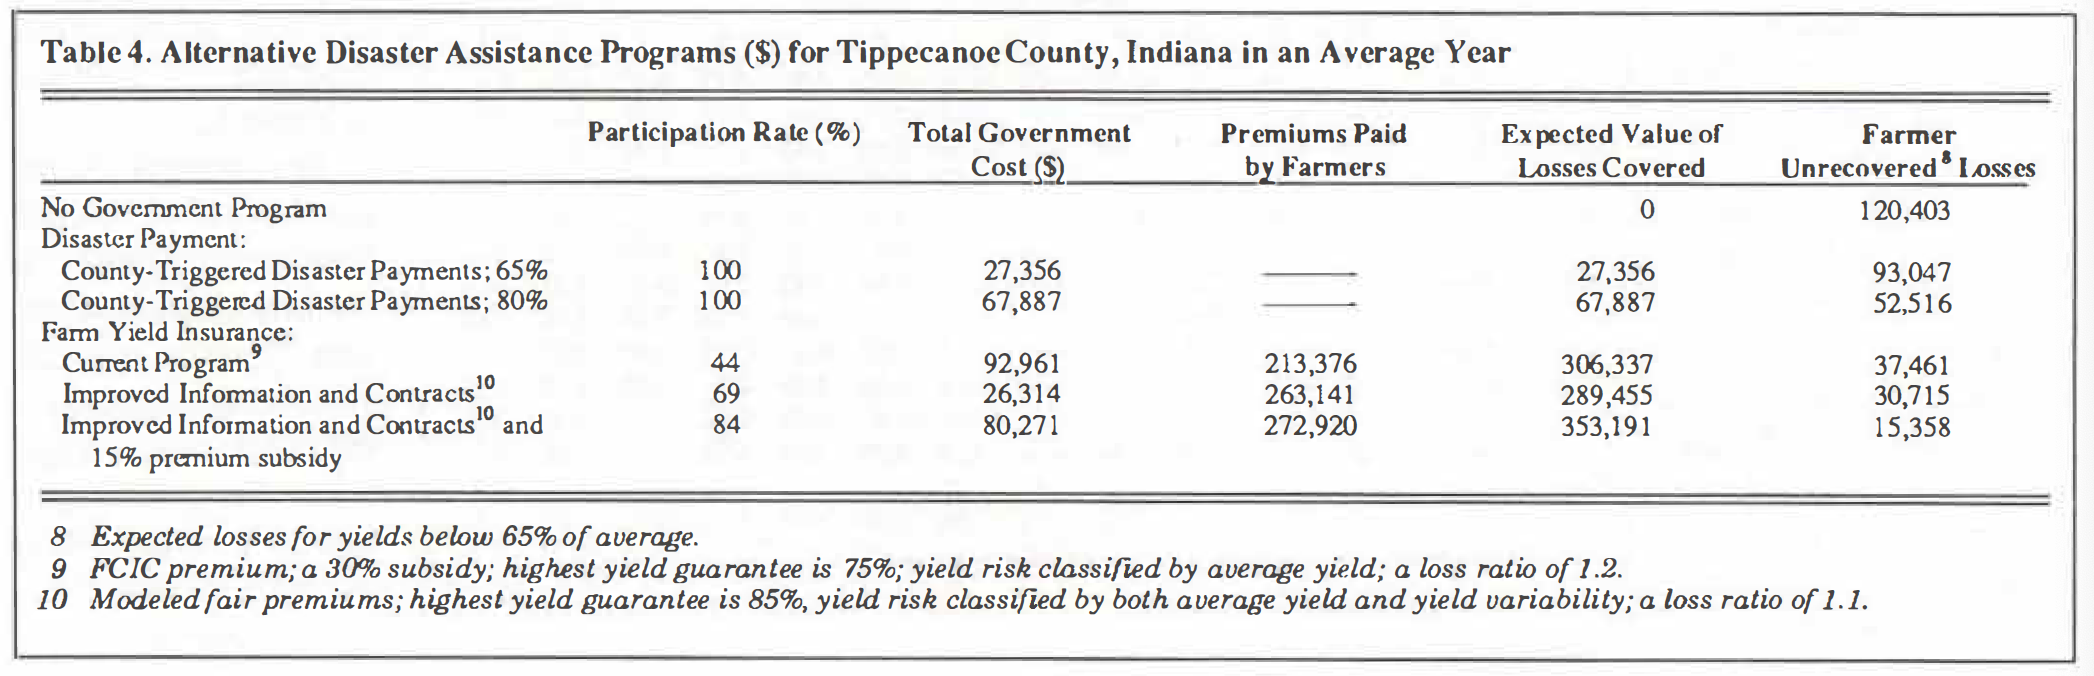
Table 4. Alternative Disaster Assistance Programs ($) for Tippecanoe County, Indiana in an Average Year
Summary
These results indicate that federal crop insurance participation can be increased -in an area where it has been historically low -in a manner that provides adequate yield risk protection at reduced government cost. Implementation of the changes proposed here would require new methods of farmer classification and ratemaking as well as modification of current insurance contract designs.
References
Barnaby, A., B. L. Flinchbaugh, “Public Policy Alternatives for Natural Disaster Protection,” National Workshop on Risk Management Strategies Utilizing Multiple Peril Crop Insurance, Kansas State University and USDA in cooperation with Federal Crop Insurance Corporation, Kansas City, November 1988.
Barnaby, G.A., and J. Skees. “Public Policy for Catastrophic Yield Risk: An Alternative Crop Insurance Program,” Choices, Second Quarter, 1990, pp. 7-9.
Commission for the Improvement of the Federal Crop Insurance Program. “Principal Report: Recommendations and Findings.” Washington, D.C., July 1989.
Nelson, C.H. “The Influence of Distributional Assumptions on the Calculation of Crop Insurance Premia,” North Central Journal of Agricultural Economics, 12(1990): 71-78.
Vandeveer, M. L. Demand for Crop Insurance and Contract Design: A Case Study for Corn in Indiana, Ph.D. thesis, Purdue University, Department of Agricultural Economics, December 1990.
American Association of Crop Insurers, Multiple Peril Crop Insurance Performance in Indiana, 1990, Washington, D.C.
![]()
![]()
![]()
![]()
![]()
