How does the USDA help hungry families?
December 6, 2018
PAER-2018-26
Jayson L. Lusk, department head and distinguished professor of agricultural economics
![]()
![]()
![]()
![]()
![]()
Overview of Food Assistance Programs
Looking just at spending, the U.S. Department of Agriculture (USDA) and the Farm Bill might be more aptly described as the U.S. Department of Food Assistance and the Food Assistance bill. In 2017, the USDA is estimated to spend about 77% of its $133 billion in outlays on food assistance programs.
USDA food assistance programs are administered by the Food and Nutrition Service (FNS), and the largest program administered by FNS is the Supplemental Nutrition Assistance Program (SNAP), historically known as “food stamps.” About 70% of the FNS budget authority is allocated to SNAP. The next largest programs, representing about 21% and 6% of FNS budget authority, are Child Nutrition Programs (CNP) and the Women, Infants, and Children (WIC) programs. The CNP primarily delivers free and reduced-price breakfasts and lunches to school children. In December 2017, about 22 million school children participated in the free or reduced lunch program and about 12.6 million participated in the free or reduced breakfast program. The WIC program primarily targets women who are pregnant or who have infant children by providing coupons for infant formula, milk, cheese, and other staple foods. There were about 6.9 million WIC participants in December 2017. SNAP and CNP are entitlement programs (i.e., every person who meets eligibility criteria is allowed to participate), but WIC is a discretionary program whereby the federal government grants a specific dollar amount to be spent each year.
The History of SNAP
Given its size, it is important to explore SNAP in more detail. While various forms of the federal food stamp program have existed since at least the Great Depression, the modern version of the program was brought into being as a part of Lyndon B. Johnson’s Great Society, and the program was made permanent in 1964. Early versions of the program required participants to buy stamps. In the mid-1970s, the program rolled out nationwide and participants were no longer required to purchase food stamps. In the early 2000s, the USDA began to replace physical stamps with an Electronic Benefit Transfer (EBT) card, which is how the program is administered today. The EBT card works much like a debit card; benefits are electronically deposited each month and the card is only authorized for certain types of food purchases.
Figure 1 shows changes in the SNAP program from 1962 to 2017 (data are from here, here, and here). Prior to the 1970’s, only about 5% of USDA spending went toward SNAP. There were large increases in the SNAP spending share in the early 1970s (increasing to about 35%), in the early 1990s (increasing to about 50%), and in the early 2000s, reaching a point today where just under 70% of USDA spending goes toward SNAP.
Figure 1 also shows that prior to 2008, less than 10% of the U.S. population (and only about 10% of US households) were on SNAP. Following the Great Recession, SNAP participation rose, peaking in 2013 at about 15% of the U.S. population and about 18.6% of U.S. households. SNAP participation rates have subsequently fallen but remain higher than 2009 levels. Following the Great Recession, SNAP participation rose much more rapidly than did the poverty rate, indicating a greater share of people who were eligible for SNAP now enroll than in the past. Currently, about 40% of households who receive SNAP have children at home, a figure that has fallen from about 60% in the 1990s.
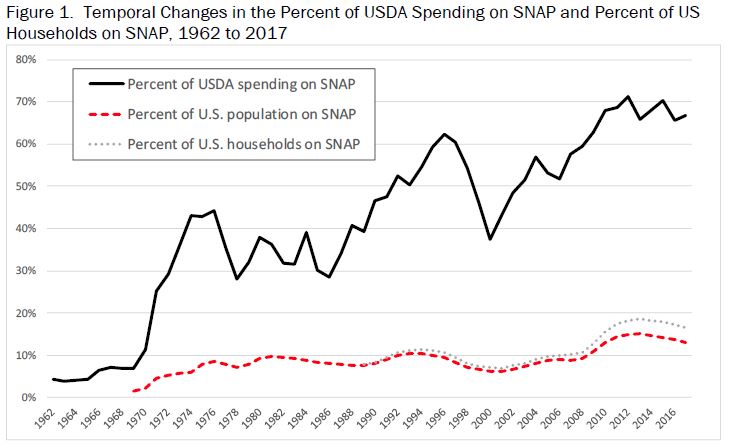
Figure 1. Temporal changes in the percent of USDA spending on SNAP and percent of US households on SNAP, 1962-2017
What are the effects of the SNAP Program?
A large amount of academic research has been conducted on the effects of SNAP and other food assistance programs (see here for a recent review). Research suggests the following insights:
- SNAP funding has very little effect on farm prices or farm income;
- Obesity and food insecurity are associated with SNAP participation, but the relationships are not causal; high quality studies show that SNAP participation reduces the odds of being food insecure;
- Logic dictates that most SNAP recipients, when shopping, should behave as if SNAP allocations were unrestricted cash transfers; some research suggests, however, that SNAP recipients are more likely to spend an extra SNAP dollar on food than an extra dollar received from other sources.
- Polls indicate majority opposition to cuts in SNAP benefits, but support for various restrictions on SNAP spending.
How could SNAP be changed as a result of Farm Bill deliberations?
As the next Farm Bill discussions get underway, there is likely to be debate about potential changes in food assistance programs. Budget concerns suggest there is likely to be pressure to reduce SNAP spending, but as previously mentioned, SNAP is an entitlement program. Thus, reduced spending can only be achieved by altering eligibility or reducing benefits levels. What follows are a few proposals likely to arise in upcoming discussions about food assistance programs:
- Reduce SNAP spending by eliminating the ability of potential participants to deduct income from certain energy assistance programs when determining eligibility;
- Reduce SNAP spending by imposing and altering work requirements;
- Reduce spending on SNAP by eliminating minimum payments and imposing caps;
- Block-grant federal SNAP spending to states and require state matches;
- Add further restrictions on the types of foods that can be purchased with SNAP to encourage healthier eating;
- Require vendors who accept SNAP benefits to stock certain healthy foods;
- Provide money back when SNAP benefits are spent on healthy foods; and
- Replace some of the SNAP benefits with a “harvest box” containing staple foods directly delivered to households.
It is too soon to tell whether or to what extent any of these proposals will gain traction in upcoming Farm Bill debates. If passed, however, they could entail significant changes to what has become one of the largest social safety nets in the country.
![]()
![]()
![]()
![]()
![]()