Increasing Concern of a Bubble in Indiana Farmland Prices
August 10, 2022
PAER-2022-25
Todd H. Kuethe, Associate Professor and Schrader Chair in Farmland Economics, Mohammad Haseeb Daudzai, M.S. Student and Pete Drost, M.S. Student
![]()
![]()
![]()
![]()
![]()
Indiana farmland prices grew at a record pace between 2021 and 2022 (Kuethe, 2022). Given recent experiences with fluctuations in the broader economy and prior farmland prices dynamics, many market participants express concern that the rapid increase in farmland prices is a signal of a speculative bubble. Economists define a speculative bubble as instances when an asset’s market price is higher than the discounted value of all future payouts the asset is expected to generate. In other words, the market price of an asset exceeds a value that can be justified by the returns that accrue to owners.
Speculative bubbles can be harmful even before they burst. Bubbles can encourage reckless investing, pulling capital away from more productive uses. By artificially raising market prices, bubbles limit market entry. When a bubble bursts, it brings additional damage to an economy. A rapid price fall harms asset owners nearing retirement who cannot wait for a recovery. When a bubble bursts, lenders may respond to the increased risk by tightening the access to credit which may further reduce overall productivity.
While bubbles are a significant threat to market participants, they are difficult, in practice, to measure or observe. One way economists attempt to measure an asset price bubble is to examine the relationship between market prices and its discounted returns. For example, the gold line in Figure 1 plots the average price per acre for top quality Indiana farmland from 1978 to 2022. The black line represents the discounted returns to ownership as captured by the capitalized value of cash rents. The capitalized value of cash rents is obtained by dividing current cash rental rates by a discount rate, in this case the market yield on U.S. Treasury securities at a 10-year constant maturity. The relatively simple model suggests that farmland prices may be driven by a speculative bubble when the market value (gold line) exceeds the capitalized rent (black line).
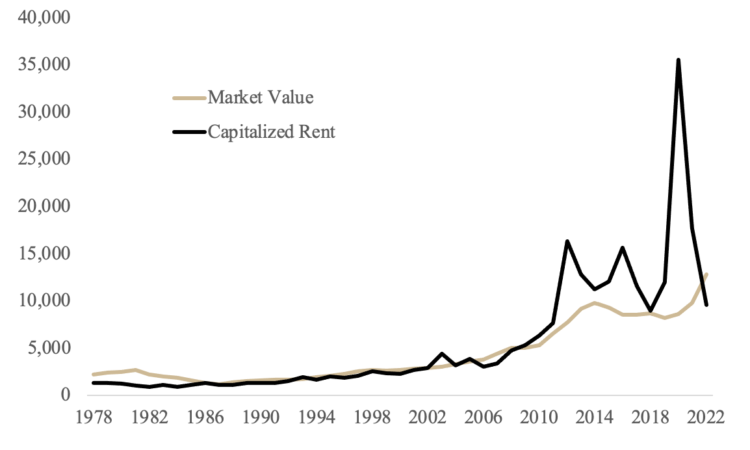
Figure 1: Market Value and Capitalized Rent for Top Quality Indiana Farmland, 1978 – 2022
Many economists argue that the 1980s Farm Financial Crisis was driven, in large part, by a speculative bubble in farmland prices. For example, in 1981 the average cash rent per acre for top quality farmland in Indiana was $137, and the market yield on the 10-year Treasury was 13.5%. Dividing 137 by 0.134, yields a capitalized rent of $1,022 per acre. The average market price for an acre of top quality farmland in 1981, however, was $2,679. Thus, the market values greatly exceeded a value that could be justified by a function of cash rent and discount rates. The same pattern was observed between 1978 and 1985.
This is contrasted by the relationship between market values and capitalized rents during the farmland price boom of the early 2000s. For example, in 2011, the average per acre cash rent for top quality Indiana farmland was $230, and the market yield on the 10-year Treasury was 3.0%. This yields a capitalized rent of approximately $7,557 per acre, which was above the average per acre market price of $6,521. Thus, while farmland prices grew at an exceptionally high rate of 22.8% in 2011, the simple capitalization model suggested that investors could justify farmland prices that were even higher.
In 2022, the market value for top quality farmland again exceeds the value implied by capitalized rents. The average per acre cash rental rate for top quality farmland in 2022 is $300. The market yield for the 10-year Treasury in June of 2022 averaged 3.1%. Thus, the capitalized rent is estimated at approximately $9,677 per acre, well below the market average price of $12,808 per acre.
It is important to note that it is difficult to conclude that Indiana farmland prices are currently in a bubble. It should be noted that, since 1978, the capitalized rental rate exceeded the market value roughly 60% of the time. There is an old adage that all models are wrong but some are useful. The model depicted in Figure 1 is subject to a number of important assumptions. First, while cash rents are important source of returns to farmland ownership, there a number of other sources that the model ignores, such as development potential or recreational access. Second, there a number of candidate discount rates beyond the 10-year Treasury that would influence the capitalized value. Third, the rental rates and market values were obtained are averages, and both values may vary significantly across parcels. Thus, to conclude that farmland prices are currently in a bubble would require the strong assumption that this simple model accurately captures all of the relevant economic forces that drive the true discounted returns to farmland ownership. However, the simple model does suggest that if discount rates continue to increase, farmland prices should be expected to decline without marked increases in the returns to ownership.
Economists also define bubbles based on more subjective measures derived from market participants. Speculative bubbles can emerge when market participants have differing expectations of future asset values and returns, and market pessimists are prevented from tempering market prices. To capture the unseen expectations of market participants, Pesaran and Johnsson 2020 developed a bubble potential measure. The measure operates under the assumption that if market participants think current asset prices are too high, they should expect future prices to decline and vice versa. However, if the market participants think current asset prices are too high and they expect future prices to increase, this could be evidence of an asset price bubble. Synthesizing the above assumptions, Pesaran and Johnsson 2022 employed the use of a double-question survey. Survey participants were first asked if asset prices were too high, too low, or just right, and following this, were asked to give an expected future price for the same asset. If responses deviated from the original assumptions – asset prices were judged to be too high, but the participant expected a higher future price – the participant would be given a bubble indicator (the inverse of this scenario would apply for a crash indicator). Indicators would then be summed for the entire sample to measure the potential of a bubble or crash.
As shown in Figure 2, the share of Purdue Farmland Value and Cash Rent survey who thought top quality farmland prices were too high increased from 36% to 65% from 2021 to 2022. In addition, 27% of respondents thought current farmland prices were too high but expected prices to continue to increase over the next six months (through December 2022), the next eighteen months (December 2023), and five years (June of 2027). Thus, over a quarter of all respondents have expectations consistent with farmland price bubbles. Across all three horizons, concern for a potential bubble has increased between 2021 and 2022.

Figure 2
Table 1 shows that concern for a potential bubble in farmland prices varies by region, soil quality type, and expectation horizon. In 2022, the Central region had the largest share of respondents who think current farmland prices are too high, between 82% and 86% of respondents. Only 23% to 27% of Central region respondents thought prices were too high and expected prices to increase over the next six or eighteen months. However, 41% of Central region respondents felt that current prices are too high and expected prices to increase over the next five years. The Northeast region had the largest share of respondents who expect a farmland price bubble in 2022, with between 30% to 43% of respondents expecting a bubble over a six or eighteen month horizon.
Going Forward
Given the record appreciation in Indiana farmland prices in 2022, market participants may be concerned of a speculative bubble. A relatively simple model based on current discount rates and cash rents suggests that 2022 farmland prices are greater than can be justified by market fundamentals. A majority of respondents to the Purdue Farmland Value and Cash Rent Survey believe that current market prices are too high, and a modest share of respondents expect prices to continue to increase. For future increases to be justifiable, farmland returns would need to increase or discount rates would need to decline. Most economists expect interest rates to continue to increase as a result of inflationary pressure and economic uncertainty. Thus, for farmland prices to remain at record high levels, farmland returns would have to increase in tandem with interest rate increases.
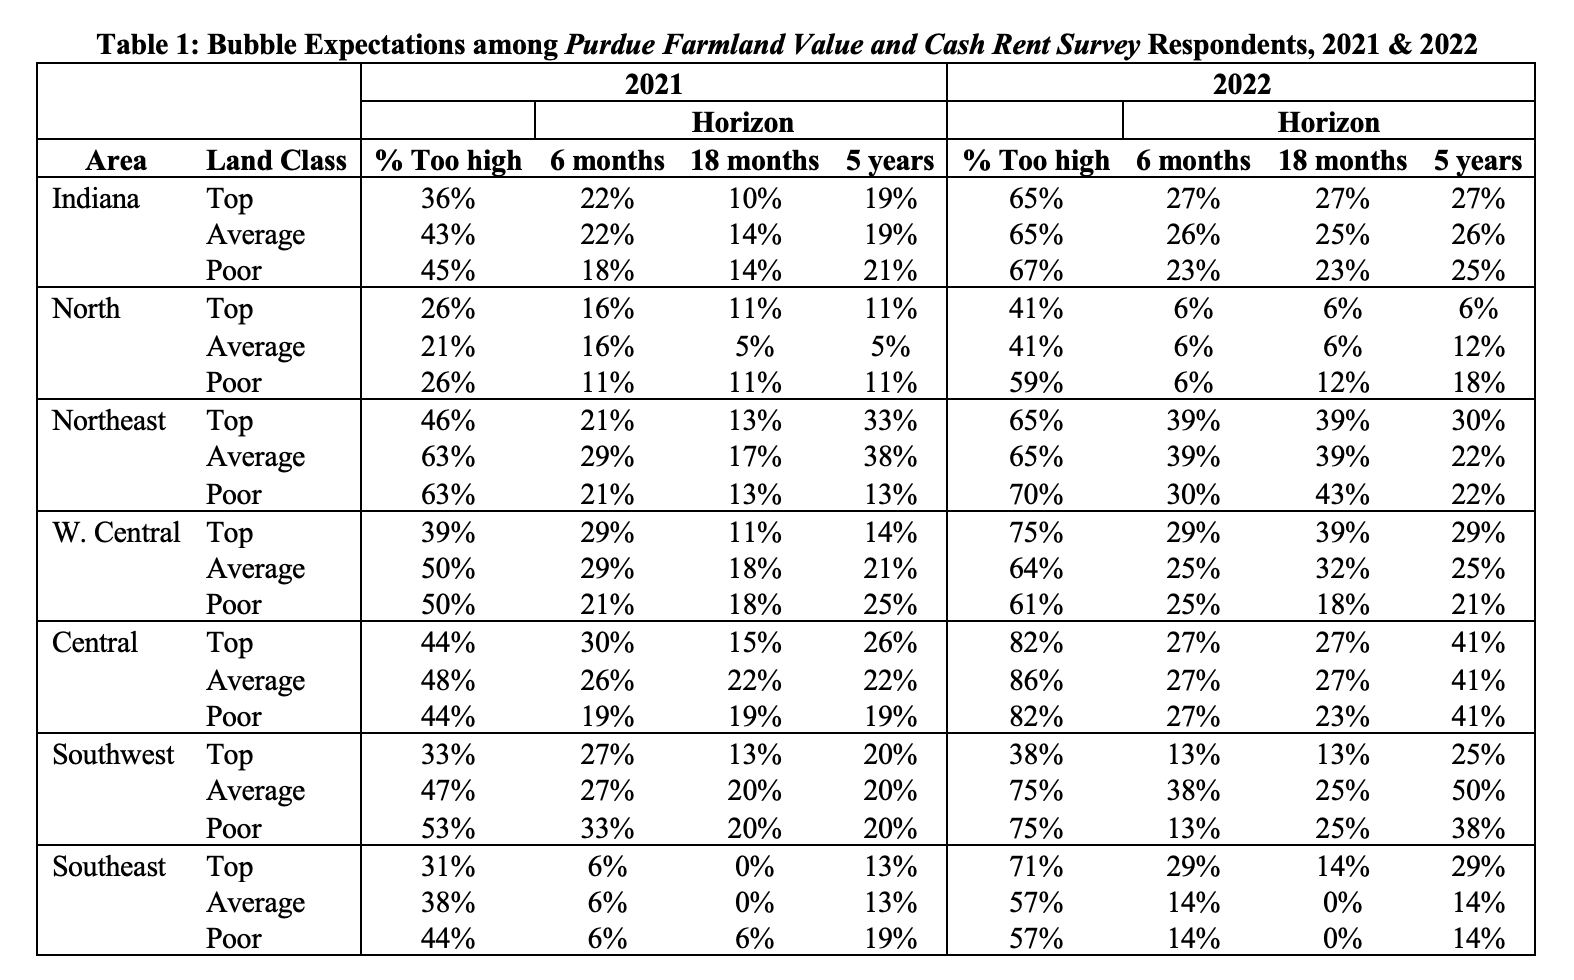
Table 1: Bubble Expectations among Purdue Farmland Value and Cash Rent Survey Respondents, 2021 & 2022
References
Kuethe, T.H. (2022) “Indiana Farmland Prices Grow at Record Pace in 2022” Purdue Agricultural Economics Report, August 2022.
Pesaran, M.H. and I. Johnsson (2020) “Double-Question Survey Measures for the Analysis of Financial Bubbles and Crashes” Journal of Business Economics and Statistics 38 (2): 428-442.
![]()
![]()
![]()
![]()
![]()