Informativeness of USDA’s agricultural export projections
April 26, 2022
PAER-2022-15
Hari P. Regmi, Ph.D. Student; and Todd H. Kuethe, Associate Professor and Schrader Endowed Chair in Farmland Economics


Introduction
Long-term agricultural export projections play a vital role in shaping agricultural trade policy and business investment decisions. In 2019, agricultural exports in the United States totaled $141.2 billions (USDA, 2022). Each dollar of agricultural exports stimulated another $1.14 in the economy (USDA, 2022). Agricultural exports stimulate both direct and indirect economic activity and contribute significantly to employment creation. In 2019, agricultural exports supporting more than one million full-time civilian jobs (USDA, 2022). Employment generations are not limited in the farm sector. Instead, agricultural exports support many non-farm sectors such as processing, manufacturing, and transportation. Thus, export projections that are accurate and reliable, play a critical role in shaping U.S. farm and agricultural trade policy.
The United States Department of Agriculture (USDA) Interagency Agricultural Projections Committee comprised of ten USDA statistical agencies and offices, produces an agricultural baseline that summarizes key agricultural production and market conditions. The baseline projections provide ten years conditional projections of export-import scenario, aggregate farm income, price, production, supply, and demand estimates under certain specific assumptions. Such projections are critical for understanding the agricultural sector’s future economic conditions. These projections necessitate significant resources and skill sets, and play an important role in agricultural policy. However, baseline projections are not rigorously evaluated in the literature (a notable exception, Bora et al., 2021). Our objectives are to examine the unbiasedness and informational value of USDA’s baseline agricultural export projections.
In this study, we examine USDA’s projections of high value commodities, bulk commodities, and total exports from 1997 to 2020. High value commodities and bulk commodities summed together equal the totality of agricultural exports. High value commodities include semi-processed and processed grains and oilseeds, animals and animal products, horticultural products, sugar and tropical products. Bulk commodities include bulk grains, soybeans, cotton, and tobacco.
The baseline report consists of: 1. Projection of next ten years, 2. Provisional estimates of earlier year, and 3. The most recent realized values (t-2). For example, 2022 baseline reports consist of projections of 2022 through 2031, provisional estimates of 2021, and actual values of 2020. Figures 1-3 depict projections and realized values ($ billions) of total agricultural exports, high value commodities, and bulk commodities since 1997 to 2022.
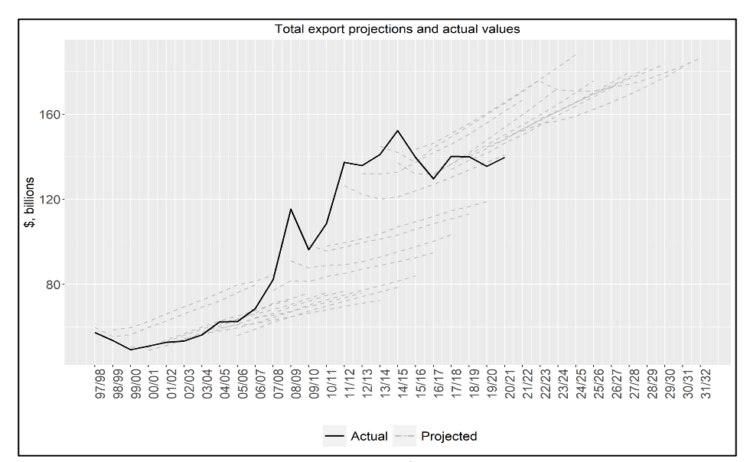
Figure 1: Total export projections and actual values ($, billions) 1997-2022.
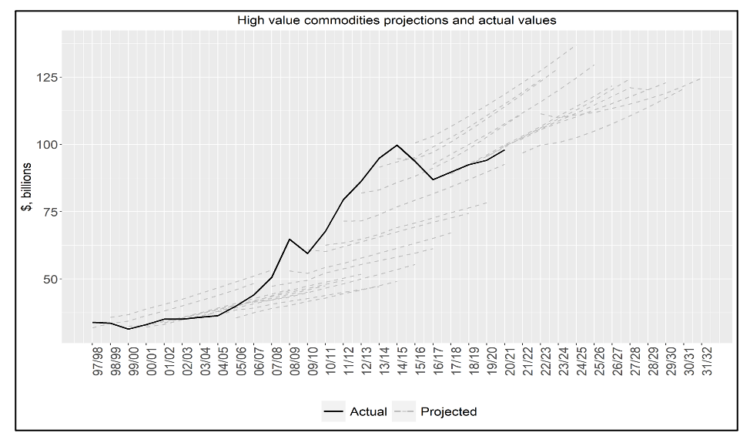
Figure 2: High value commodities projections and actual values ($, billions) 1997-2022.
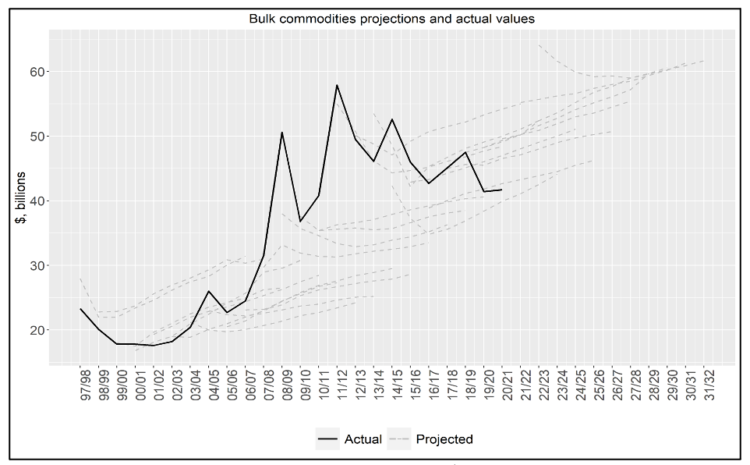
Figure 3: Bulk commodities projections and actual values ($, billions) 1997-2022.
Analysis
We use a traditional test of forecast bias to examine whether there are any systematic patterns in the prediction error (actual-predicted). The bias test indicates whether forecasts systematically deviate from actual values. We use Holden and Peel (1990) approach to test for bias (regress forecast error on a constant). Then, we evaluate the informational value of export projections using Breitung and Knuppel (2021) approach. The test of informativeness indicates that there exists a maximum projection horizon (h*) beyond which the outcome would be unpredictable. The test of informativeness may provide useful insights in long-term planning and investment decisions.
We find that USDA projections of total export value, high value commodities, and bulk commodities are biased downward. More specifically, USDA projections underpredict total export value, including high-value and bulk commodities. Figures 1-3 also indicate that projections are below the actual values for most of the years. Furthermore, the bias increases as the horizon lengthens. This indicates that all changes in market dynamics may not be anticipated while making projections.
We compute the predictive content (the horizon up to which the projections are informative) of baseline projections of high value commodities, bulk commodities, and total export values. Our results indicate that projections of total exports and high value commodities are informative up to horizon four (year four). Bulk commodities projections are informative up to horizon three (year three). Our findings suggest that high-value commodity projections are more informative (at least for another year) than bulk commodity projections. One explanation for this finding is that high-value commodities include processed and semi-processed commodities, and importers (consumers) of high-value commodities may be more concerned with product quality, branding, and other standards, and thus less likely to substitute products from other exporters in the international market. Bulk commodities, on the other hand, is less informative, may be due to the fact that bulk commodities such as corn and soybeans are relatively more uniform in quality and easily substituted from other exporters in the international market.
References
Bora.S., A. L. Katchova, and T. H. Kuethe. 2021. “Evaluating USDA’s Baseline Projections.” Paper Presented at the NCCC-134 Conference on Applied Commodity Price Analysis, Forecasting, and Market Risk Management. 2021.
Breitung, J., and M. Knüppel. 2021. “How far can we forecast? Statistical tests of the predictive content.” Journal of Applied Econometrics 36:369–392
Holden, K., and D.A. Peel. 1990. “On testing for unbiasedness and efficiency of forecasts.” The Manchester School of Economic & Social Studies 58:120–127.
USDA Economics, Statistics and Market Information System, 2022. “USDA Agricultural Projections” available on https://usda.library.cornell.edu/concern/publications/qn59q396v?locale=en#release-items (Accessed: March 15, 2022)
USDA, Economic Research Service. 2022. “Impacts of Agricultural Trade in 2019”. https://www.ers.usda.gov/data-products/agricultural-trade-multipliers/2019-data-overview/ (Accessed: March 15, 2022)