
Investment in Downstream Publicly Traded Firms as a Vertical Integration Strategy to Increase Returns and Reduce Annual Volatility for Pork Producers
August 13, 2003
PAER-2003-9
Josh Detre, Christine Wilson, and Allan Gray
![]()
![]()
![]()
![]()
![]()
In recent years, there has been a growing interest among pork producers to substantially reduce the annual volatility of the returns associated with their pork enterprises and capture some of the profit associated with value-added activities. The pork market has undergone tremendous change. Consumers are no longer content with a homogenous bulk product; instead, they want a product that has substantial value added beyond the farm gate. These changes have challenged pork producers to find ways to capitalize on the demand for value-added products. Many of the traditional methods for producers to capture additional downstream value, however, have either been financially infeasible and/or simply have not accomplished the producers’ goals. This article reports on research conducted at Purdue University to evaluate whether or not investment in a portfolio of publicly held companies that are first handlers of pork products would provide pork producers with a means of enhancing returns and reducing annual volatility in returns.
The primary objective of the research was to investigate the potential of a value-added portfolio consisting of investments in pork production and publicly traded value-adding processing companies that will reduce the annual volatility of returns and improve annual returns relative to investing strictly in pork production alone. Thus, the hypothesis was that by investing in publicly held value-added processing companies in addition to the pork operation, pork producers will benefit through an increase in reward (returns) for the amount of risk they bear in their overall portfolios. The goal was to provide producers with information on using investments in publicly traded companies as an alternative to direct investment in physical assets for capturing the benefits of value-added activities on an annual basis. The methods used in this article are one way of achieving this goal. Although long-term and multi-period investment horizons are important in overall financial planning, these horizons were beyond the scope of the research project reported here.
The Portfolio Model
Data for this research consist of monthly returns from January 1974 to December 2001 for farrowing and finishing hogs as well as for finishing feeder pigs. Each set of monthly returns contains the relevant cost information, initial investment, the selling price, and the profit (loss) per head for the pork production enterprises. The model in the study requires monthly return on investment for each of the livestock enterprises as well as monthly stock prices and dividends for the value-added agribusiness firms and the monthly return data for the S&P 500. Annual returns for the securities and the S&P 500 are determined through compounding of the monthly investment returns.
The agribusiness firms used in this study are first handlers of livestock products beyond the farm gate; they are the next step in the value-added chain. Note that many of these companies have operations beyond the first handler processing level of the livestock products.
This research developed an optimal portfolio of pork and value-added investments using a spreadsheet simulation model. The simulation model was used to generate estimates of returns and risks based on the historical return data. Results depend on a replication of historical distributions of important parameters and/or variables about which there is substantial uncertainty. The set of correlated simulated returns were used to develop a weighted portfolio that sought to maximize the Sharpe Ratio, a portfolio performance measure, i.e. they have the best return per unit of risk for a given risk free interest rate. The resulting portfolio represents the optimal portfolio on the efficient frontier curve of portfolio choices when the economic decisions are separated from the financing decision. The optimal portfolio consisting of pork production and value-added stock investment was thus deter-mined by maximizing the Sharpe ratio portfolio performance measure. The combination of investments (pork production and specific stocks) that provided the greatest annual return per unit of risk (i.e., the largest Sharpe ratio) comprised the optimal portfolio.
One assumption that had to be addressed in the simulation model for this study was the amount the pork producer would be willing to invest in the securities and the amount that would be invested in the pork enterprise on a percentage basis. It would be unrealistic to assume that a pork producer would make a 100% investment in publicly traded
value-adding firms and no investment in the pork enterprise. Therefore, the model incorporates scenarios to examine varying levels of investment in the securities and in the pork enterprise. Multiple scenarios were used to examine the impacts on the optimal value-added portfolio of varying the levels of minimum investment in the pork enterprise. Two of these scenarios are discussed in this article. The base scenario assumed that all investment was held solely in the pork operation. The alternate scenario assumed that a maximum of 30 % could be invested outside of the pork operation in the value-added stocks. Each scenario provided a different investment strategy for the pork producer based on the given level of investment in the pork enterprise and the agribusiness stocks available for selection. Thus, the total investment in each scenario was 100%, but the maximum allowable amount that could be invested in the value-added stocks changed from 0% in the base scenario to 30% in the alternative scenario. Only the public value-adding companies that had a minimum of 60 months of historical data, given the study period, were used in the development of a portfolio.
The model used five different study periods, 1981, 1986, 1991, 1996, and 2001. The use of various study periods provided for the examination of how a producer’s optimal value-added investment strategy has changed over time, both in the number of stocks available for investment in and in the amount of investment made. Some of these companies were either not established or were not publicly traded during all or a portion of one or more of the data study periods. Therefore, during each of these study periods, the producer’s portfolio was chosen only from all of the value-added companies trading during the time period that had at least the prior 60 months of historical data available for defining the probability distributions. For example, the portfolio as of January 1, 2001, for a hog finishing operation had 24 value-added companies with 75 months of historical data from which to develop a portfolio. The data for developing this specific portfolio consisted of returns from October 1994 through December 2000. As a second example, the portfolio derived using only companies that had data existing in all years between 1974 and 2001 had only 14 value-added companies available for the producer to choose from (versus the 24 companies that existed as of January 2002). However, this longer time series allows more data per company to define the distributions of the individual investments. These distributions are important in the model simulations.
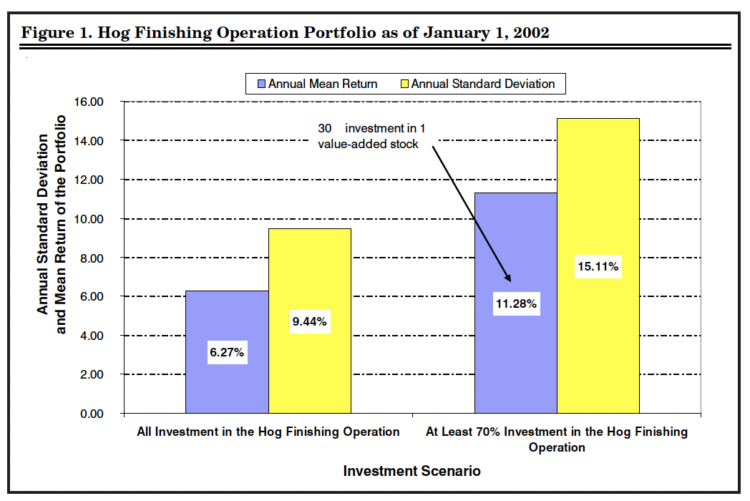
Figure 1. Hog Finishing Operation Portfolio as of January 1, 2002
Results
Results indicate that over the entire data period of January 1974 to December 2001 for both types of hog producers (farrow-to-finish producers and feeder pig finishers), annual investment in publicly held value-added agribusinesses and agrifood companies provided benefits over maintaining a portfolio that was solely invested in the hog enterprise. Benefits are extracted from these investments in the form of a greater reward per unit of risk taken, through diversified investments, and by capturing further profits in the food channel as well.
Figure 1 provides a graphical example of the benefits that a hog finishing operation would have obtained from a portfolio that invested in value-added agribusiness stocks. The annual return to the finishing hog operation using historical data from 1974-2001 was 6.27 %, and the standard deviation was 9.44 %. When a constraint was set that at least 70 % of the portfolio must be invested in the hog enterprise, the producer’s optimal portfolio, based on maximizing the reward per unit of risk (the Sharpe ratio), contained a 30 % investment in a single value-added stock. This increased the expected return of the portfolio to 11.28 % and the standard deviation of the portfolio to 15.11 %. These portfolio results are superior to those of investing solely in the hog operation because the producer is receiving more reward per unit for the risk taken. The investment portfolio of a hog producer when it is not limited to sole investment in the hog operation always included the value-added companies because these portfolios provided a higher Sharpe Ratio, i.e., the best return per unit of risk for a given risk free interest rate. The results for the portfolio generated for the farrow-to-finish enterprise are similar to the results for the hog finishing operation: the portfolio contained a 30 % investment in one value-added agribusiness stock, and the producer received more reward per unit of risk taken.
Further analysis of the agribusiness companies revealed that the preferred portfolio consisted of companies that had significant activities beyond the initial processing sector and into the wholesale and retail sectors. This result supports results found by Duval and Featherstone indicating that pork producers may want to invest in companies that have operations that extend into the retailing sector. The model provides evidence that diversification into value-added stocks increases the amount of reward (return) for the level of risk faced by a hog producer relative to that of another producer who only invests in the hog enterprise. Thus, the portfolios that included the value-added agribusiness stocks provided the highest risk-adjusted return for each dollar invested, i.e., these portfolios provided the largest reward to risk tradeoff given the risk-free interest rate available for borrowing and lending.
Analysis of the optimal portfolio using data from various historical data study periods indicates that the advantages of value-added investments have increased over time, i.e., earlier historical periods (1981, 1986) did not obtain the same reward-to-risk benefit from investment in the value-added stocks as the most current study period (2001). In the earlier study periods, producers, given the semi-constrained portfolio, still maintained a majority of investment in the hog operation, but in the most current period, producers moved the maximum allowable investment amount out of the hog operation and invested this amount in the value-added stocks. Investments in agribusiness firms that span the vertical channel from processing to retailing tend to be the preferred stocks in the portfolio. These results may be attributable to the changing structure of the agrifood industry, specifically the continuing trend of more value-added activities occurring beyond the production level. These results suggest that markets are increasingly rewarding value-added activities over commodity production (for example, hog production) activities.
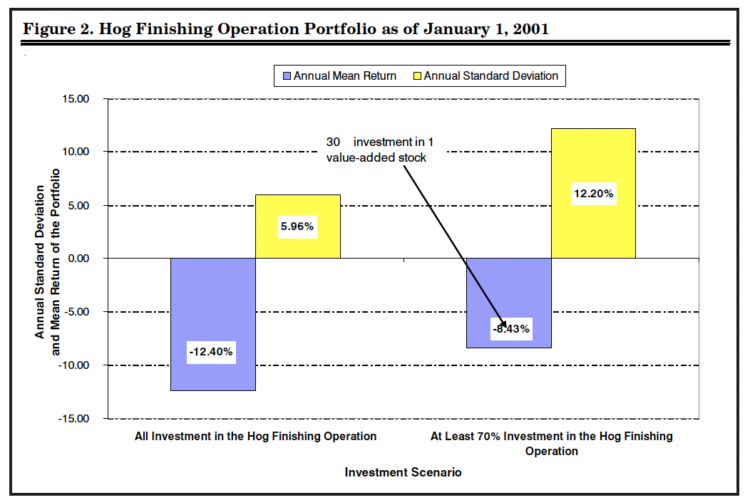
Figure 2. Hog Finishing Operation Portfolio as of January 1, 2001
Additional results indicate that the portfolio as of January 1, 2001 that had sole investment in the hog finishing enterprise had a mean return of -12.40 % and a standard deviation of this annual return of 5.96 % (Figure 2). The constrained portfolio optimization model for this study period contained a 30 %investment in one value-added security. Nevertheless, the addition of this one value-added security still did not generate a positive return for this study period. However, this stock investment increased the expected mean of the portfolio by 4 %, and the portfolio could produce a positive expected return inside of one standard deviation from the mean, something that could not be done within two standard deviations of the mean by investing only in the hog finishing operation.
Conclusion
The research reported here is a first attempt at developing a portfolio of value-added investments for pork producers. The results of this study indicate real potential for producers to gain from investing in publicly traded value-added companies; however, there are some limitations to the study. These limitations include: limited future analyses of the constructed portfolio performances (Did these portfolios continue to provide a greater return for the amount of risk for the hog producer?), the exclusion of brokerage costs in trading (both economic and financial components), lending constraints for producers, and the limited number of companies with adequate historical returns data.
It should be recognized that past returns are not always indicative of future returns; two specific examples of this are the hog prices observed in 1998 and the drastic growth period of the overall market in the late 1990s followed by its rapid decline in the later part of 2001 and 2002. Such events may not reoccur in the near future. However, it should be noted that even with such events, the constrained portfolio contained investment in value-added stocks.
The results of the two analyses in the study indicate that a hog producer in either a farrow-to-finish or a strictly hog finishing operation can benefit from investment in value-added stocks. The benefits are an increase in the amount of return per unit of risk for the producer when he/she does not restrict investment solely to the hog enterprise and benefit through diversification and profit capturing in the food channel. Analysis of the optimal portfolio at various historical periods indicates that the advantages of value-added investments have increased over time. This result is consistent with a continuing trend of more of the value-added activities in the agri-food industry occurring at the post-production level. The results also show, consistently, that agribusiness firms that span the vertical channel from processing to retailing tend to be the preferred stocks in the portfolio.
References
Center for Research in Security Prices Database (CRSP), University of Chicago, Chicago,
Illinois. Source of 1974-2001 stock returns.
Detre, Joshua, D., “Investment in Downstream Publicly Traded Firms as a Vertical Integration Strategy to Increase Returns and Reduce Annual Volatility for Pork Producers,” Unpublished M.S. Thesis, Purdue University, Department of Agriculture Economics, (Dec., 2002).
Disclosure Global Access Database, “Current Profile,” Disclosure Global Access Online, Thomson Financial, 16 Aug. 2001.
Duval, Yan and Featherstone, Allen, M., 2002 “Interactivity and Soft Computing Portfolio Management: Should Farmers Own Food and Agribusiness Stocks?,” American Journal of Agriculture Economics, Vol. 84, No. 1, pp. 120-133.
Jones, Brian, R., Fulton, Joan, R., and Dooley, Frank, J. “Hog Producer Investment in Value-Added Agribusiness: Risk and Return Implications,” Selected Paper at the 1999 Annual Meeting of American Agricultural Economics Association.
Lawrence, John D., 2001, Estimated Livestock Returns, Iowa State University [Online], Available: http://www.econ.iastate.edu/faculty/lawrence/ , [August 1, 2001].
Markowitz, Harry, M., 1952, “Portfolio Selection,” The Journal of Finance, Vol. 7, No. 1, pp. 77-91.
Markowitz, Harry, M., 1991, “Foundations of Portfolio Theory,” The Journal of Finance, Vol. 46, No. 2, pp. 469-477.
Sharpe, William F. 1963, “A Simplified Model for Portfolio Analysis,” Management Science, Vol. 9, No. 2, pp. 277-293.
Sharpe, William F. 1964, “Capital Asset Prices: A Theory of Market Equilibrium Under Conditions of Risk,” The Journal of Finance, Vol. 19, No. 3, pp. 425-442.
Sharpe, William F. 1966, “Mutual Fund Performance,” Journal of Business, Supplement on Security Prices, Vol. 39, No. 1, Part 2, pp. 119-138.
U.S. Census Bureau, 2001, “1997 Economic Census,” U.S. Census Bureau [Online], Available: http://www.census.gov/epcd/www/econ97.html, [August 1, 2001].
![]()
![]()
![]()
![]()
![]()
