Key Takeaways from “Commitment Behaviour in the World Trade Organization’s Trade Facilitation Agreement” by Hillberry and Zurita (2022)
April 26, 2022
PAER-2022-21
Carlos Zurita, Doctoral Candidate
![]()
![]()
![]()
![]()
![]()
The World Trade Organization’s (WTO) most recent agreement, the Trade Facilitation Agreement (TFA), entered into force in 2017. The purpose of the TFA is to simplify, modernize and harmonize rules and procedures that affect the movement of goods across international borders (WTO, 2022a). Among the measures are regulations on the controls and inspections of imported goods. This particularly affects imports of agricultural perishable food products and feedstuff, given that they may require laboratory testing for food safety or agriculture; and an efficient customs clearance and release. A novelty of the TFA is that it allows developing country members to choose a subset of the total package of commitments that they are prepared to implement, and defer commitments on other measures until their governments are capable of successful implementation. The purpose of this article is to review the findings of Hillberry and Zurita (2022), which studies variation in countries’ commitment behavior in the agreement.[1]
The agreement contains a total of 238 commitments and countries were able to commit to implementing a subset of the measures. Countries with more commitments are likely to have more efficient customs. As of today, the TFA has a global implementation rate of 74.8% (WTO, 2022b). Developed country members are presumed to have implemented all measures and may assist developing country members in capacity building to reach full implementation of the TFA (WTO, 2021). A first part of the analysis in Hillberry and Zurita (2022) asks how many measures countries committed to and which measures were they. To do so, they group commitments into 36 areas of regulation defined by the TFA Facility published by the WTO (2021). Among developing countries, some areas have implementation rates that are above 80%, while other areas have an implementation rates that are less than 35%. The areas with the highest implementation rates are those that require simple regulatory changes. An example of such areas is Pre-Shipment Inspection, which asks a country member to end revising tariff classifications in pre-shipment inspections. On the other hand, the areas with the lowest implementation rates, such as Single Windows require more resources, like IT infrastructure, and more coordination between government agencies. A single window allows a trading firm to interact with customs and all other border agencies through a single electronic portal.
A second part of the analysis in Hillberry and Zurita (2022) relates the number of commitments made to country characteristics such as countries’ income level, population size, and aid-for-trade funds received. Figure 1 shows the relationship between the number of commitments made and per capita income (Gross Domestic Product [GDP] per capita), where each point represents a member country. The figure reveals a positive relationship between the two variables, meaning that higher income countries made more commitments. A statistical model of these data shows that, in a typical country, doubling income per capita implies 36 more commitments (Hillberry and Zurita, 2022). Additionally, countries with larger populations make more commitments, compared to other countries with similar levels of income. Moreover, increasing one dollar of per capita aid for trade facilitation translates to four additional commitments.
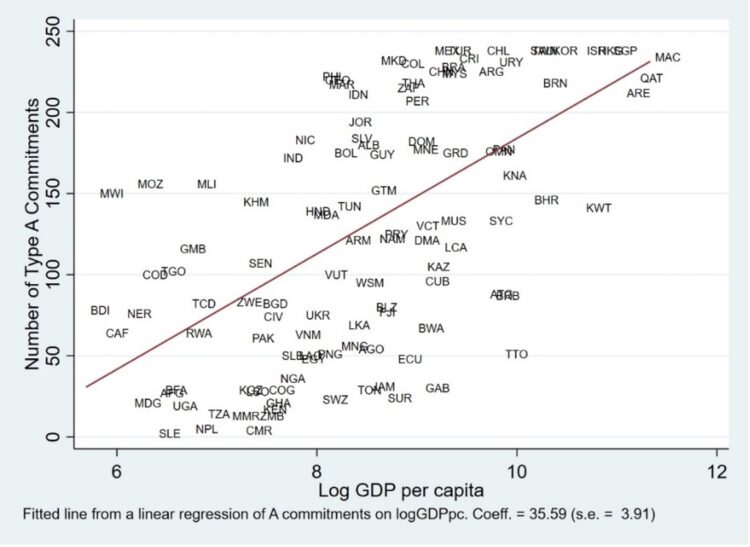
Figure 1. Number of type A commitments vs. log-GDP per capita
Source: Hillberry and Zurita (forthcoming)
A third part of the analysis attempts to explore variation in the kinds of commitments made, which is potentially different than variation in the number of commitments made. It could be, for example, that island countries face similar logistical challenges, and so make a subset of commitments with similar contents. Hillberry and Zurita’s (2022) results indicate, however, that differences in the content of the commitments depend mostly upon the number of commitments made. In this sense, the TFA measures could be understood as a hierarchy. Developing countries with low trade facilitation capacity implement those commitments that are widely adopted; while countries with higher trade facilitation capacities make those commitments that are perceived as the most challenging to implement.
References
Beckman, Jayson. 2021. Reforming Market Access in Agricultural Trade: Tariff Removal and the Trade Facilitation Agreement, ERR 280, April 2021. U.S. Department of Agriculture, Economic Research Service.
Hillberry, R., & Zurita, C. (2022). Commitment Behaviour in the World Trade Organization trade facilitation agreement. The World Economy, 45(1), 36– 75. https://doi.org/10.1111/twec.13165
World Trade Organization (2015). Implementing the Trade Facilitation Agreement. In OECD/WTO, Aid for Trade at a Glance 2015: Reducing Trade Costs for Inclusive, Sustainable Growth (pp. 109 – 132). WTO, Geneva/OECD Publishing, Paris, https://doi.org/10.1787/aid_glance-2015-en
World Trade Organization (2021). Trade Facilitation Agreement Facility. https://www.tfafacility.org/
World Trade Organization (2022a). Trade Facilitation. https://www.wto.org/
World Trade Organization (2022b). Trade Facilitation Agreement Database. https://www.tfadatabase.org/
[1] They focus on the so-called Type A commitments, which are those which countries agreed to have in place within one year of the entry-into-force of the TFA. The commitments that a country was not prepared to implement upon ratification of the TFA, are listed as Type B or Type C commitments.
![]()
![]()
![]()
![]()
![]()