1997 Land Values Rise Again
August 1, 1997
PAER-1997-01
H. Atkinson, Professor; Alan Miller, Farm Business Management Specialist; and Kim Cook, Research Associate
![]()
![]()
![]()
![]()
![]()
The Purdue Land Values survey, conducted annually for over 20 years, indicates that the value of an acre of an acre of average Indiana cropland was right at $2000 per acre in June 1997, only$100 short of the all-time peak reached in 1981. In each of the past four years, the value of this land has increased from about $100 to over $200 per acre, resulting in an increase of 53% for the period. Cash rents rose from 1996 to 1997 on aver-age land by about 5.3%, to $110 or $4 more per acre than in the peak year of 1981. The increase for the past four years has been 24%.
Statewide Land Values
For the six months ending in June 1997, the value of bare tillable land was reported to have increased 5.0%on top land, 4.9% on average land and 4.8% on poor land (Table 1). Most respondents, 68%, reported that some or all classes of land went up from December 1996 to June 1997, down from 78% last year. Only 3.9% of the respondents indicated that some or all classes of land fell in value during that same six month period as compared to 2.1% of the survey respondents the previous year.
The statewide 12 month increase in average value from June 1996 to June 1997 was 13.1% (Table 1). Top quality land (149 bushel corn yield rating) was estimated to have increased by $275 per acre to $2549 (Table 1). Average land (122 bushel corn yield rating) was valued at
$1997 (up $232), while poor land (94 bushel corn yield rating) was esti-mated to be worth $1493 per acre, up 14.6% for the year. All three classes of land values were within 5% or less of their 1981 peak.
The land value per bushel of corn yield rating also increased substantially. For top quality land, value per bushel of yield was $17.05, up by 11.7%. Average quality land value was $16.36 per bushel, while the poor quality value was $15.83 per bushel (Table 1). The percentage increases were 12% on average land and 13% on poor land. These per-bushel figures are $1.79 higher than last year on top land, $1.77 higher on average land, and $1.82 higher on poor land.
The value of transition land moving into non-farm uses increased 5.8% in the 6-month period ending in June to $5764 per acre. On a year-to-year basis, the averages show a 29.9% increase (Table 1); however, due to the wide variation in estimates (from $1500 to $33,000 in June 1997), the median value may give a more meaningful picture than the arithmetic average. The median increased from $4000 in June 1996 to $5000 in June 1997. There was no change in the median from December 1996, to June 1997. The median value of individual home sites up to 5 acres was $5000 per acre, up from$4000 last year, and sites of 10 acres or more suitable for residential sub-divisions were valued at $4000 per acre, the same as last year.
Statewide Rents
Cash rents increased statewide from 1996 to 1997 by $6 per acre on top and average land, and $4 per acre on poor land (Table 2). The estimated cash rent on average land was $110 per acre, $135 on top land, and $84 on poor land. Rent per bushel of estimated corn yield was $.91 on top land, $.90 on average land, and $.89 on poor land, up three to four cents from last year. Cash rent on top land in 1997 was below the record 1981 level of $137 per acre, while rents on average and poor land were a few dollars above.
Statewide, cash rent as a percentage of estimated land value declined for the sixth consecutive year to around 5.5% (Table 2). Greater increases in land values than in cash rents caused these declines, but the percentages statewide are still higher than the 5% levels of 1978-81.
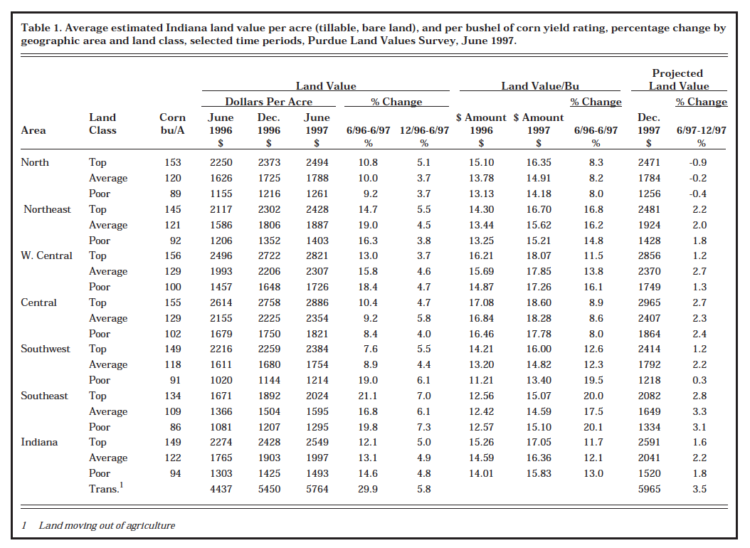
Table 1. Average estimated Indiana land value per acre (tillable, bare land) and per bushel of corn yield rating, percentage change by geographic area and land class, selected time periods, Purdue Land Values Survey, June 1997
Area Land Values
Increases in the value of farmland in the six different geographic areas of Indiana (Figure 1) from December 1996 to June 1997, ranged from 3.7%to 7.3% (Table 1). Areas that reported greater percentage increases for poor land than for top land were the west central, south-west and southeast areas.
For the year ending in June 1997 the greatest increase in top or aver-age farmland was again in the south-east (21.1% on top land) followed by a 19% increase on average land in the northeast and 16 to 17%increases on average land in west central and southeast Indiana (Table 1). Other increases on top and average land ranged from 7.6% to 14.7%. Poor land value increases by area ranged from 8.4% in the central area to 19.8% in the southeast. In several areas, one or more classes of land have approached or exceeded the record levels of 1980-81.
The highest valued top quality land was again in the west central and central areas, around $2800 to$2900 per acre. The next highest values were in the north ($2494), northeast ($2428) and the southwest ($2384). Reported values for average quality land were $2354 in the central and $2307 in the west central areas but only around $1600 to $1900 in the other areas. Part of these area differences in values between land in the same productivity class are associated with differences in respondents’ estimates of corn yield ratings. For example, average land in the southeast had a corn yield rating of 109 bushels per acre and in the north, 120 bushels; however, the land values per bushel of corn yield estimates were about the same in both areas.
Land values per bushel of estimated average corn yield (land value divided by bushels) on top land were in the range of $16.00 to $16.70 in the north, northeast and southwest areas (Table 1), $18.07 in the west central area, $18.60 in central Indi-ana, and $15.07 in the southeast. Land values per bushel declined as land quality (corn yield estimates) declined in all areas except the Southeast. These per bushel values have been increasing since 1987, but are much lower than in 1981 when the per bushel estimate for average land in central Indiana was $21.50. This figure dropped to about $9.50 in 1987 and currently is $18.28.
Respondents were asked to estimate rural home sites with no accessible gas line or city utilities and located on a black top or well maintained gravel road. The median values per acre of both small (5 acres or less) and large (10 acres or more) home sites in the west central area was $5000, up from $4000 in 1996. Increases also occurred on small tracts in the north, northeast and southwest where the 1997 estimates ranged from $5000 (north) to $4250 (northeast and southwest). The $4000 estimate in the southeast was the same as last year. Estimated per acre values of the larger tracts ranged from $4250 to $5000 except for the $3500 estimate in the southeast.
The median values for home sites under 5 acres and 10 acres or more in 1996 and 1997 are found in Table 3.
Area Cash Rents
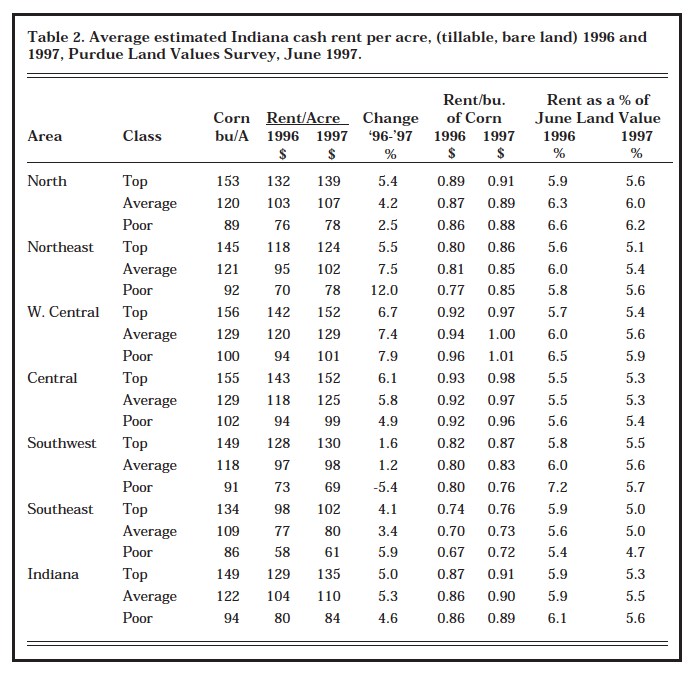
Table 2. Average estimated Indiana cash rent per acre, (tillable, bare land) 1996 and 1997, Purdue Land Values Survey, June 1997
Cash rents for top land increased by$10 per acre in the west central area,$9 in central Indiana and $2 to $7 in the other areas. Cash rents increased in all areas and for all three productivity classes except for poor land in the southwest. Increases for average and poor land ranged from minus $4 to $9 (Table 2). The highest percentage increase was for poor land in the northeast (12%).
Cash rents were again highest in the west central and central areas at$152 per acre for top land, and $129 and $125 per acre, respectively, for average land. Cash rents of around$1.00 per bushel were also highest in these areas. The per-bushel rent for top land was 91¢ in the north, 87¢ in the southwest, 86¢ in the northeast, and 76¢ in the southeast. In all areas except the southwest, rates per bushel within areas varied by 4¢ or less by land quality.
Cash rent as a percentage of land value declined again for all land classes in all areas.
This rate on top and average land was in the range of 5.0% to 6.0% in all areas.
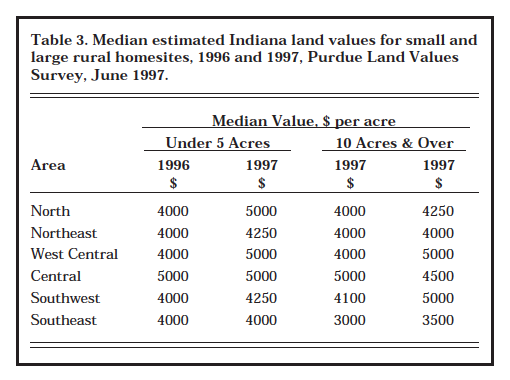
Table 3. Median estimated Indiana land values for small and large rural homesites, 1996 and 1997, Purdue Land Values Survey, June 1997
Respondentsʼ Outlook
Respondents are less optimistic about further price increases by year-end. Last year, 79% of the survey respondents expected some or all classes of land to increase, but that figure dropped to 54% this year. Only 6% of the respondents expect a decline in values and 38% expect no change, up from 28% last year.
Respondents were also asked about their expectation of land value changes over the next 6 months. Small decreases were expected in the northeast. Expected land value increases in other areas were mostly under 3% for the 6 months ending in December (Table 1). These projections in the past have been in the right direction but have not been a good indicator of the actual magnitude of change.
When asked about their longer-run expectations over the next 5 years, about 80% of the respondents predicted that land values would increase. The remaining 20% were about equally divided between expecting a decline or no change. On average they expected a modest increase of 10% for the 5 years, which was one percentage point higher than last year’s projection.
Respondents were asked to estimate annual average prices over the next five years for corn and soy-beans, the farm mortgage interest rate, and the rate of inflation. The projections they have made since 1984 are shown in Table 4.
This is the sixth consecutive year that expected farm mortgage interest rates have remained under 10% and inflation under 4%. A 29¢ decrease occurred in the expected price of corn but the $2.72 per bushel estimate is still the second highest since 1985. The increase of 18¢ in the soybean price estimate would only partially offset the decline in corn price. Gross revenue expectations for 125 bushel corn yields and 45 bushel beans in a 50-50 rotation would decline $14 per acre from last year. To the extent that land market participants have similar reduced expectations, this relatively small reduction in revenue expectations could exert downward pressure on land values. Combined with other factors like an increase in land on the market in response to lower capital gains tax and reduced transition payments, a leveling off or decline in land values might occur.
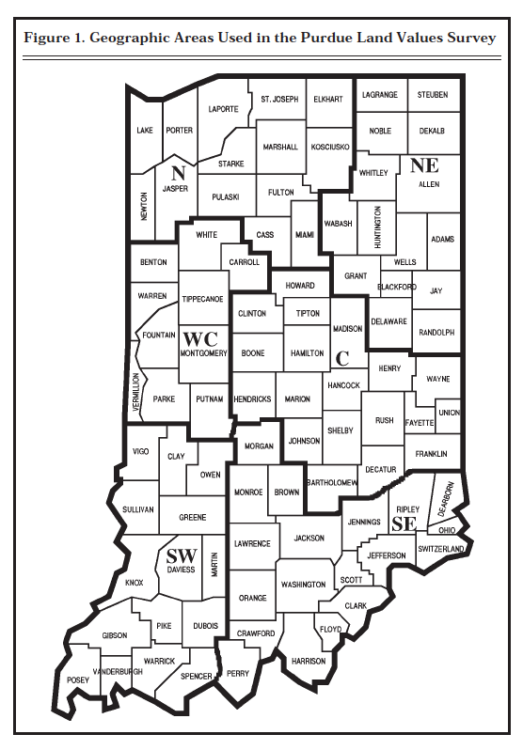
Figure 1. Geographic Areas Used in Purdue Land Values Survey
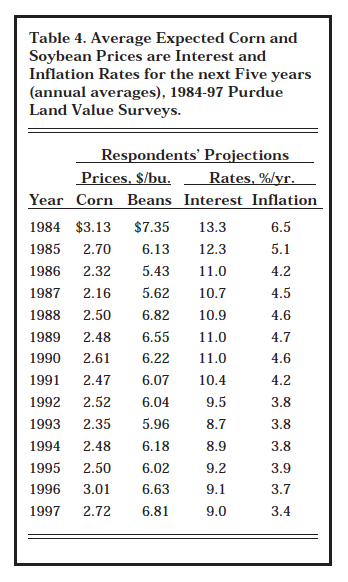
Table 4. Average Expected Corn and Soybean Prices are Interest and Inflation Rates for next Five years (annual averages), 1984-97 Purdue Land Values Surveys
Land Market Activity
The number of farmland transfers in the 6 months ending in June com-pared to a year earlier was estimated to be up by 30% of the respondents versus 34% last year. About half of the respondents thought there had been no change in the number of transfers. More land was thought to be on the market now by only 12% of the respondents versus 16% a year ago.
Land Value/Cash Rent Multiples
The fact that average Indiana farm-land values surged again in the year ending in June 1997 and have increased about 53% over the past 4 years gives rise to the question, “Are land values too high?” But viewed alone, the fact that land values have risen rapidly is not sufficient justification to suggest that they are too high – returns to land investment must also be considered. Over the past 4 years, cash rents (a measure of returns) have increased less than half of the percentage increase in land values and in 1997 were under 6% of land values. Stock market analysts often refer to the “price/earnings ratio.” In a similar way, a land value/cash rent multiple can be calculated. For example, data from USDA and Purdue indicate a value/rent multiple of $18.3 ($1997/110 = $18.3) of land value per$1 of cash rent for 1997. Is this figure abnormally high, thus suggesting that land values are too high? To answer this question we need to have an estimate of what is “normal.”
Based on USDA and Purdue data, the value/rent multiple moved in the narrow range of 12.8 to 14.7 for the 16 year period ending in 1975. Rents and land values both rose by about the same percentage during this period. From 1975 to 1979, the multiple increased rapidly to more than 20.0 (Figure 2). Land values rose rapidly while cash rent lagged behind (Figure 3).
The value/rent multiple peaked in 1979 two years ahead of the peak in land values and in cash rental rates. Then came the crash in land values – a decline of over 50% from 1981 to 1987. Cash rents declined by less than half this amount. The land value/rent multiple bottomed in 1986, one year ahead of the bottoms for land values and cash rents. Now the multiple is 18.3 – the highest level since 1982. Since 1960, the land value/rent multiple has exceeded 18.3 in only 4 years (1978-1981).
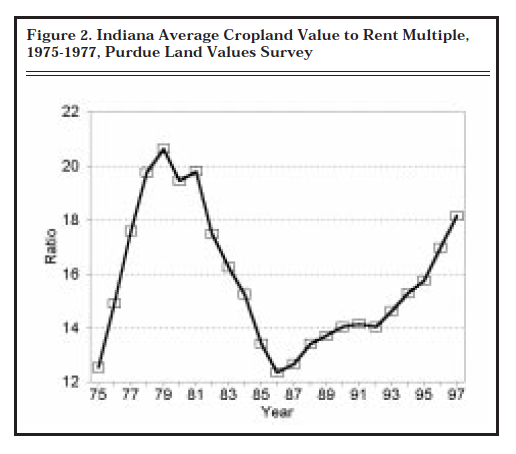
Figure 2. Indiana Average Cropland Value to Rent Multiple, 1975-1977, Purdue Land Values Survey
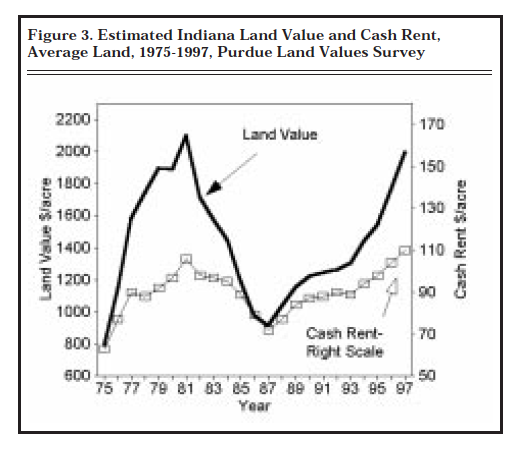
Figure 3. Estimated Indiana Land Value and Cash Rent, Average Land, 1975-1997, Purdue Land Values Survey
High hopes of continued large grain exports to China have been dimmed, government transition payments will decline in 1998 and the following 4 years, then be discontinued, and $5 corn is only a dream (a bad one for hog farmers!). A decline in farm profits, perhaps next year, would not be surprising. Could this trigger a down-trend in land values which might continue for several years? If so, and if land values declined faster percentage-wise than cash rents, the value/rent multiple would decline toward more “normal” levels. While making a firm prediction of a decline in land values and the multiple based on this analysis may not be justified, it does suggest that more caution than in the past be used in land purchases.
**********
The land values survey was made possible by the cooperation of professional farm managers, appraisers, brokers, bankers, county extension educators, and persons representing the Farm Credit System, the Farm Service Agency (FSA) county offices, and insurance companies. Their daily work requires that they stay well-informed about land values and cash rents in Indiana. The authors express sincere thanks to these friend of Purdue and Indiana agriculture. They provided 350 responses representing most of Indiana’s counties. We also express appreciation to Sandy Dottle of the Department of Agricultural Economics for her help in conducting the survey and to Professor Chris Hurt for his review of this report and helpful suggestions.
![]()
![]()
![]()
![]()
![]()
