NCR-Stat: Generational Gap in Rural North Central Region
January 16, 2024
PAER-2024-05
Zuzana Bednarik, Research and Extension Specialist, North Central Regional Center for Rural Development; and Maria I. Marshall, Jim and Lois Ackerman Professor of Agricultural Economics
We’ve heard a lot about GenZ being the most diverse generation (Pew Research Center, 2018). There has also been more discussion about the generational gaps in subjective well-being, social inclusion, and trust in institutions. The North Central Regional Center for Rural Development’s (NCRCRD) NCR-Stat: Baseline survey data concur with these national trends.
A generation gap refers to differences between generations in terms of their attitude, beliefs, actions, behaviors, or perspectives (Soni and Ashish, 2016). The differences across generations as demographic groups matter because their position in the life cycle shapes their views of the world. The members of particular age groups can express different opinions on most aspects of their lives, including social and economic equality, politics, social justice, technology, access to information, mental health, or trust.
We used the Pew Research Center’s generational categories to learn about generation gaps in the North Central Region (NCR): GenZ, Millennials, GenX, Boomers, and Silent Generation (Pew Research Center, 2019). We also looked at what the different generations thought about their communities and their trusted sources, specifically community equity and belonging, trust in institutions, life satisfaction, and mental health.
The NCRCRD collects data to understand the challenges facing rural and urban communities within the NCR. Data are collected across households and focus on demographics, economics, health, housing, community development, and social behavior. NCR-Stat: Baseline Survey (Bednarikova et al., 2022) includes data collected on 4,668 households for the 121 states in the NCR. Although the NCRCRD surveys households in rural and urban areas, we concentrate only on the rural respondents in this article.
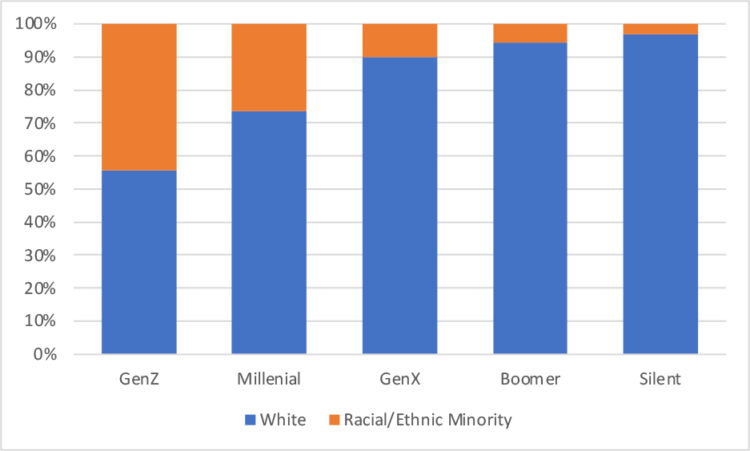
Overall, 16% of the respondents identified as either a racial or ethnic minority and 12% stated they were in multiracial or multiethnic households. Only 6% of white respondents were in multiracial/ethnic households compared to 46% of racial/ethnic minority respondents. Figure 1 shows the racial diversity across generations and demonstrates how each subsequent generation has become more diverse. In fact, 44% of GenZers are identified as a racial/ethnic minority compared to 5% of Boomers and 3% of the Silent Generation.
Community belonging and security
Younger generations (GenZ and Millennials) agreed at a higher rate than older generations with the statement that their local rural community made all residents feel welcome (Figure 2). However, only 45% of rural GenZ respondents reported that their community provided a safe and secure environment for residents of all backgrounds. It is a disconcerting result, especially compared to responses of older generations that felt otherwise (Figure 3).
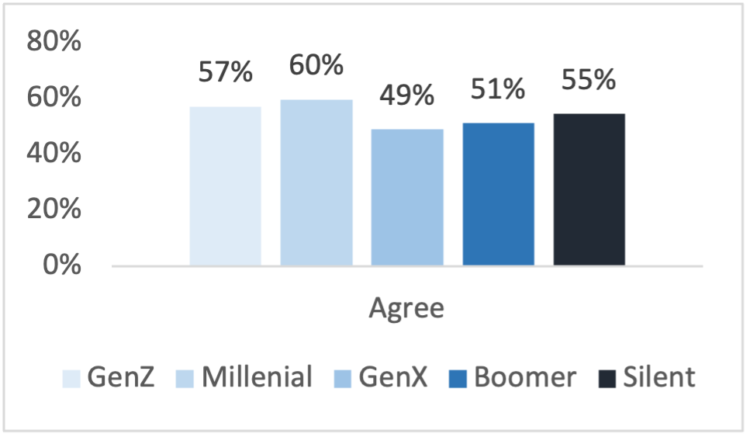
Figure 2. Community belonging
Source: Bednarikova et al. (2022). NCR-Stat: Baseline Survey
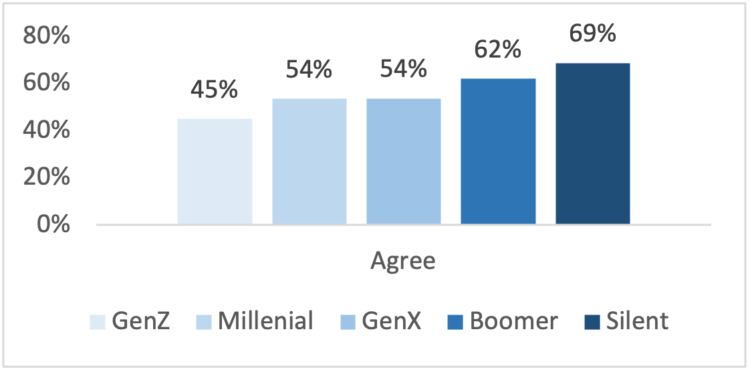
Figure 3. Community is safe and secure for all
Source: Bednarikova et al. (2022). NCR-Stat: Baseline Survey
Trust in local institutions
We measured trust in local institutions by asking how much the respondents trusted their local government and police. Only 19% of GenZ members trusted their local government compared to 58% of Silent Generation (Figure 4). About one-third of GenZ trusted their local police, which is again the lowest share among the generations, as each older generation reported higher trust in the local police (Figure 5). The results regarding the younger generation’s mistrust concur with national trends (Harvard Youth Poll, 2023)
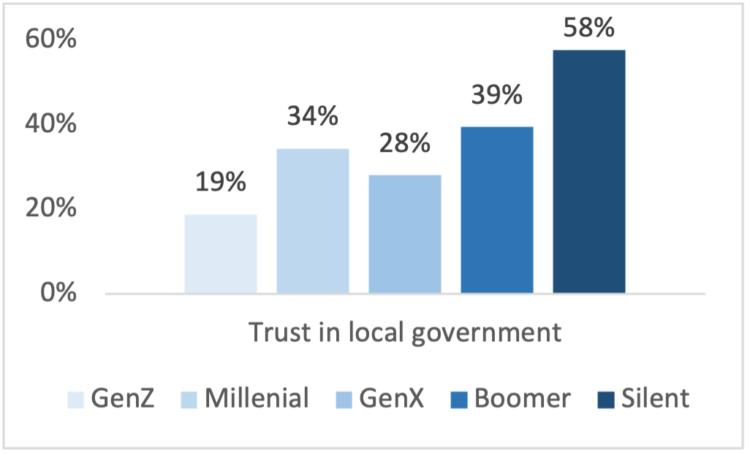
Figure 4. Trust in local government
Source: Bednarikova et al. (2022). NCR-Stat: Baseline Survey
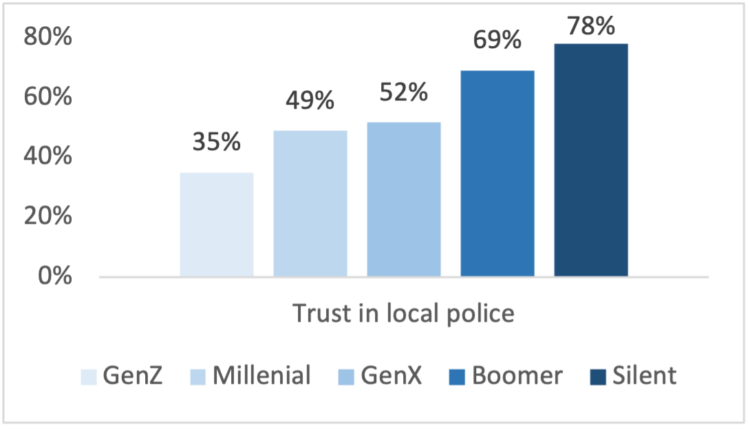
Figure 5. Trust in local police
Source: Bednarikova et al. (2022). NCR-Stat: Baseline Survey
Life Satisfaction
In the NCR-Stat: Baseline Survey, we asked respondents how satisfied they felt at the time of the survey. We used a Likert scale to measure self-reported life satisfaction, with 0 representing “not at all satisfied” and 10 as “extremely satisfied.” The value of 5 is considered the midpoint, meaning “neither unhappy nor happy.” The rural Silent Generation was clearly the most satisfied with their lives among all generations, followed by the Boomers (7.9 and 7.2, respectively). On the contrary, GenZ reported the lowest level of life satisfaction (6.3) (Figure 6). This result suggests the existence of various factors that may influence the life satisfaction of the younger generations but may not necessarily be a concern for older generations.
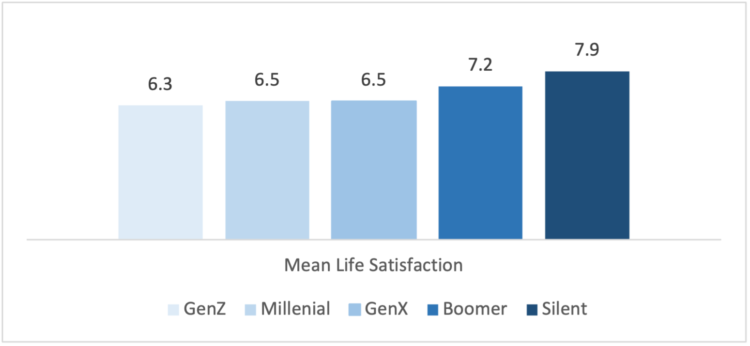
Figure 6. Mean life satisfaction by generation
Source: Bednarikova et al. (2022). NCR-Stat: Baseline Survey
Mental health
Mental health includes our psychological, emotional, and social well-being. Mental health is important in every stage of life as it affects our everyday living – how we feel, think, and act. It also helps determine how we relate to others, make choices, and handle stress. Figure 7 shows that younger adults – GenZ and Millennials tend more often than other generations to feel down, depressed, or hopeless. This trend reflects the national situation, showing that people between the ages of 18 and 44 reported the highest share of those living with symptoms of depression and anxiety (U.S. Census Bureau, 2021).
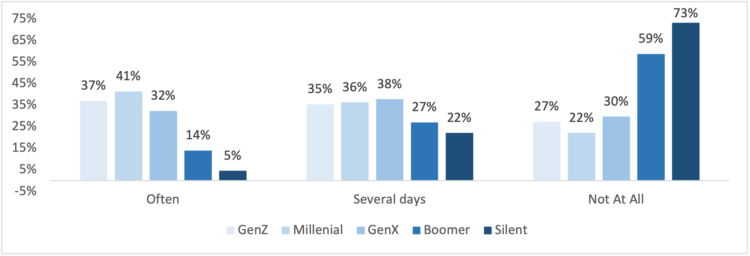
Figure 7. Frequency of feeling down, depressed, or hopeless by generation
Source: Bednarikova et al. (2022). NCR-Stat: Baseline Survey
Summary
Rural communities across the NCR are seeing the same demographic changes as the rest of the nation. The GenZ and Millenial generations are the most diverse. While younger generations feel more community belonging that older generations, they do not feel that their communities provide a safe and secure environment for all residents. Our data show that rural communities in the NCR are suffering from the same trust and mental health challenges as others across the country. The Boomer and Silent generation feel more life satisfaction than other generations. However, younger generations seem to be feeling disconnected and distrustful of institutions. The national mental health crisis is also affecting rural communities and in particular GenZ and Millenials.
References
Bednarikova, Z., Marshall, M. I., Wiatt, R. D., Wilcox, Jr, M. D. (2022). North Central Region
Household Data (NCR-Stat): Baseline Survey. Purdue University Research Repository. Available at https://purr.purdue.edu/publications/4156/1
Harvard Youth Poll (2023). The Spring 2023 Harvard Youth Poll. Harvard Kennedy School. Institute of Politics. Available at https://iop.harvard.edu/youth-poll/45th-edition-spring-2023
Pew Research Center (2018). Early Benchmarks Show ‘Post-Millennials’ on Track to Be Most Diverse, Best-Educated Generation Yet. Available at
https://www.pewresearch.org/social-trends/2018/11/15/early-benchmarks-show-post-millennials-on-track-to-be-most-diverse-best-educated-generation-yet/
Pew Research Center (2019). Defining generations: Where Millennials end and Generation Z begins. Available at
https://www.pewresearch.org/short-reads/2019/01/17/where-millennials-end-and-generation-z-begins/
Soni, H. and Ashish, A. (2016). Understanding Generation Gap at Work Place. IOSR Journal of Business and Management, 18(1): 56-58.
U.S. Census Bureau (2021). Living Alone Has More Impact on Mental Health of Young Adults Than Older Adults. Available at https://www.census.gov/library/stories/2021/01/young-adults-living-alone-report-anxiety-depression-during-pandemic.html?utm_campaign=20210113msacos1ccstors&utm_medium=email&utm_source=govdelivery
1 The 12 states include: IA, IN, IL, KS, MI, MO, MN, ND, NE, OH, SD, and WI.
