The Dairy Marketplace: Reflections on 2020 and factors to watch in 2021
December 9, 2020
PAER-2020-23
Author: Nicole Olynk-Widmar, Professor of Agricultural Economics
![]()
![]()
![]()
![]()
![]()
Dairy markets, like many agricultural markets, have experienced significant volatility due to the COVID-19 pandemic, in addition to more ‘benign’ supply and demand factors. Typically, in November we are in the midst of watching holiday baking take off, and along with it, U.S. butter usage and home consumption. More broadly end of year market summaries typically cover factors such as cow numbers, milk production per cow, and seasonal versus atypical consumption and/or buying patterns. However, in 2020 the cascading series of events beginning with the U.S. societal impacts of COVID-19 in March and April of 2020 dominate most food market discussions.
Fundamental Dairy Industry Metrics
Forecasted total milk production for 2020 has been moving upward, with some expectations of more cows in the fourth quarter combined with higher milk per head. Presently USDA, ERS has 2020 total milk production forecasted at 222.5 billion pounds, which is a 0.2 billion pound increase over their October forecast. Increased milk production itself would place downward pressure on prices, but taken with recent demand signals, there is some room for cautious optimism. U.S. dairy prices are competitive presently on the global market; we’re expecting higher exports of cheese, butterfat, and dry skim milk products. While U.S. butter prices have been the focus of attention for multiple years, they have lowered considerably and presently even U.S. butter prices are competitive on the World market.
Per the November 2020 Livestock, Dairy, and Poultry Outlook from USDA, ERS the 2020 all-milk forecast has been raised by $0.25 to $18.25 per cwt; embedded in that expectation is the fourth quarter significant increase by $0.85 to $19.75 per cwt. The overall 2020 milk price doesn’t look bad, but the path to getting here has been anything but stable. Figure 1 displays the U.S. All Milk Price on a monthly basis, with the severity of the impacts of the rapid market adjustments in mid to late March being evident in the rapid falling of prices into April and bottoming out in May, before rebounding rapidly during the summer months.
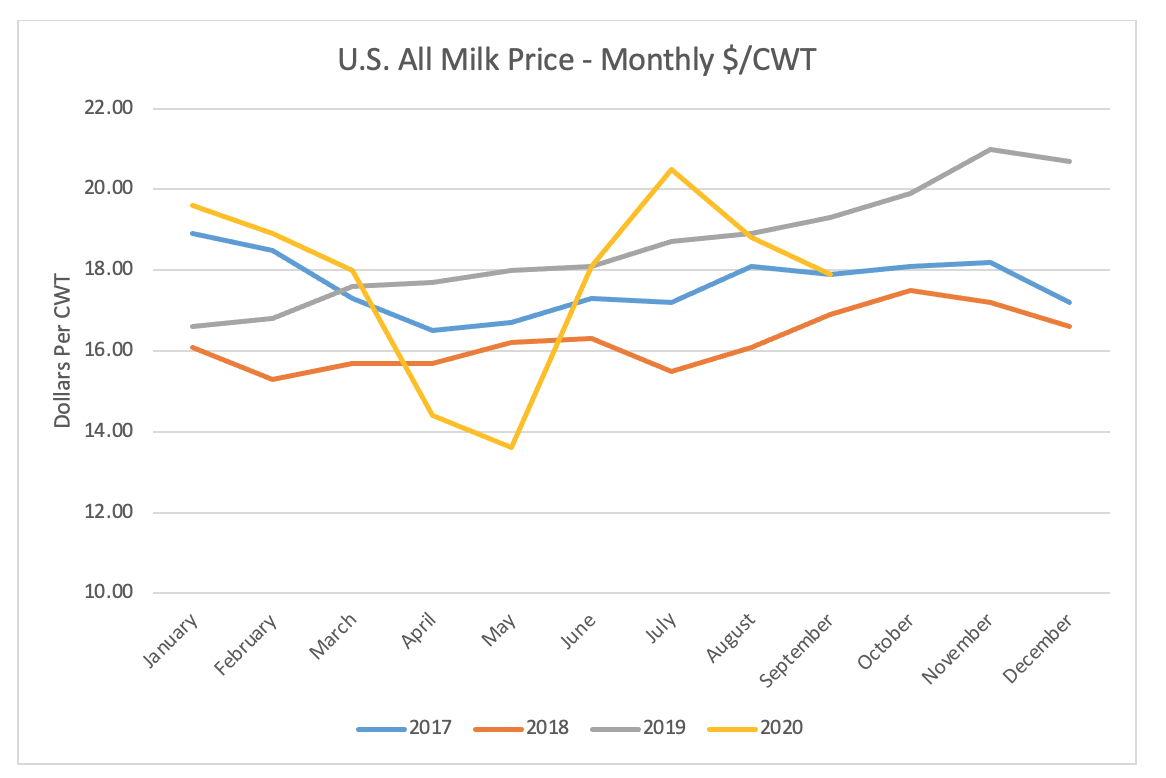
Figure 1. All Milk Price (Monthly; 2017-2020).
Data: All milk, fluid, and manufacturing milk prices from NASS Ag Prices monthly. Link is http://usda.mannlib.cornell.edu/reports/nassr/price/pap-bb/
COVID-19 Adjustments: Reflections and Lingering Questions
The sudden transition to ‘stay at home’ in mid-March 2020 led to significant changes in shopping for food at home versus away from home, which impacted every food sector in the nation and most around the World. For dairy markets, however, there was the confounding issue of movement of children home from schools. Fluid milk in schools is a significant market; one can visually see consumption of fluid milk and a variety of dairy products move in synch with the school year. Fluid milk consumption declines reported currently are attributed at least in part to lowered school attendance during the pandemic.
Basically overnight the demand for milk in schools fell (to near zero) leaving raw milk without a home for processing, and fueling national media stories on milk dumping. While there was public outrage evident and the actual scale of milk dumping was drastically higher than usual, missing from much of the reporting was the relative localization of massive increases in dumping to the Northeast (and then Southeast, in that order).[1] Adding to the sting of dumped milk and (at the time) milk prices dropping rapidly, were the images of empty supermarket dairy displays as shoppers sought but could not find fluid milk. Undoubtedly dairy producers and the dairy industry faced some dark times in March-May 2020, as did many industries and societies grappling with COVID-19.
Certainly, nobody wants to see milk dumped; there is an emotional response to seeing what we recognize as a wholesome, complete, food, often in the context of infants and children, wasted. However, what was largely missing from media coverage was the resilience shown by the milk supply and processing chain in the recovery/adjustments that followed. Considering the scale and speed of the adjustments necessary, the industry response was impressive. The duration when milk processing was unavailable for raw product was reasonably short-lived as the U.S. dairy industry worked to redirect product for processing, which includes a ‘heavy lift’ in terms of logistics of a perishable product requiring refrigeration combined with processing capacity and packaging availability. There was a brief period of time during which retail supermarkets struggled to keep fluid milk stocked on shelves as U.S. households moved home and stocked up on staple products. The transition to supplying more fluid milk for home consumption and less to restaurant and food service (including schools) was rapid and the supply chain showed resiliency, although admittedly not without some short-term adjustment pain.
Dairy consumption at home is simply different than in restaurants or food-service establishments for most U.S. consumers. Consumption of butter and cheeses are of particular interest in the food at home versus away from home discussion. Bread baskets with butter, cream and butter based sauces, and inclusion of items like cheeses and sour cream in dishes all tend to be more common in restaurant dishes or other ‘splurge’ type meals than every day at-home meals. In a special report on eating out expenditures during COVID-19 by USDA, ERS it was reported that, “In April and May 2020, food-away-from-home spending was down 50.8 and 37.2 percent, respectively, when compared to the same months one year ago.” Certainly the shift away from restaurant meals has changed how U.S. consumers eat. Butter stocks remain reasonably high presently, placing downward pressure on butter prices. Pizza is one of the biggest uses of mozzarella cheese in the U.S. marketplace, which is an interesting food category during the pandemic as it remained reasonably in-demand as a take-out item, even as households continue to stay at home and many continue to avoid in-person dining, even when it is available. Contrary to trends for a variety of cheese products, American-type cheeses have experienced an increase in demand during the COVID-19 era. Increased demand for American-type cheeses is fueled by at-home cooking and consumption, largely believed to be in conjunction with preparation of common comfort food items, such as macaroni and cheese.
Looking Forward to 2021
USDA, ERS has released forecasted milk per cow for 2021 up 20 pounds (to 24,090 per cow) alongside a 10,000 head increase (to bring the national herd to 9.380 million head). While milk production is expected to be up in 2021, the many unknowns facing grain markets lead to questions about feed costs. Expectations of higher feed costs would place downward pressure on milk production growth, although there remains significant uncertainty surrounding costs of production and/or size of 2020 crops available for feed.[2] As of the November 2020 Livestock, Dairy, and Poultry Outlook from USDA, ERS the 2021 all-milk price forecast for 2021 had been raised to $17.70 per cwt, which was a $0.10 increase over the forecast a month earlier. All milk forecasts are the product of a variety of factors including Class I, II, III, IV milk prices, forecasted demand for dairy products domestically, dairy product in cold storage/stockpiles, and trade expectations.
[1] For in-depth coverage of dumping in terms of % of production and by order/region, see https://agmoos.com/2020/06/20/northeast-bore-brunt-of-huge-milk-dumping-in-april/.
[2] While milk price expectations have been bumping upward in recent forecasts, the cost of production is another key factor on producers minds as one looks ahead to their expected 2021 margins. Assistance in visualizing forecasted margins, taking into account expected milk prices and key input costs, such as feed, can provide useful insight for decision making purposes. See Dairy Margin Coverage Decision Tool for example visualization and the ability to conduct historical analyses.
![]()
![]()
![]()
![]()
![]()