Weak Ag Trade Outlook for 2017
December 12, 2016
PAER-2016-13
Philip Abbott, Professor of Agricultural Economics
![]()
![]()
![]()
![]()
![]()
First, a look at the numbers. After setting records in fiscal years 2013 and then 2014, reaching $152.3 billion, U.S. agricultural exports fell to $139.7 billion in 2015. They are estimated to fall further, to $129.7 billion in fiscal 2016 and are projected to recover somewhat to $134 billion in 2017 according to USDA’s latest (November 2016) trade outlook.
Grain and feed exports led the downward movement by falling $4.7 billion from 2014 to 2015, declined by another $2.0 billion to 2016, and are projected to remain flat at $29.6 billion in 2017. Oilseed exports fell $3.2 billion from 2014 to 2015, fell by $1.2 billion from 2015 to 2016, and are projected to recover by only $1.5 billion in 2017, reaching $31 billion. Livestock, dairy and poultry exports fell $3.7 billion in 2016, and are projected to increase $0.9 billion in 2017. Pork exports have remained relatively flat since 2014 at about $4.7 billion. (ERS, 2016t).
These reductions are largely attributable to lower commodity prices. In 2016 soybean export prices were down 19.5% in 2015 and 12% in 2016; corn was down 14.1% in 2015 and 4.8% in 2016; and pork was down 9.8% in 2015 and 6.9% in 2016. USDA’s 2017 forecasts see a 3% recovery in soybean prices, but further declines in corn and pork prices at around 5%. (FAS, 2016g).
The low commodity prices plus shortfalls in grain and oilseed production in South America have led to unexpected improvements in export volume (WAOB 2016). Corn export volume for 2016 is up 9.4%, but is expected to fall back by 5.1% in 2017. Soybean export volume is up 7% in 2016 and another 3% is projected for 2017. Weekly export sales reports show increases over past sales trends in the second half of the 2015/16 crop year that are continuing into the current crop year, corresponding with the southern hemisphere shortfall (FAS, 2016e). The declines of Brazilian corn production by 21% and Argentine oilseed production of 7.5%, contributed significantly to this outcome. Production and export volumes in South America are expected to recover in 2017 (FAS, 2016p).
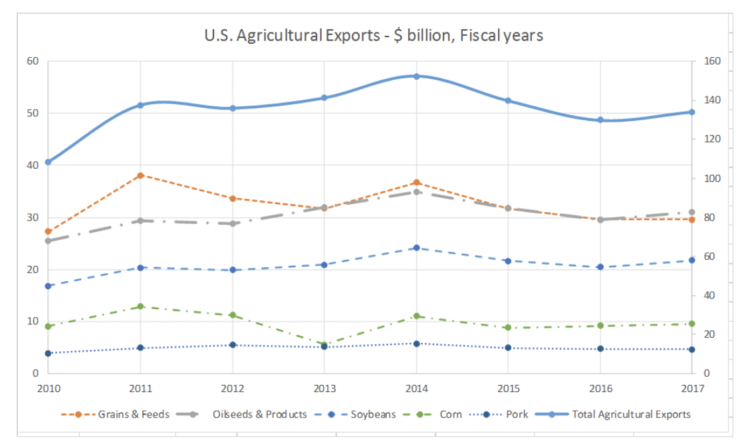
U.S. Agricultural Exports – $ billion, Fiscal years
Two factors contributing to low export values are weak global macroeconomic performance and the extremely strong dollar. Since 2014 the dollar has appreciated 25% relative to the Euro, 32% relative to the British pound, and 45% relative to the Brazilian real. USDA estimates that its real exchange rate index, which accounts for inflation here and abroad, appreciated 12% since 2014, 2.6% in 2016, and will appreciate an additional 2.1% in 2017. A strong exchange rate has historically contributed to low commodity prices, as U.S. exports are more expensive for their trading partners and competitors.
Both USDA and the IMF (2016) have predicted slow global economic growth in 2016 followed by modest recovery in 2017. While U.S. weak macroeconomic performance (1.6% GDP growth for 2016) has been one of the surprises leading to reductions in projections from one report to the next, very recent optimism calls for somewhat faster growth in 2017. The IMF estimate for 2017 U.S. GDP growth is 2.2%. Brazil and Russia are expected to emerge from recessions, China remains at over 6% growth, but the Euro area is expected to slow to just 1.5% growth.
One factor that potentially contributes to a better agricultural trade outlook, though not for the immediate future, is the successful completion of trade agreements. Historically, U.S. agriculture has benefited substantially from exports, and in particular from reforms in trade agreements like NAFTA and the URAA of WTO.
The U.S. concluded negotiations for the Trans Pacific Partnership (TPP) in October 2015 but ratification is now extremely doubtful. Not surprisingly, many agricultural interest groups have come out strongly in support of TPP. But president-elect Trump has indicated he will withdraw from TPP on his first day in office. The USDA noted in its outlook that “A change in the U.S. trade relationship with China and Mexico is of particular concern for agricultural competitiveness. Together, these two countries were the destination for an average of almost one-third of total U.S. agricultural exports from 2013-2015. China alone was the destination for roughly 60% of U.S. soybean exports, on average, during this period.”
Negative perceptions of trade agreements and globalization are not limited to the U.S. and its election outcome. Brexit, the U.K. vote to leave the European Union, also reflects inward, protectionist sentiment that is also found elsewhere now. In addition to potential negative effects on trade, Brexit is credited with GDP slowdown in both Britain and the EU. These come at a time when the IMF in its recent outlook had already highlighted a global trade slowdown (IMF 2016). Trade volume worldwide is expected to increase only 1.3% in 2016. Trade value will decline given low commodity prices generally. While trade growth is expected to recover somewhat in 2017, the more rapid growth of global trade than GDP growth appears to be a relic of the past.
Weak export demand was one key to recent agricultural price and value declines. Global economic weakness and a strong dollar mean agricultural trade will not turn
around quickly nor dramatically. In spite of lower prices and good crops this year, agricultural exports are likely to remain weak, showing only marginal improvement for the coming year. This weakness is likely to be reflected in prices and farm income, as well.
References:
Economic Research Service (ERS), USDA. Agricultural Exchange Rate Data Set, USDA, Washington, DC, 2016e.
Economic Research Service (ERS), USDA. Outlook for U.S. Agricultural Trade, USDA, Washington, DC, November 2016t.
Foreign Agricultural Service (FAS), USDA. Export Sales Query System, USDA, Washington, DC, 2016e.
Foreign Agricultural Service (FAS), USDA. Global Agricultural Trade System (GATS database), USDA, Washington, DC, 2016g.
Foreign Agricultural Service (FAS), USDA. Production Supply and Demand estimates (PS&D database), USDA, Washington, DC, 2016p.
International Monetary Fund (IMF), World Economic Outlook (WEO): Adjusting to Lower Commodity Prices, IMF, Washington DC, October 2016.
World Agricultural Outlook Board (WAOB). World Agricultural Supply and Demand Estimates (WASDE), USDA, Washington,
![]()
![]()
![]()
![]()
![]()