Ten Lessons from Research about Corn Response to Starter Fertilization
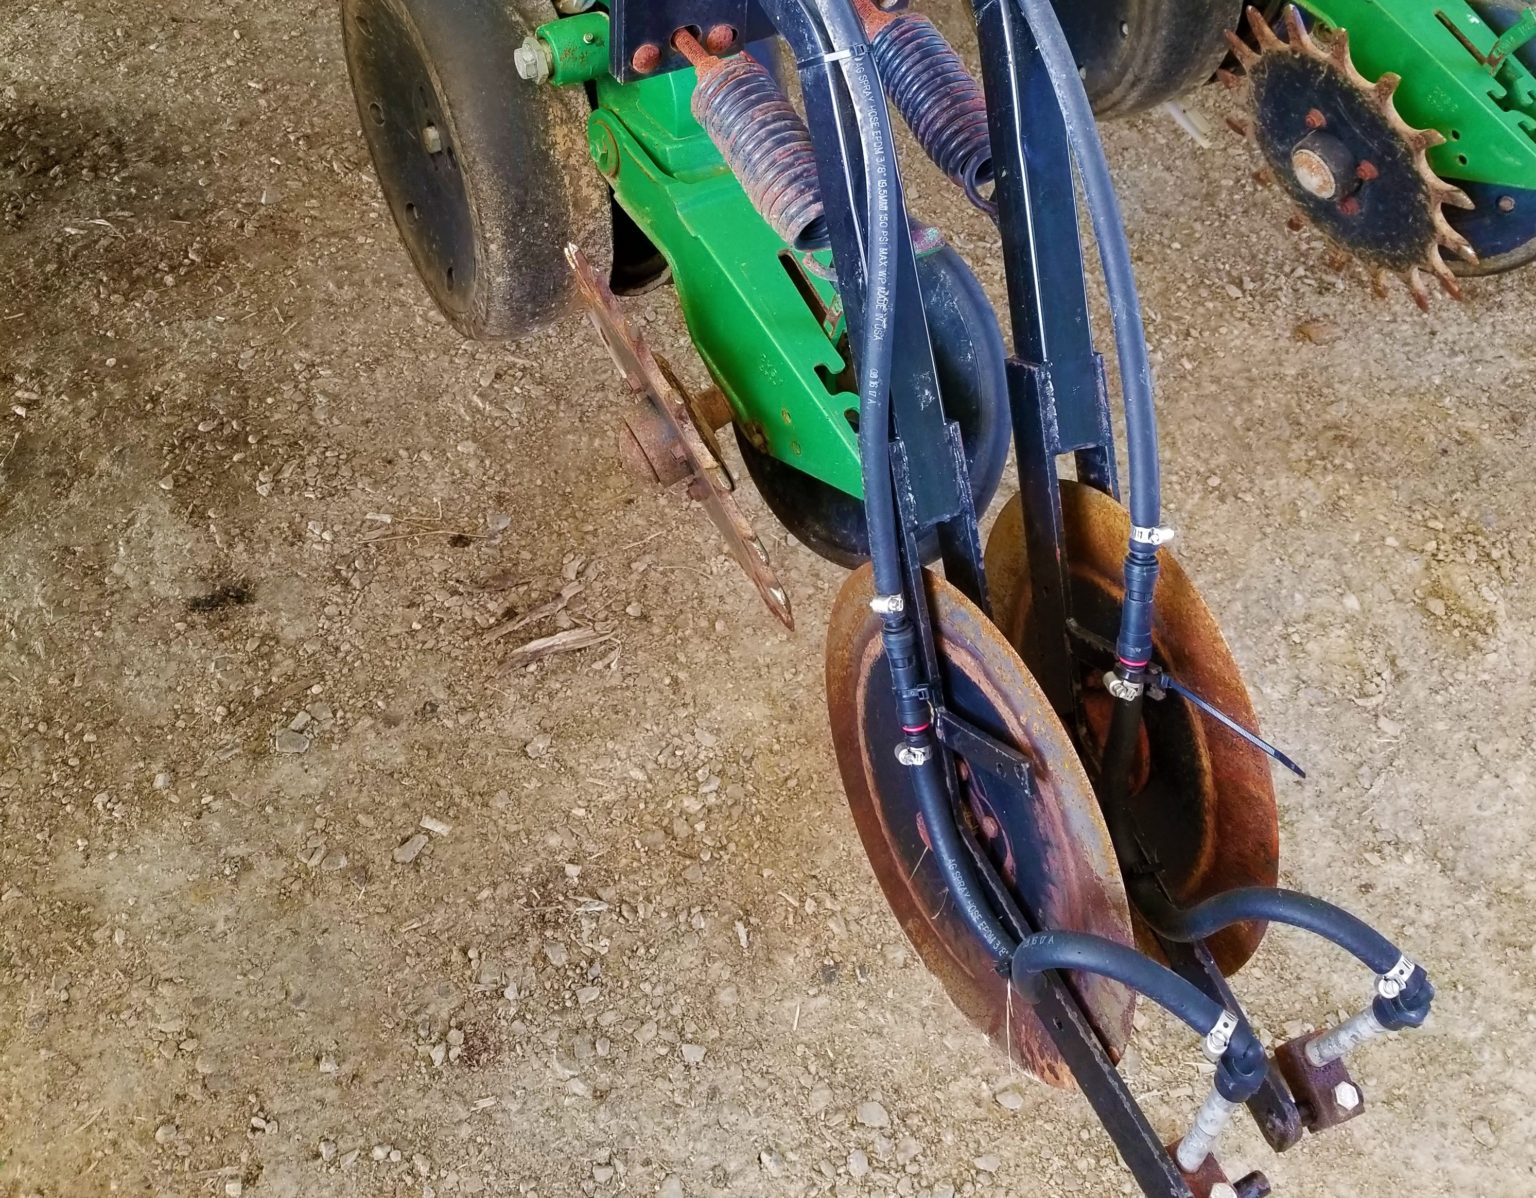
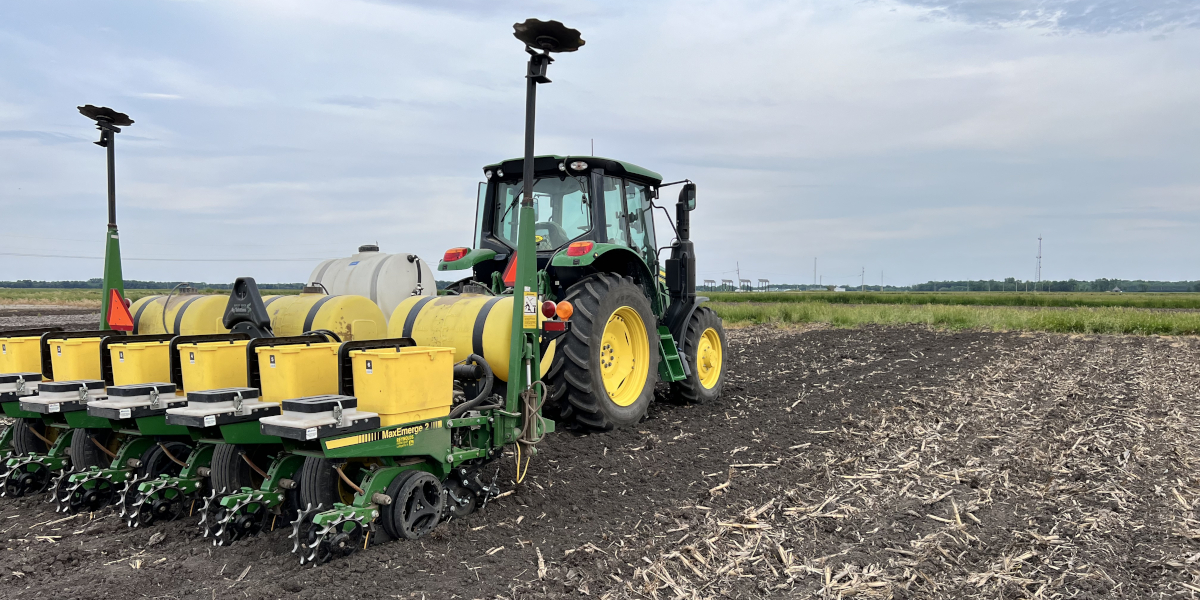
Image 1: Planters are typically equipped with a system to apply fertilizer directly on top of the seed or banded directly next to the seed at planting like the planter in this image.
Daniel Quinn, Chad Lee, and Hanna Poffenbarger
Dept. Plant and Soil Sciences, University of Kentucky.
Adapted from: Quinn, D.J., C.D. Lee., and H.J. Poffenbarger. 2020. Corn yield response to sub-surface banded starter fertilizer in the U.S.: A meta-analysis. Field Crops Res. 254:107834 https://doi.org/10.1016/j.fcr.2020.107834
The Quick Read: The meta-analysis revealed that starter fertilizer increased corn yields by an average of 5.2% across many growing conditions. Read the 10 lessons that follow to learn more about this analysis on starter fertilizer and corn yields.
Overview
Starter fertilizers are usually applied either 2 inches from the corn row and 2 inches deep (2×2) or directly in the seed furrow (in-furrow). In both cases, the fertilizer is placed below the soil surface (sub-surface). Farmers typically use starter fertilizer applications containing single or combinations of nutrients [e.g., nitrogen (N), phosphorus (P), potassium (K)] to improve corn early-season nutrient uptake, nutrient use efficiency, and crop growth under cool and moist soil conditions (2; 16; 6; 11). Placing fertilizer close to the seed at planting also increases early-season corn growth (6), plant height (13; 11), shortens the period between planting and silking (6), and reduces grain moisture at harvest (6). However, corn yield increases from starter applications can vary across different production systems and environments.
Because starter fertilizer use is popular in Kentucky and across the U.S., we analyzed starter fertilizer research trials from across the country. In this analysis, we try to understand and summarize corn yield responses to starter fertilizer observed across a wide spectrum of conditions and determine the primary factors driving the different yield responses. We analyzed multiple studies across the U.S. that compared corn yield to starter and corn yield without starter. This type of analysis is called a meta-analysis and allows us to find trends that may not be possible to identify from single studies. More details about how this meta-analysis was conducted, the fertilizer rates, soil types, environmental conditions, etc. are included in the “About the Meta-Analysis” section near the end of this publication.
Results
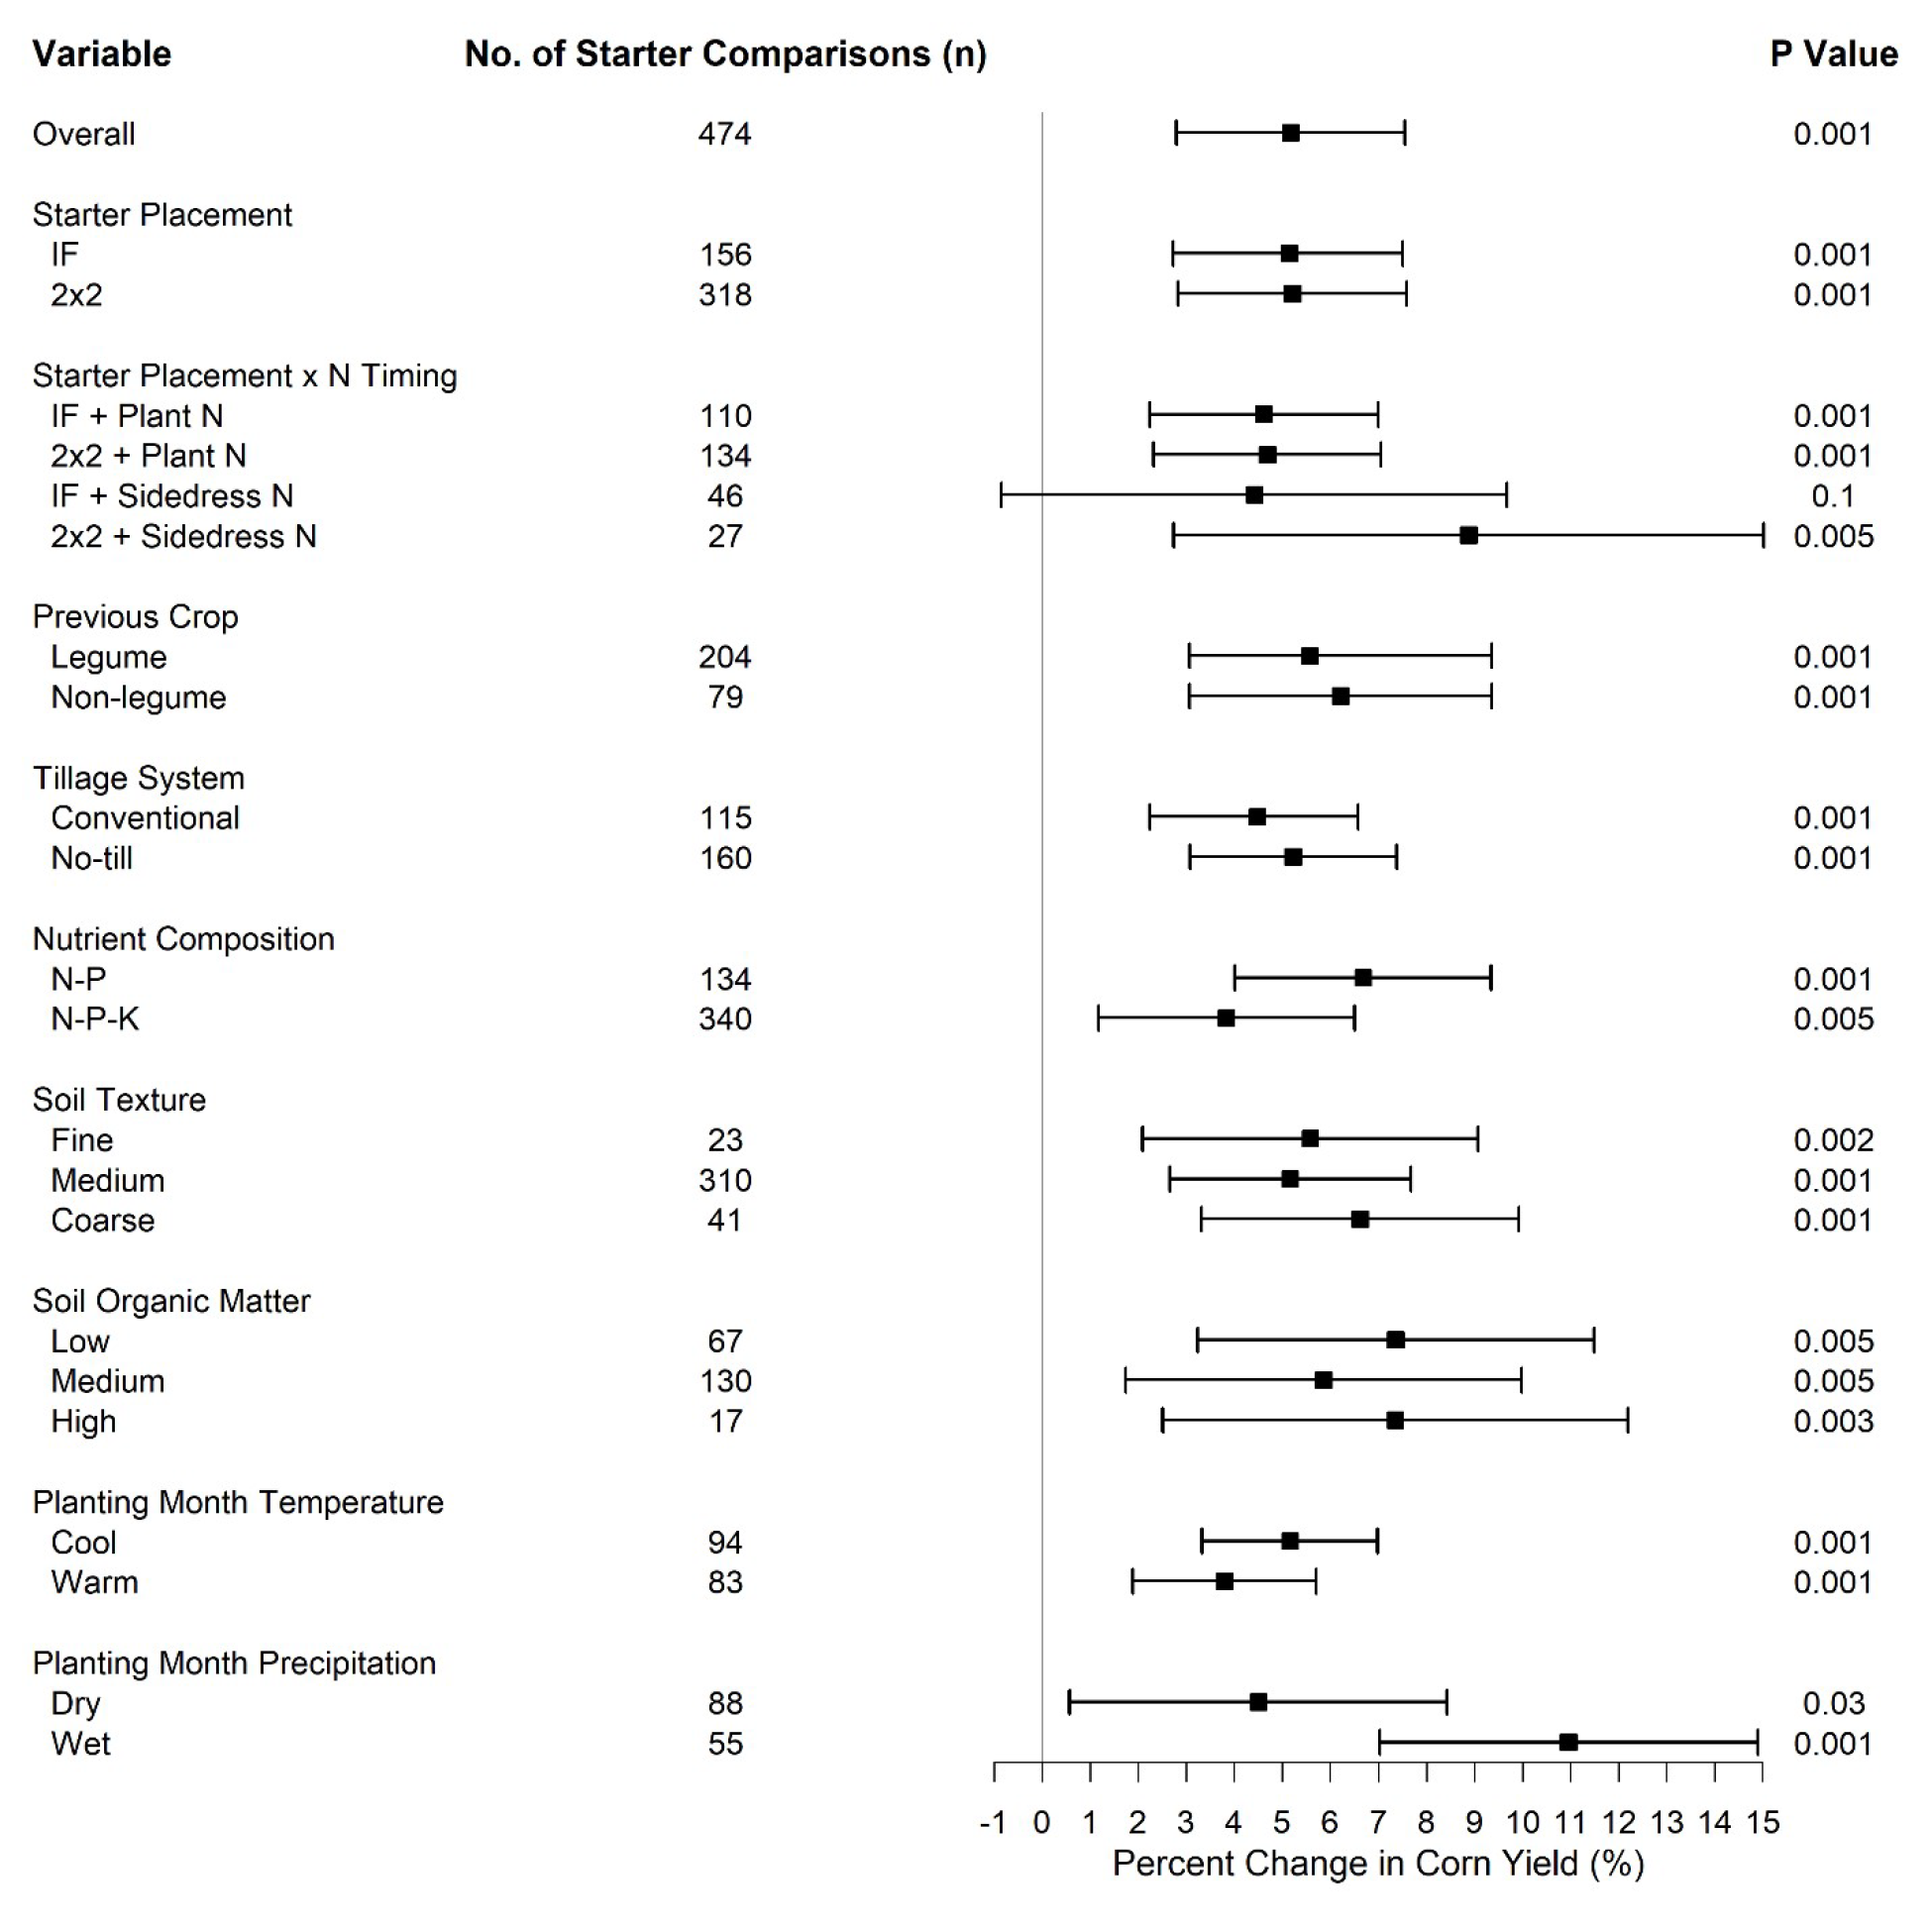
Figure 1. Corn yield response (as a percentage change) to starter fertilizer across all included data and as impacted by different management and environmental variables. Percent change in corn yield values greater than zero and significant p-values (≤ 0.05) indicate a significant corn yield increase from starter fertilizer. Error bars that overlap zero (0) indicate no statistical difference in corn yield from starter fertilizer. Error bars for one variable that overlap error bars from another variable indicate no significant difference in corn yield response between those two variables. Number of starter comparisons indicate total number of comparisons (corn with starter vs. corn without starter) contributing to the percent yield increase. Variables listed in the left side of Figure 1 are described in Table 1.
- Averaged across all Individual Starter Comparisons, Starter Fertilization Significantly Increased Corn Grain Yield by 5.2%. Of the 474 comparisons of corn with starter versus corn without starter, 74% showed a yield increase from starter fertilizer. Overall, average grain yields for corn containing a starter fertilizer and corn not containing a starter fertilizer were 152.9 and 146.6 bushels per acre, respectively.
- Starter 2×2 and In-Furrow had Similar Results when Majority of N was Applied at Planting. Most trials examined in our study had ample N at planting, which likely diminished the benefit of higher N rates in the 2×2 placement method compared with in-furrow placement.
- Only 2×2 Application Increased Corn Yield when Majority of N was Applied Sidedress. When the majority of N fertilizer application was delayed until sidedress, the 2×2 starter significantly increased corn yield by 8.9% relative to no starter (Figure 1), while in-furrow starter had no significant effect on corn yield (Figure 1). This result indicates that a 2×2 starter can provide a better buffer against early-season N stress than in-furrow due to the higher N rate applied, resulting in greater producer flexibility in N application timing (11).
- Starter Fertilizer Increased Corn Yields when Corn Followed Soybean or Corn. Corn yield increase to starter fertilization did not differ between corn following a soybean, corn, cotton, sorghum or wheat. (Figure 1). We expected a smaller corn yield response to starter fertilization following soybean due to faster N release from legume residues resulting in higher early-season plant-available N than from non-legume residues. However, most studies used in our analysis applied most of the N at planting or before which may have diminished the effect of previous crop residue on plant-available N supply. In addition, at-plant or pre-plant total N and starter N rates for studies were 12% and 127% higher, respectively for corn following a non-legume crop compared to corn following soybean. Corn producers in some other states are often advised to apply higher rates of N fertilizer for corn following a non-legume, which may negate differences in early-season N availability caused by the previous crop and overshadow differences in yield benefits from starter fertilizer application across rotations. University of Kentucky does not recommend a higher N rate for corn following corn compared to corn following soybeans based on years of research in Kentucky (cite AGR-1).
- Starter Fertilizer Increased Corn Yields in No-Till and Tilled Systems. Starter fertilizer use has been promoted for no-till management systems to amend the negative effects of surface residues on corn emergence, root growth, and nutrient supply (9; 15; 10). The presence of a residue and mulch cover in a no-till soil system can significantly lower at-plant soil temperature and decrease the rate of nutrient mineralization from soil organic matter (3). This meta-analysis suggests that tillage-related differences in soil conditions (e.g., soil moisture, temperature) may not be great enough to warrant adjustments to fertilizer management, at least under the management and environmental conditions captured in our analysis.
- Corn yield increase in response to starter fertilizer was similar between starters containing N-P and those containing N-P-K. The number of observations for each starter fertilizer formulation reveals that, at least in research studies, most starter fertilizers contain N with P, or N with P and K. The high frequency of starter fertilizers containing combinations of multiple nutrients is well-justified based on the consistent positive effects of these starter compositions on corn yield as illustrated in the results.
- Soil Organic Matter, Soil Texture, Average Planting Month Temperature and Average Planting Month Rainfall did not Impact Corn Response to Starter. Our meta-analysis contradicts the commonly held belief that starter fertilization is more beneficial in soils with low soil organic matter and under cool and wet planting conditions, which are generally associated with restricted root growth and low nutrient availability (14).
- Corn Yields Increased in Response to Starter Even when Soil Test P and K were Above Critical Values. Our results demonstrated that as soil test P and K levels increase beyond recommended soil test critical levels, the magnitude and frequency of corn yield response to starter fertilizer containing P or K decreases. However, our results also showed that a significant portion of positive yield responses were produced at above critical soil test P and K values, suggesting starter fertilizer has the potential to improve corn yield even when soil test results do not warrant a fertilizer application. The greater starter fertilization response on below-critical soil test P and K soils than above-critical soil test P and K soils likely reflects the potential alleviation of all three nutrient deficiencies on below-critical soils and alleviation of only N deficiency or localized P and K deficiencies on above-critical soils (1; 5; 16).
- The Benefit of Starter Fertilization Decreased at Higher Seeding Rates Our results support recent research showing that localized nutrient applications near the root zone (e.g., starter fertilizer) at high corn plant densities may cause yield reduction relative to broadcast fertilizer applications due to excessive root growth and competition for soil nutrients (7).
- The Benefit of Starter Fertilization Increased at Higher Yield Levels. Contrary to the results for corn plant population, results for corn yield level indicate that the benefit of starter fertilization increases with increasing yield level. As corn yield potential increases, corn nutrient uptake requirements also increase (12). A greater response to starter fertilizer application in high- than low-yielding environments may reflect the greater crop nutrient demand and reduced risk of other resource limitations in high-yielding environments.
Final Notes
Corn yield responses to starter fertilizer applications are likely dictated by many complex interactions of site-specific factors that include soil properties, weather, genotype, and management, of which only a select few could be included in this analysis. Therefore, the effect of a starter fertilizer application at a specific location in a specific year, may differ from the average effects observed in this analysis. Although previous research conducted in the U.S. suggests that starter fertilization benefits corn yields in most cases, farmers should investigate starter fertilizer options and if they chose to use them, include some checks with no starter to understand if their corn fields respond similarly to the corn in the research from this meta-analysis.
About the Meta-Analysis
Corn yield response to starter fertilizer application was estimated by reviewing and obtaining data from previously published research performed across the U.S. The data included both small plot and on-farm research trials which contained in-field replication, randomization, and were performed in the U.S. from 1990 through 2019. This analysis included a total of 474 individual comparisons of starter versus no starter across 23 published research studies and nine U.S. states. We used a meta-analysis to examine the data across these various studies and locations. A meta-analysis is simply the combining of data from different studies and using specific statistical methods to find overall yield effects of specific management practices that may otherwise be difficult to fully understand within single, short-term research trials. Those individual trials are often limited to particular climatic and soil conditions (4). In this meta-analysis the main data point of interest is known as the log response ratio or the log of the ratio of the average treatment corn yield (corn planted with a starter fertilizer) and the average control corn yield (corn planted without a starter fertilizer) (yield of corn with a starter fertilizer divided by the yield of corn without a starter fertilizer). For ease of interpretation, log of the response ratio values were back-transformed to percent change in corn yield. Therefore, if percent change in corn yield has a value greater than zero, this indicates a corn yield increase due to starter fertilizer and if percent change in corn yield has a value less than zero, this indicates a corn yield decrease due to starter fertilizer. If the error bars from the yield response intersect with zero then there was no yield difference.
Additional factors were taken from the studies chosen and included due to their potential to moderate or change starter fertilizer impacts on corn grain yield. These variables are labeled as moderator variables and include: starter placement, primary N fertilization timing, previous crop, tillage system, starter nutrient composition, soil texture, soil organic matter level, planting month temperature, planting month precipitation, soil test P and K, corn seeding rate, and overall corn yield level (Table 1).
Table 1. Variables examined in the meta-analysis that were chosen based on potential to moderate or change the yield response of corn to starter fertilizer.
| Moderator variable | Description of moderator variable levels |
| Starter Placement | In-furrow, 2 x 2 in. sub-surface band (2×2) |
| Primary N Fertilization Timing† | Planting (at planting or before), sidedress (V4-V8 growth stage) |
| Previous Crop | Non-legume (corn, cotton, sorghum, wheat), legume (soybean) |
| Tillage System | Conventional, no-till |
| Starter Nutrient Composition | Nitrogen (N)-phosphorus (P), N-P-potassium (K). |
| Soil Texture | Fine (clay loam, silty clay loam), medium (silt loam, loam), coarse (sandy loam) |
| Soil Organic Matter Level§ | Low (0-2.6%), medium (2.7-5.3%), high (5.4-8%) |
| Planting Month Temperature¶ | Cool (<59°F), warm (>59°F) |
| Planting Month Precipitation¶ | Dry (<5.1 in), wet (>5.1 in) |
| Soil Test Phosphorus# | Percent change from state-specific critical soil test phosphorus value. |
| Soil Test Potassium# | Percent change from state-specific critical soil test potassium value. |
| Plant Population | Individual study corn plant population rate (seeds A-1) |
| Grain Yield Level | Average corn grain yield (bu A-1) across starter treatments for each study site-year |
† Primary N fertilization timing refers to the time when the majority of N fertilizer was applied, supplementing the N fertilizer applied as starter.
§ Soil organic matter values for the dataset ranged from 3 to 8%, therefore values were classified into three equal-range groups of low (0-2.6%), medium (2.7-5.3%), and high (5.4-8%).
¶ Average planting month temperature (59°F) and precipitation (5.1 in) values were calculated from the entire dataset used and temperature and precipitation values were grouped by cool and warm, or wet and dry, respectively, based on whether values were above or below the average planting month temperature and planting month precipitation.
# Soil test phosphorus and potassium were converted to the percent change from site-specific critical P and K levels derived from state-specific university nutrient management guidelines to account for different in-state recommendation calculations and testing methods used.
Summary of Research Trials
Our analysis incorporated studies with both in-furrow and 2×2 starter fertilizer applications. Average N, P, and K rates of starters used in the studies were 7, 8, and 4 pounds per acre (lbs/A), respectively for in-furrow and 21, 21, and 15 lbs/A, respectively for 2×2. Across this dataset, a total of 77% of the observations had primary N (total N fertilizer applied apart from starter N) applied at-planting or before, compared to only 23% of the observations that had primary N applied as in-season sidedress (i.e., corn growth stage V4-V8). Pre- or at-planting primary N rates ranged from 116 to 200 lbs N/A and sidedress N rates ranged from 76 to 161 lbs N/A. Total N rates for studies following a non-legume (e.g. sorghum, wheat, corn) averaged 163 lbs N/A compared with 146 lbs N/A for studies following a legume (e.g. soybean), yet similar total N rates were applied across tillage systems (148 and 149 lbs N/A for no-till and conventionally tilled systems, respectively).
Grain yields ranged widely (35-244 bushels per acre), which can be attributed to the diversity of cropping systems (soil properties, precipitation, topography, hybrids used, etc.) included in the analysis. Results encompassed a total of nine states across the U.S. with the majority of observations from the Midwestern Corn Belt (i.e. Iowa, Minnesota, Wisconsin). Dominant soil types included silt loam and silty clay loam with soil organic matter levels that ranged from 0.3 to 8 %. Dominant cropping systems were both no-till and conventionally tilled corn following soybean. Planting month temperature and precipitation ranged from 42 – 70°F and 1.3 – 15.9 inches, respectively, with the majority of corn studies planted from late April to early May.
For an even deeper read into this meta-analysis, you can access the research article here.
References
- Ritchey, E., and J. McGrath. AGR-1: 2020. 2020-2021 Lime and Nutrient Recommendations. University of Kentucky Cooperative Extension Service. Lexington. http://www2.ca.uky.edu/agcomm/pubs/agr/agr1/agr1.pdf
- Bermudez, M., and A.P. Mallarino. 2002. Yield and early growth responses to starter fertilizer in no-till corn assessed with precision agriculture technologies. Agron. J. 94:1024-1033.
- Bermudez, M., and A.P. Mallarino. 2004. Corn response to starter fertilizer and tillage across and within fields having no-till management histories. Agron. J. 96:776-785.
- Bonan, G.B., and K. Van Cleve. 1992. Soil temperature, nitrogen mineralization, and carbon source-sink relationships in boreal forests. Can. J. For. Res. 22:629-639.
- Eagle, A.J., L.E. Christianson, R.L. Cook, R.D. Harmel, F.E. Miguez, S.S. Qian, and D.A. Ruiz Diaz. 2017. Meta-analysis constrained by data: Recommendations to improve relevance of nutrient management research. Agron. J. 109:2441-2449.
- Kaiser, D.E., A.P. Mallarino, and M. Bermudez. 2005. Corn grain yield, early growth, and early nutrient uptake as affected by broadcast and in-furrow starter fertilization. Agron. J. 97:620-626.
- Kaiser, D.E., J.A. Coulter, and J.A. Vetsch. 2016. Corn hybrid response to in-furrow starter fertilizer as affected by planting date. Agron. J. 108:2493-2501.
- Li, H., X. Wang, R.W. Brooker, Z. Rengel, F. Zhang, W.J. Davies, and J. Shen. 2018. Root competition resulting from spatial variation in nutrient distribution elicits decreasing maize yield at high planting density. Plant Soil. https://doi.org/10.1007/s11104-018-3812-5.
- Mallarino, A.P., N. Bergmann, and D.E. Kaiser. 2011. Corn responses to in-furrow phosphorus and potassium starter fertilizer applications. Agron. J. 103:685-694.
- Mengel, D.B. 1992. Fertilizing corn grown using conservation tillage. Agron. Guide 268. Purdue Univ. Coop. Ext. Serv. West Lafayette, IN.
- Niehues, B.J., R.E. Lamond, C.B. Godsey, and C.J. Olsen. 2004. Starter nitrogen fertilizer management for continuous no-till corn production. Agron. J. 96:1412-1418.
- Rutan, J., and K. Steinke. 2018. Pre-plant and in-season nitrogen combinations for the northern corn belt. Agron. J. 110:1-11.
- Setiyono, T.D., D.T. Walters, K.G. Cassman, C. Witt, and A. Dobermann. 2010. Estimating maize nutrient uptake requirements. Field Crops Res. 118:158-168.
- Vetsch, J.A., and G.W. Randall. 2002. Corn production as affected by tillage system and starter fertilizer. Agron. J. 94:532-540.
- Wolkowski, R.P. 1990. Relationship between wheel-traffic-induced soil compaction, nutrient availability, and crop growth: A review. J. Prod. Agric. 3:460-469.
- Wolkowsi, R.P. 2000. Row-placed fertilizer for maize grown with an in-row crop residue management system in southern Wisconsin. Soil Tillage Res. 54:55-62.
- Wortmann, C.S., S.A. Xerinda, M. Mamo, and C.A. Shapiro. 2006. No-till row crop response to starter fertilizer in eastern Nebraska: I. irrigated and rainfed corn. Agron. J. 98:156-162.
- Zhang, M., M. Nyborg, S.S. Malhi, and E.D. Solberg. 2000. Localized root growth in soil induced by controlled-release urea granule and barley nitrogen uptake. J. Plant. Nut. 23:413-422.

