Putting Northwest Indiana’s Conservation Plan on the Map
Northwest Indiana holds a surprising amount of nature for a corner of the state best known for steel mills and shipping. Along Lake Michigan there are globally significant dune-and-swale landscapes that migrating birds depend on. Inland, the Valparaiso Moraine, a glacial ridge that splits the Great Lakes watershed from the Mississippi’s, shelters some of the region’s best remaining forest. To the south lie the floodplains of the old Grand Kankakee Marsh, once among the largest wetlands in North America and now a major opportunity for restoration.
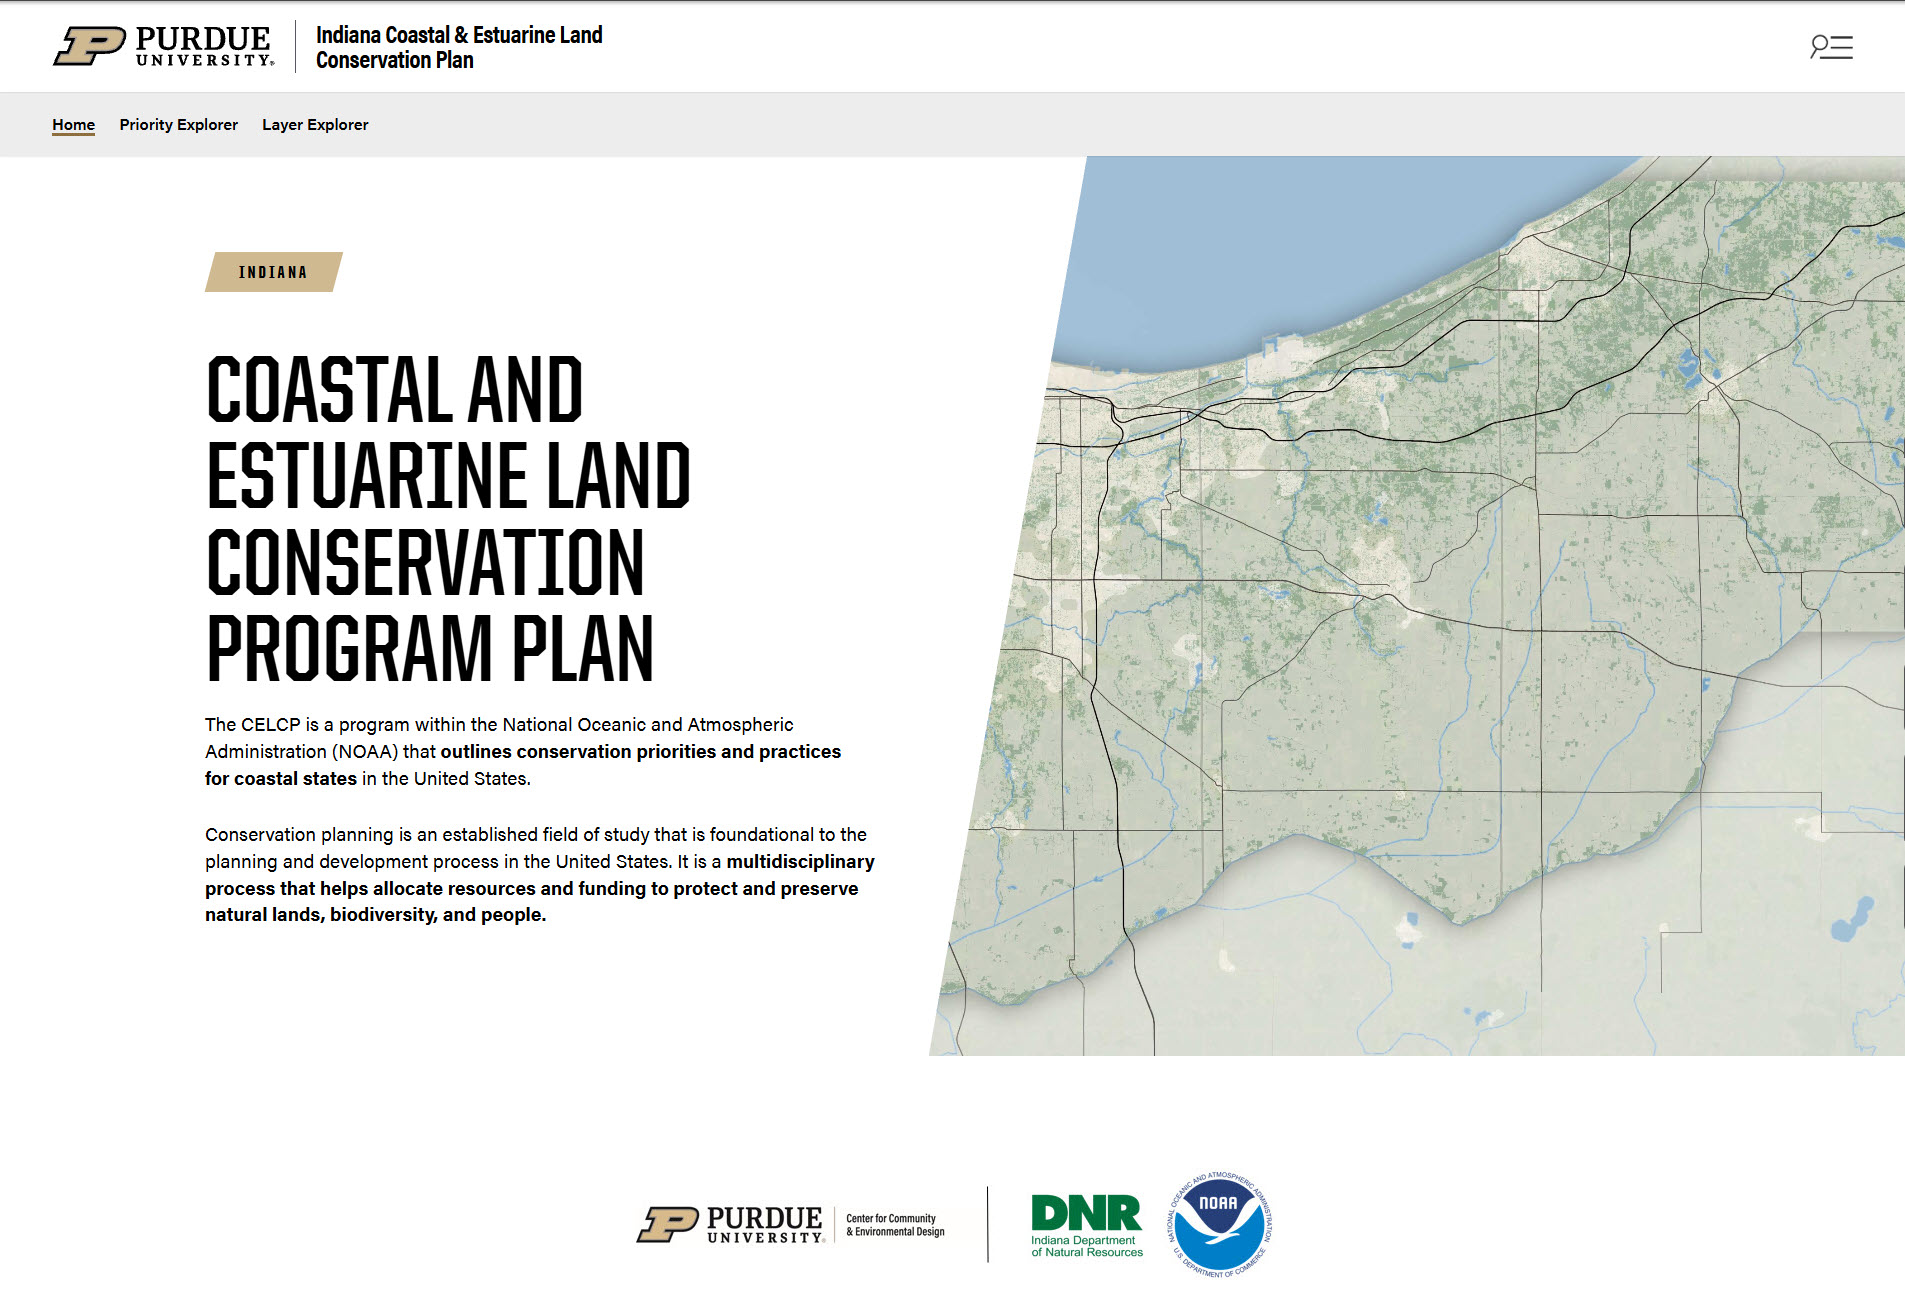
Protecting what is left, and reconnecting it, is the job of the Indiana Coastal and Estuarine Land Conservation Plan (CELCP). It was developed with the Indiana Department of Natural Resources, Purdue University, and NOAA, and it covers Lake, Porter, and LaPorte counties.
3
Counties covered
~6,000
Scored hexagons
15
Measures per hexagon
A plan built on data
The CELCP doesn’t rely on gut feeling about which land matters most. It scores the whole three-county region using two ideas:
- Landscape Quality: how ecologically valuable a place is, based on things like forests, wetlands, protected land, and connected corridors.
- Landscape Threat: how likely a place is to be lost to development, based on land values, urban growth, and housing density.
Land that scores high on both, valuable and at risk, is where conservation dollars can do the most good. The plan pairs this analysis with interviews of conservation professionals and a survey of landowners, so the priorities reflect what the people who live and work there actually care about.
That’s a strong plan. But a plan that lives in a report and a set of GIS files is hard for most people to explore. A land trust board member, a county planner, or a landowner shouldn’t need GIS software and a week of training to ask, “What does the plan say about this area?”
Making the plan something you can explore
To close that gap, we built a WordPress plugin for the CELCP website that turns the plan’s underlying map data into two interactive tools. Anyone with a web browser can use them. Nothing needs to be installed, and nothing a visitor does can change the published data.
The Conservation Priority Explorer
“What if we cared about this more?”
The region is divided into a grid of roughly 6,000 small hexagons, and each one has been scored across fifteen measures: ten describe ecological quality (forests, wetlands, floodplains, stream and wetland buffers, tree canopy, and so on), and five describe development pressure.
The published plan sorts every hexagon into one of four kinds of place, such as forest and ecological network, floodplain and multi-resource, or urban and agricultural tree canopy. The explorer lets you see that map, and then ask what happens when your priorities differ from the plan’s. If you care more about wetland buffers, turn that up and watch the map respond. Click any hexagon to see what kind of place it is and how it ranks. Fade the grid to see the parcels and town boundaries underneath, and share the exact view you built as a link.
The Layer Explorer
“What is actually behind these scores?”
Every score comes from a set of underlying map layers: land cover, hydrology, habitat, protected land, development pressure. In standard GIS tools these are hard to compare, because they stack in a fixed order and can’t easily be placed side by side.
The Layer Explorer is built for comparison. Turn any layer on with one click, or isolate it on its own. View two layers split down the middle with a swipe slider, or in a grid of small synchronized maps that pan and zoom together. Each layer comes with a plain-English description and a legend, so you don’t have to guess what the colors mean.
The point isn’t to replace the plan’s judgment. It’s to make the reasoning visible, so people can see how much a conclusion depends on what you choose to value.
Built to stay current
One design choice matters more than it might sound. The plugin doesn’t keep its own copy of the data. It reads the same published maps the GIS team maintains in ArcGIS Online. When a layer is updated, renamed, or added, the website reflects it automatically, with no rebuild and no chance of the website drifting out of step with the official plan.
Site administrators also get a settings screen to choose which maps feed each tool, what the criteria are called, how the grid looks, and which layers stay pinned to the map, all without touching code.
Why this matters
Conservation works when the people making decisions, from landowners and local officials to land trusts and funders, can see the same picture and trust where it came from. A plan is only as useful as the number of people who can actually use it.
These tools are one step toward that: taking a rigorous, science-based plan and putting it where anyone can pick it up and explore.
The CELCP is a collaboration among the Indiana Department of Natural Resources, Purdue University, and NOAA.