Farmer optimism about short-term US farmland values weakens
August 10, 2022
PAER-2022-24
Chad Fiechter, Ph.D. Student; Michael Langemeier, Associate Director of the Center for Commercial Agriculture and Professor of Agricultural Economics; James Mintert, Director of the Center for Commercial Agriculture and Professor of Agricultural Economics
![]()
![]()
![]()
![]()
![]()
Farmers purchase the majority of US farmland. The 2017 USDA Census of Agriculture reports more than 60% of farmland is owned by farmers. Farmers’ farmland value expectations are an important driver of farmland prices. The Purdue University-CME Group Ag Economy Barometer provides a monthly indication of farmers’ aggregate short-term and long-term US farmland value expectations. The monthly Ag Economy Barometer survey asks the 400 farmer respondents to provide their farmland value expectations. It’s important to note that the barometer is not a panel survey, but instead gather’s responses from a different set of farmers each month. Comparability across survey’s is maintained by holding survey respondents’ enterprise mix constant over time. Since January 2019, the following farmland value expectations questions have been posed monthly.
Short-Term Farmland Value Expectations
Compared to today, what are your expectations for farmland prices in your area 12 months from now? Higher, Lower, or About the Same?
____ Higher
____ Lower
____ About the same
Long-Term Farmland Value Expectations
Thinking long-term, what are your expectations for farmland prices in your area 5 years from now? Higher, Lower, or About the Same?
____ Higher
____ Lower
____ About the same
Farmers’ short-term farmland value expectations improved dramatically between March 2020 and February 2021 and a new level of optimism remained in place until this summer. Figure 1 presents the index of both short-term and long-term farmland value expectations from the Ag Economy Barometer. The index is calculated by subtracting the percentage of farmers indicating “Lower” from the percentage of farmers indicating “Higher” and then adding 100. The Short-Term Farmland Value Expectations Index tracked in a stable range from November 2015 until March 2020. In March 2020 there was a brief but steep decline in the short-term index, coinciding with the early part of the COVID-19 pandemic in the US. A reversal in the index took place in June 2020 and optimism regarding short-term farmland value expectations increased over the following year. The short-term index peaked in fall 2021 and by July 2022 the index was nearly 20 percent below its peak value.
The increase in the Short-Term Farmland Value Expectation Index from 2020 into fall 2021 was largely due to farmer respondents shifting their opinions from the “About the same” category to the “Higher” category. The more recent decline in the index occurred primarily as a result of respondents shifting opinions from “Higher” to “About the same”. Figure 2 details the percentage of farmers with short-term farmland value expectations in each category. Note that the Short-Term Farmland Value Expectation Index only factors in the percentage of farmers responding either “Higher” or “Lower”. Figure 2 also reveals that there are always some farmers with a short-run negative outlook for farmland values. The share of farmers with pessimistic short-term expectations consistently fell below 10 percent from December 2020 through May 2022. However, the percentage of producers with a negative short-term farmland value outlook began to creep up this summer, rising to 10 percent in June and 12 percent in the July survey.
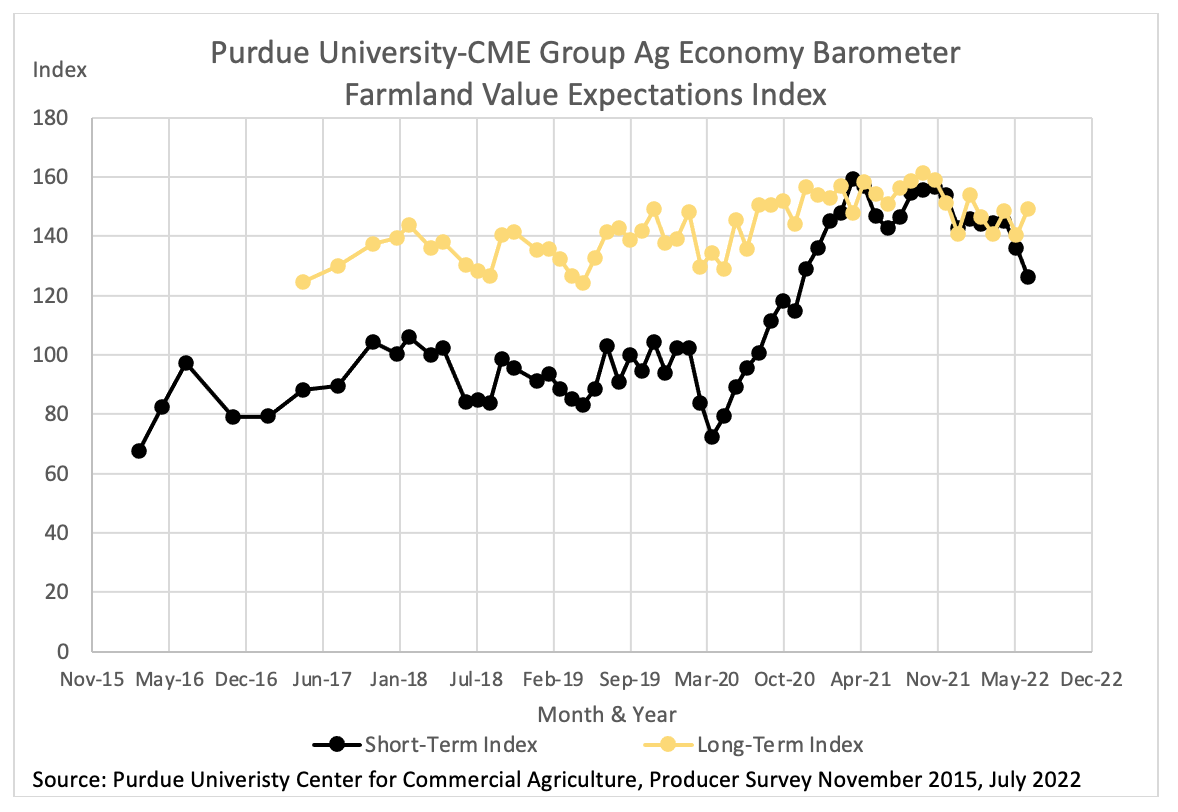
Figure 1. Purdue University Center for Commercial Agriculture, Producer Survey, Farmland Value Expectations Index
The Long-Term Farmland Value Expectations Index provided a much more optimistic view on farmland values than the short-term index from its launch in spring 2017 until fall 2020. However, in the fourth quarter of 2020 the spread between the two indices narrowed sharply as producers short-run outlook became much more optimistic. The two indices tended to track each other through 2021 and the first half of 2022. However, due to the recent decline in the short-run index, the long-term index is once again at a large premium to the short-run index. The relative premium shifted from a 5 point spread in June to a 23 point spread in the July survey. Recent barometer surveys have posed a follow-up question to respondents who expect farmland values to rise over the next five years, asking them for the primary reason they think values will rise. Overwhelmingly, respondents have indicated they expect the two most important factors to be non-farm investor demand and inflation.
The monthly farmland value expectation index of the Purdue University-CME Group Ag Economy Barometer offers farmland stakeholders a frequent and interesting assessment of farmland value expectations. The relationship between farmers’ short-term and long-term farmland value expectations could provide timely insights into developments in the US farmland market.
For monthly updates on the Ag Economy Barometer and the Short-Term and Long-Term Farmland Value Expectations Index visit: https://ag.purdue.edu/commercialag/ageconomybarometer/
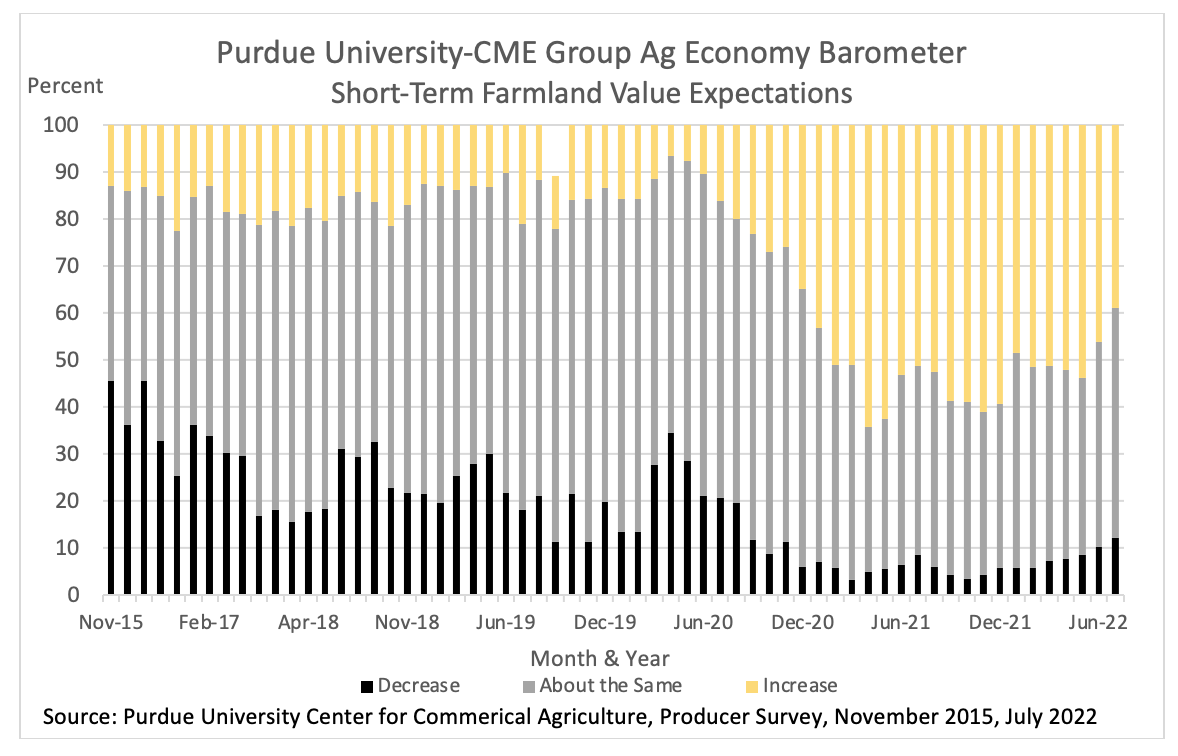
Figure 2. Purdue University Center for Commercial Agriculture, Producer Survey, Short-Term Farmland Value Expectation Response Percentages
Reference
USDA National Agricultural Statistics Service, 2017 Census of Agriculture. Complete data available at www.nass.usda.gov/AgCensus
![]()
![]()
![]()
![]()
![]()