Do Government Farm Support Programs affect the Adoption of Farm Technology and Sustainable Production Practices?
April 26, 2022
PAER-2022-16
Haden Comstock, M.S. Student; Nathan DeLay, Assistant Professor
![]()
![]()
![]()
![]()
![]()
Agricultural production has long been considered an industry with a high level of risk. Producers are exposed to a multitude of perils, many of which are unpredictable and potentially catastrophic. There is an increasing body of research that suggests these types of risks are likely to increase in frequency and magnitude due to climate change (Schneider et al. 2007; Karl, Meehl, and Miller 2008; Schoengold et al. 2014; Woodard and Verteramo-Chiu, 2017). Due to this potentially increasing variability, agricultural risk management has become one of the highest priorities for agricultural policymakers (Schoengold et al. 2014). This article explores the relationship between participation in the Federal Crop Insurance Program (FCIP) and technology adoption patterns for soybean farms in the U.S.
In response to these increased risks, various technological advancements have been made to assist farmers with risk reduction and to bolster efficient production methods. Precision agriculture technologies (PATs) are classified as a suite of technologies that use site-specific information to improve field management techniques. The most common PATs include yield monitors, soil and yield mapping using a global positioning system (GPS), GPS based tractor guidance systems, variable rate technology (VRT), and aerial technology such as drones and satellite imagery. PATs have been linked to higher yields, higher net returns, and more efficient allocation of inputs (Schimmelpfennig, 2016). These benefits may be associated with increased risk-mitigation due to their data-based methods for nutrient applications and crop management. Figure 1 shows the relative adoption rates for PATs on soybean acres and soybean farms in 2018.
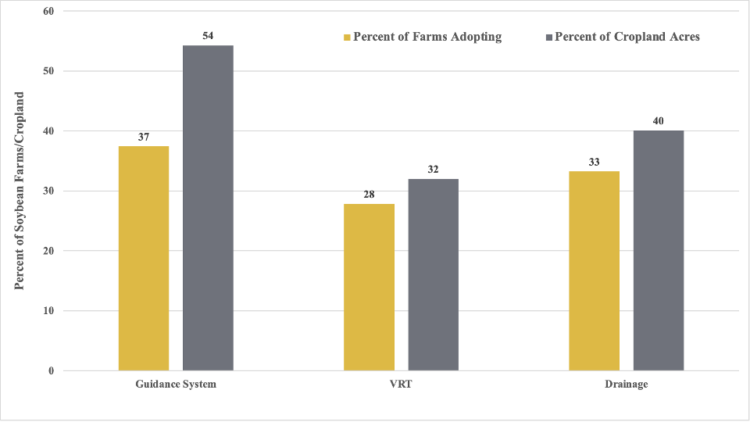
Figure 1 Technology Adoption on Soybean Farms/Cropland Acres, 2018
Source: USDA, ERS, “2018 Agricultural Resource Management Survey, Phase II.”
U.S. farm policy has increasingly relied on the Federal Crop Insurance Program (FCIP) as the main source of risk-management for agriculture. The FCIP is managed, regulated, and administered by the United States Department of Agriculture (USDA) Risk Management Agency (RMA), whose mission is to assist agricultural producers in mitigating risk from various natural perils. In 2021, 444 million acres were enrolled in the FCIP (USDA RMA, 2021). The FCIP subsidizes crop insurance premiums to incentivize participation by reducing farmers’ out-of-pocket crop insurance costs. Figure 2 shows the historical trends for premiums, subsidies, and liabilities for the FCIP from 2000 – 2021. Current projections estimate that net spending on the FCIP could reach $80 billion for FY2021 – FY2030 (Congressional Research Service, 2021). Additionally, the FCIP accounted for approximately 52% of payment to farmers from farm safety net programs between 2014 – 2018 (CRS, 2021).
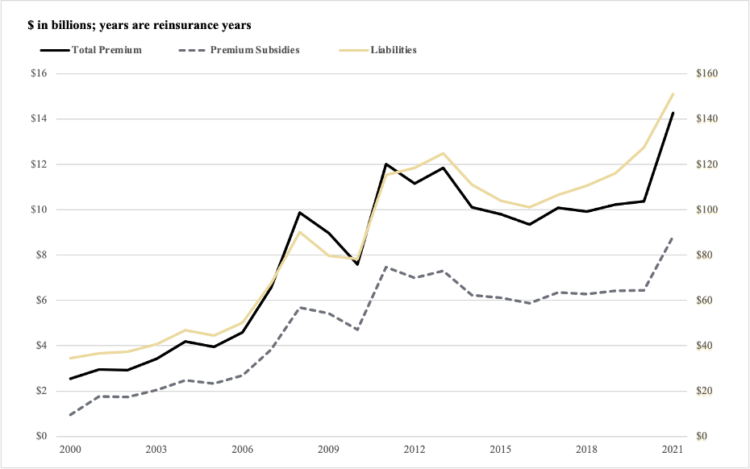
Figure 2 Annual FCIP Total Premium, Premium Subsidies, and Liabilities, 2000 – 2021.
Source: USDA, RMA, “Summary of Business, 2000 – 2021.”
Our research examines the effects of the FCIP on the adoption of GPS guidance systems, VRT (fertilizer, pesticide, and seeding) systems, and subsurface tile-drainage systems for soybean farms. There may be tension between farmer adoption of capital-intensive farm technologies and federal crop insurance programs due to the subsidized nature of the FCIP system. While a plethora of research has been devoted to the role of subsidized crop insurance on various aspects of risk-mitigating practices, there exists a gap in the literature on the effects of the FCIP on a suite of various risk mitigating technologies, such as PATs and the management practices mentioned above, within the United States. Our research aims to add to the existing literature by analyzing the effects of the FCIP on farm risk mitigating technology adoption and farming practices in the United States for soybean operations.
Results and Discussion
Data and variables for this study have been obtained from the Agricultural Resource Management Survey (ARMS), which is administered and maintained jointly through the USDA Economic Research Service (ERS) and the National Agricultural Statistical Service (NASS). This survey provides a comprehensive, nation-wide overview of the production practices, resource use, and economic situations of farm operations. Because ARMS is not a random sample, the dataset includes expansion weights for all observations, which indicates the number of fields each specific farm represents. These sample weights ensure that the ARMS survey is nationally representative, despite only surveying certain operations. The pertinent technology questions for this study include sub-surface tile drainage systems, GPS based guidance auto-steering, and variable rate applicators (seeding, fertilizer/lime applications, and pesticide applications). Figures 3, 4, and 5 provide a visual representation for the number of years a subsurface tile-drainage system, GPS guidance system, and VRT system has been installed.
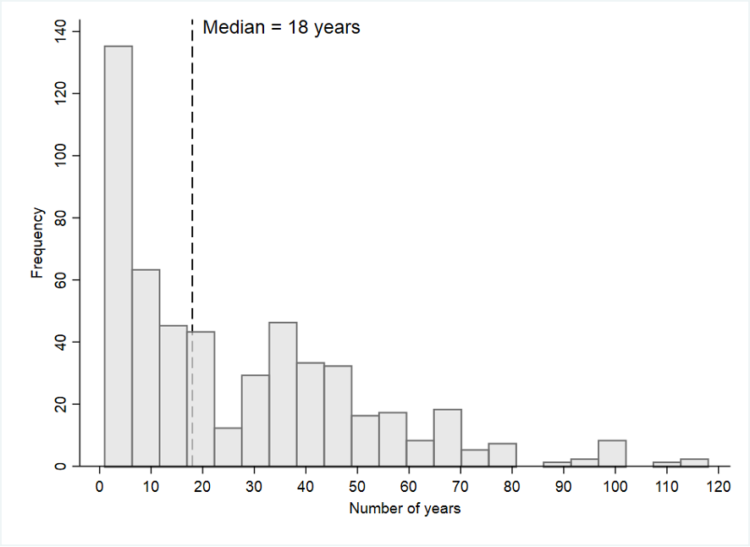
Figure 3 Number of Years a Subsurface Tile-Drainage System has been Installed.
Source USDA, ERS, “2018 Agricultural Resource Management Survey, Phase II.”
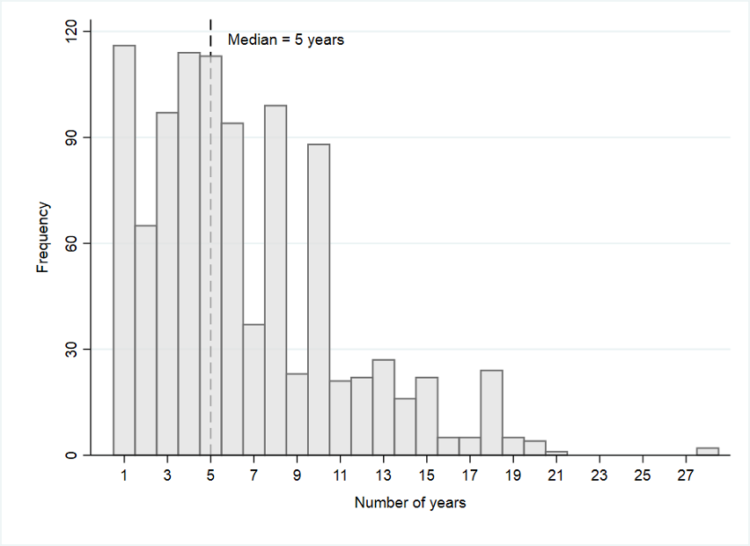
Figure 4 Number of Years a GPS Guidance Auto-Steering System has been installed.
Source USDA, ERS, “2018 Agricultural Resource Management Survey, Phase II.”
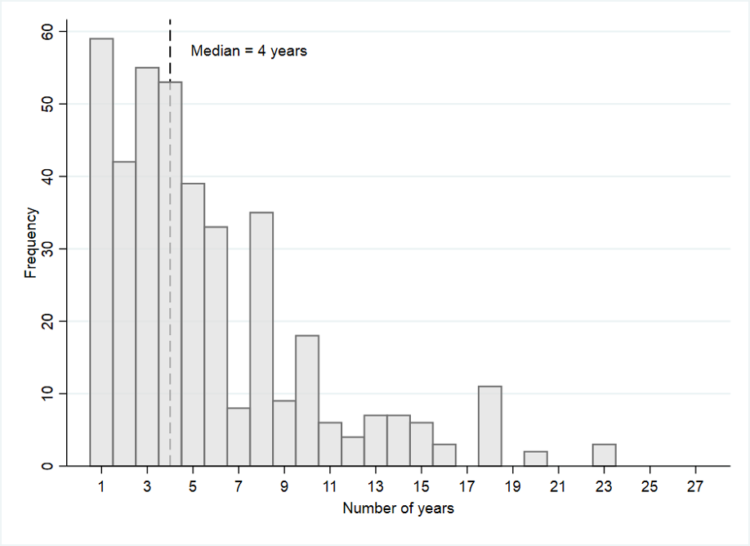
Figure 5 Number of Years a Variable Rate Technology (VRT) System has been Installed.
Source: USDA, ERS, “2018 Agricultural Resource Management Survey, Phase II.”
Tables 1 and 2 contain the summary statistics for the included crop insurance variables and technology variables, respectively. These variables are derived from Phase II of the 2018 ARMS survey. A time-based variable has also been included that represents the number of years a producer has possessed multi-peril crop insurance. This study aims to explore the relationship between years of technology adoption and years of crop insurance participation. However, sample selection bias will be present since we cannot treat observations as if they were selected at random and will yield biased results. To correct this issue, a probit selection model is implemented to ascertain whether an operation has adopted certain technologies by 2018, followed by a Poisson intensity equation to estimate the extent of that adoption (in years) and to gain a better understanding of the thought process behind these adoption decisions.
Table 1 Summary Statistics for Crop-Insurance Variables
Source: USDA, ERS, “2018 Agricultural Resource Management Survey, Phase II and III.”
Notes: These summary statistics were generated with 30 replications and 29 design degrees of freedom.
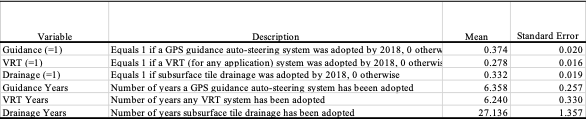
Table 2 Summary Statistics for Technology Variables
Source: USDA, ERS, “2018 Agricultural Resource Management Survey, Phase II and III.”
Notes: These summary statistics were generated with 30 replications and 29 design degrees of freedom.
Tables 3, 4, and 5 contain the results from a Poisson model with sample selection for Guidance, Variable Rate Technology, and Drainage systems, respectively. Increasing the number of years a producer has adopted a multi-peril crop insurance plan by 10 years, is correlated with an increase in the number of years a guidance system was adopted by 0.99 additional years, 0.71 additional years for a VRT system, and 5.43 additional years for a subsurface tile-drainage system. These results show that producers enrolled in the FCIP may be more likely to have adopted PATs earlier than producers who were not enrolled in a crop insurance program. This could indicate that producers do not view the FCIP as a substitute for other risk management options, or that these producers may not view these technologies in the same risk-reducing lens as they may view the FCIP.
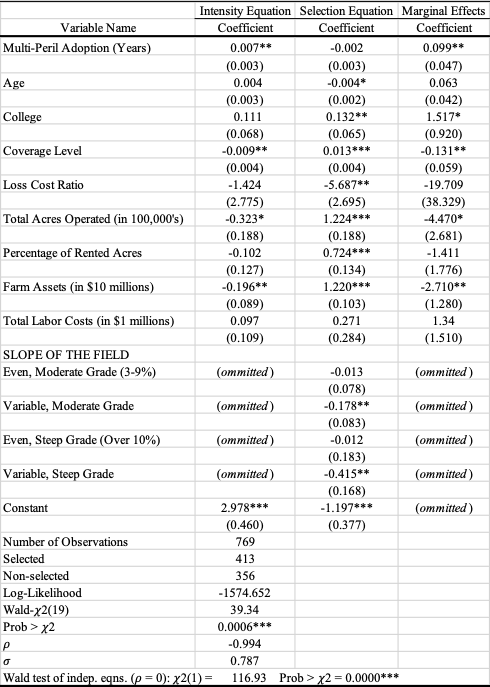
Table 3 Results from a Poisson Model with Sample Selection on Guidance Auto-Steering
Note: Significance at the 0.01, 0.05, and 0.10 levels are represented by ***, **, and * respectively.
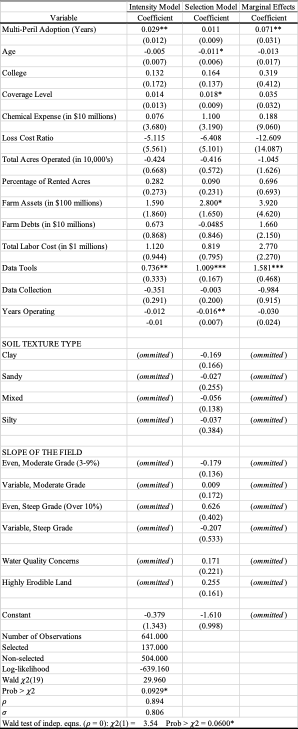
Table 4 Results from a Poisson Model with Sample Selection on VRT
Note: Significance at the 0.01, 0.05, and 0.10 levels are represented by ***, **, and * respectively.
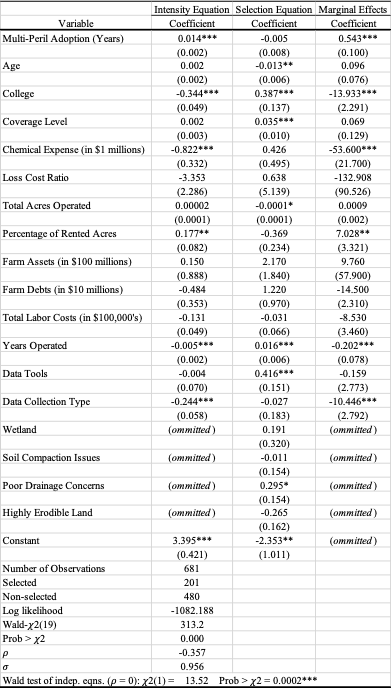
Table 5 Results from a Poisson Model with Sample Selection on Tile-Drainage
Note: Significance at the 0.01, 0.05, and 0.10 levels are represented by ***, **, and * respectively.
Additionally, counties receiving increased levels of indemnity payments may be less likely to have had PATs adopted for a longer period as compared to less risky counties (shown by the variable Loss-Cost Ratio). This is significant if we are to assume that the average level of riskiness is likely to increase due to climate change. Results were mixed for producers who elected a higher coverage level (which possesses an inverse relationship with subsidy level), as this could potentially lead to an increased number of years of VRT and subsurface tile-drainage adoption (in comparison to producers who elected lower coverage levels) but resulted in a potentially lower number of years for guidance auto-steering adoption.
Various field specific characteristics were also examined. Poor drainage concerns, moisture level, and erodibility were correlated with increases in the number of years PATs have been adopted for (among other field characteristics). Location of the operation (represented by ERS region) also led to mixed results in PAT adoption, which is understandable considering the vastly different climatic conditions across these regions. Operator specific characteristics such as age, education level, assets, debts, and aptitude with technology may also contribute to the likelihood of adoption, with mixed results. This could indicate that adoption decisions are highly personalized.
Conclusions:
Our study suggests that enrollment in the current FCIP is correlated with an increase in the average time of adoption for GPS based tractor guidance systems, variable rate technology (VRT), and subsurface tile-drainage, all referenced to as PATs throughout this article. However, a good deal of thought should be given to the effects of future FCIP incentives. Producers may come to view enrollment in the FCIP program as a substitute for other risk management practices and will adjust their strategy accordingly. However, as this evidence shows, the FCIP may be viewed as a risk management tool to be used in conjuncture with other risk-reducing practices and technologies to effectively address future market volatility, climate change impacts, and risk fluctuations.
References
Congressional Research Service. Federal Crop Insurance: A Primer (R46686), Prepared by Stephanie Rosch. Washington: Library of Congress, Feb. 18, 2021. Available from https://crsreports.congress.gov; Accessed Feb. 13, 2022.
Karl, T. R., G. A. Meehl, and C. D. Miller, eds. 2008. “Weather and Climate Extremes in a Changing Climate: Regions of Focus: North America, Hawaii, Caribbean, and US Pacific Islands.” Report by the US Climate Change Science Program.
Schimmelpfennig, David. “Farm Profits and Adoption of Precision Agriculture”, ERR-217, U.S. Department of Agriculture, Economic Research Service, October 2016.
Schoengold, Karina, et al. “The Impact of AD HOC Disaster and Crop Insurance Programs on the Use of Risk‐Reducing Conservation Tillage Practices.” American Journal of Agricultural Economics, vol. 97, no. 3, 2014, pp. 897–919., doi:10.1093/ajae/aau073.
Schneider, S., S. Semenov, A. Patwardhan, I. Burton, C. Magadza, M. Oppenheimer, A. Pittock, A. Rahman, J. Smith, A. Suarez, and F. Yamin. 2007. “Assessing Key Vulnerabilities and the Risk from Climate Change.” In Climate Change 2007: Impacts, Adaptation and Vulnerability, ed. M. Parry, O. Canziani, J. Palutikof, P. van der Linden, and C. Hanson, 779–810. Cambridge, UK: Cambridge University Press.
USDA Risk Management Agency. “Summary of Business Report.” Washington, DC: U.S. Department of Agriculture, 2000 – 2021.
Woodard, Joshua D., and Leslie J. Verteramo‐Chiu. “Efficiency Impacts of Utilizing Soil Data in the Pricing of the Federal Crop Insurance Program.” American Journal of Agricultural Economics, vol. 99, no. 3, 2017, pp. 757–772., doi:10.1093/ajae/aaw099.
![]()
![]()
![]()
![]()
![]()